
Data generation
The Milieu Intérieur cohort
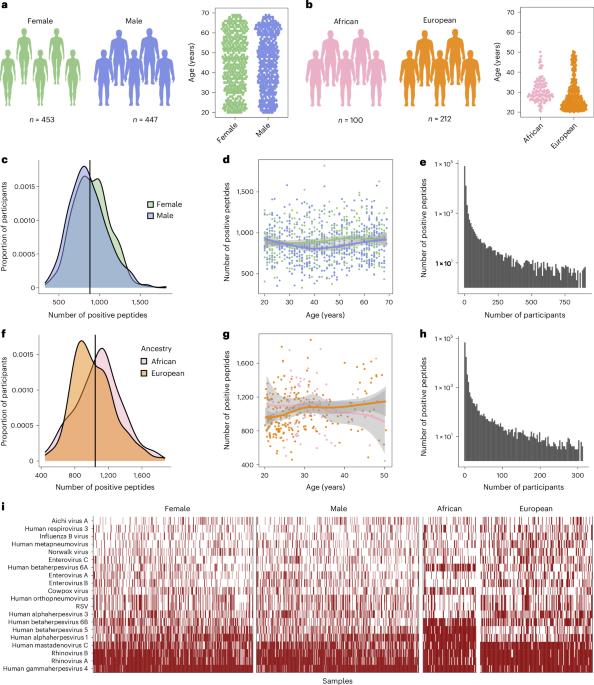
The Milieu Intérieur cohort comprises 1,000 healthy adults recruited to investigate genetic and non-genetic determinants of immune response variation19. Recruitment was conducted in Rennes (France) in 2012–2013 and individuals were selected based on a large set of relatively strict inclusion and exclusion criteria, as described elsewhere19. Of the 900 individuals reported in the present study, 453 are female and 447 are male, ranging from 20–69 years of age. The study has been approved by the Comité de Protection des Personnes—Ouest VI and French Agence Nationale de Sécurité du Médicament. The study protocol, including inclusion and exclusion criteria for the Milieu Intérieur study, has been registered on ClinicalTrials.gov under the study ID NCT01699893. The samples and data were formally established as the Milieu Intérieur biocollection (NCT03905993), with approvals by the Comité de Protection des Personnes Sud Méditerranée and Commission Nationale de l’Informatique et des Libertés on 11 April 2018. Research participants received compensation.
The EIP cohort
The EIP cohort comprises 390 healthy adults recruited to investigate human population differences in immune responses. Recruitment was conducted in Ghent (Belgium) in 2012–2013. Of the 312 individuals reported in the present study, 100 individuals reported to be born in Central Africa (AFB; age range = 20–50 years) and 212 reported to be born in Europe (EUB; age range = 20–50 years). AFB and EUB individuals presented no evidence of recent genetic admixture with populations originating from another continent, besides two AFB donors who presented 22% Near Eastern and 25% European ancestries, respectively20. All individuals were negative for serological tests against human immunodeficiency virus, hepatitis B or hepatitis C. The study was approved by the Ethics Committee of Ghent University, the Ethics Board of Institut Pasteur (EVOIMMUNOPOP-281297) and the French authorities Comité de Protection des Personnes, Comité Consultatif sur le Traitement de l’Information en Matière de Recherche and Commission Nationale de l’Informatique et des Libertés. Research participants received compensation.
VirScan experimental protocol
To investigate the virus-specific and viral peptide-specific antibody profiles in the Milieu Intérieur and EIP samples, we used PhIP-Seq using the VirScan V3 library, a pathogen-epitope scanning method combining bacteriophage display and immunoprecipitation. The detailed protocol and VirScan library are described elsewhere16,18. In brief, a library of linear peptides of 56 amino acids each was constructed to cover all UniProt protein sequences of viruses known to infect humans. Peptides were staggered along each protein sequence with an overlap of 28 amino acids. The phage library was inactivated and incubated with plasma samples normalized to total IgG concentration and controls (bead samples) to form IgG–phage immunocomplexes. The immunocomplexes were then captured by magnetic beads, lysed and sent for next-generation sequencing. Two replicates were performed for each individual, to assess reproducibility.
VirScan data pre-processing
Sequencing reads were processed as in ref. 17, with some modifications. We utilized the Bowtie 2–SAMtools pipeline51,52 to map the sequencing reads of each sample to the bacteriophage library and count the number of reads for each viral peptide. Subsequently, the positivity of each peptide was determined by a binning strategy whereby read counts from blank controls were first used to group the peptides into hundreds of bins so that the counts formed a uniform distribution within each bin. Then, the peptides from plasma samples were allocated into the pre-defined bins and Z scores were calculated for each peptide from each plasma sample. The means and standard deviations used for the Z score calculations were the same for each bin and were computed using the bead control sample read counts for the peptides belonging to that bin. After generating a matrix of 115,753 peptide Z scores for 900 Milieu Intérieur or 312 EIP samples, we discarded peptides from bacteria, fungi and allergens from the VirScan library, resulting in 99,460 viral peptides. Z score values were inverse hyperbolic sine (arcsinh) transformed. In contrast to log transformation, the arcsinh function is convenient when handling overdispersion due to both outliers and zero values, which were common in the VirScan Z score data.
Peptides of poor quality were identified by leveraging discordance across replicates. Z score values missing in only one replicate were set to missing in both replicates. Then, outliers in each replicate were defined as Z scores higher than the 99.5% quantile. The absolute difference in Z score between replicates was calculated for all peptides with an outlier value in at least one replicate. The distribution of absolute differences was bimodal, with the lower peak representing consistent Z scores between replicates and the upper peak representing inconsistent Z scores. The local minimum between the peaks was identified using the optimize function from the stats R package, and outliers were defined as all peptides with absolute differences above this minimum. The Z score values of both replicates for all outlier peptides were then set to missing. The rate of missing values was 1.06% in the Milieu Intérieur cohort and 1.09% in the EIP cohort. Next, peptides with >50% missing values were removed from the dataset, leaving 98,757 for Milieu Intérieur and 98,697 for EIP. Duplicated UniProt entries were removed, leaving 97,975 peptides for Milieu Intérieur and 97,923 for EIP for the remaining analyses.
Missing values were imputed by running a principal component analysis on all Z scores using the pca function from the pcaMethods package (nPcs = 10, scale = ‘uv’), followed by imputation using the completeObs function from the same package. As individual samples were processed in batches on cell culture plates, samples were batch corrected using the ComBat53 function from the sva R package, using plates as the batch variable (Supplementary Note). The final Z scores were generated by calculating the mean of the two replicates for each individual. A peptide was considered significantly positive if the Z scores of both replicates were >3.5. The hit variable was defined as 1 if the peptide was positive, and 0 otherwise. To generate the list of public peptides, the datasets were filtered on peptides significantly positive in >5% of tested individuals for at least two peptides per virus.
VirScan data processing with AVARDA
Between-species antibody cross-reactivity, unbalanced representation of viruses in the VirScan library and viral genome size can make peptide-level data challenging to interpret in some cases. To address these limitations and compare antibody profiles at the virus species level, we applied AVARDA21, using the code available at https://github.com/drmonaco/AVARDA. Individual VirScan peptides were aligned to each other and to a master library of all viral genetic sequences translated in all reading frames using BLAST. Evidence peptides were VirScan peptides that aligned to the master library with a bit score of >80. For each virus, AVARDA calculated a maximally independent set of unrelated peptides that explained the total reactivity toward this virus. A probability of infection for each virus was calculated using binomial testing, comparing the ratio of the number of positive evidence peptides with the total number of evidence peptides with the fractional representation of the virus in the VirScan library. Finally, cross-reactivity was evaluated by ranking all viruses based on the probability of infection. Pairs of viruses were then iteratively compared, where shared reactive peptides were assigned to the virus with the most substantial evidence of infection based solely on non-shared peptides. Once all peptides were exclusively assigned to a single virus, a final probability of infection for each sample was calculated using the binomial testing procedure described above. Additionally, a breadth score was calculated, defined as the largest number of reactive peptides from a given virus species that did not share any sequence similarities.
ELISA-based serological data
Blood was collected in ethylenediaminetetraacetic acid (EDTA)-treated tubes, and the plasma was extracted by centrifugation. Total levels of the immunoglobulins IgG, IgM, IgE and IgA were measured with a turbidimetric test on an Olympus AU400 Chemistry Analyzer. The ELISA-based serologies were measured for IgG against the following viruses and antigens: CMV, HSV-1, HSV-2, EBV, VZV, IAV, rubella, mumps and measles (Supplementary Table 1). The data processing steps for the immunoassay-based serology data are described in more detail in ref. 2. The absorbance and emission values collected in each assay were used to call serostatus. The cutoff values used for calling a sample positive or negative were given by the manufacturer and can be found in supplementary table 2 of ref. 2.
Luminex-based serological data
Milieu Intérieur plasma samples were tested for antibodies to a broad panel of common respiratory pathogens and routine vaccine-preventable diseases using bead-based multiplex assays. Samples were run at a dilution of 1:200. Plates were read using a Luminex INTELLIFLEX system and the median fluorescence intensity was used for analysis. A five-parameter logistic curve was used to convert median fluorescence intensities to relative antibody units, relative to the standard curve performed on the same plate, to account for inter-assay variation. The antigens included in the 43-plex assay are listed in Supplementary Table 1.
Viral peptide synthesis
To validate experimental associations between PhIP-seq-based Z scores and age, sex, continent of birth and smoking, the associated peptides were synthesized (Supplementary Table 1) and antibody titers against these peptides were measured by Luminex immunoassay (see next section). Peptide synthesis was performed with automated synthesizers (Genecust) and a tag was added to each peptide according to the standard protocol54, using solid-phase 9-fluorenylmethoxycarbonyl (Fmoc) chemistry. For the stalk domain of IAV HA, we used a specific chimeric protein, designated as cH6/1, comprising a A/White-fronted Goose/Netherlands/21/1999 (H6HA) head and a A/Puerto Rico/8/1934 (H1HA) stalk55. The sequence coding for cH6/1 was cloned into the pαH vector under the control of the CAG promoter. The construct included a fold-on trimerization domain and hexahistidine tag. The plasmid was transiently transfected in Expi293F (Thermo Fisher Scientific) using PEI Max (Polysciences) as a transfection reagent. One day after transfection, the flask was transferred to 32 °C and 6.5 mM sodium propionate and 50 mM glucose were added. Following incubation, the cell culture supernatant was clarified and the recombinant cH6/11 protein was captured on an Ni-NTA column (Ni-advance HiFli; Protein Ark) and stored in small aliquots at −80 °C until further use.
Peptide Luminex-based serological data
We validated associations between PhIP-seq-based Z scores and age, sex, continent of birth and smoking by measuring antibody titers against relevant viral peptides using multiplex Luminex immunoassays. To couple viral peptides to MagPlex microspheres, we adapted the protocol from ‘Modification of microspheres with ADH’56 and Wakeman et al.54. The first step comprises modifying the microspheres with adipic acid dihydrazide (ADH; Sigma–Aldrich). The second step comprises coupling the peptides to ADH-modified microspheres. The stock uncoupled microspheres were sonicated and vortexed for 30 s. Subsequently, 2.5 × 10⁶ microspheres (200 µl) were transferred to an Eppendorf tube and washed once with 1 ml 0.1 M 2-(N-morpholino)ethane sulfonic acid (MES) (pH 6.0) using a magnetic separator. The beads were then activated for 2 h on a rotator at room temperature containing 1 ml of 35 mg ml−1 of ADH and 200 µl of 200 mg ml−1 of 1-ethyl-3-(3-dimethylaminopropyl) carbodiimide hydrochloride (50 mg ml−1; Sigma–Aldrich). The 1-ethyl-3-(3-dimethylaminopropyl) carbodiimide hydrochloride was prepared extemporaneously in 0.1 M MES (pH 6.0) immediately before use. Following activation, the beads were washed three times with 0.1 M MES (pH 4.5) and resuspended in 1 ml of 0.1 M MES (pH 4.5). The beads were stored at 4 °C overnight.
One day after the ADH modification of microspheres, they were washed once with 1 ml of 0.1 M MES (pH 6.0) using a magnetic separator and resuspended in 350 µl of 0.1 M MES (pH 6.0) with 20 µg of each peptide, 10 µl EDC and 10 µl hydroxysulfosuccinimide sodium salt (50 mg ml−1; Sigma–Aldrich). This suspension was incubated for 2 h 30 m in the dark on a rotator. After incubation, the beads were washed twice with 0.1 M MES (pH 6.0) and blocked with 500 µl of 0.1 M MES (pH 6.0) containing 300 µg of each peptide for 1 h at room temperature in the dark in a rotator. After blocking, the beads were washed twice with 0.1 M MES (pH 6.0) and resuspended in 1 ml PBS-TN. The beads were stored at 4 °C. One day after the coupling process, all coupled beads were counted using a TC20 Automated Cell Counter (Bio-Rad). Serum samples were run at a 1:400 dilution. Plates were read using the Intelliflex system at a low detector sensitivity and the median fluorescence intensity was measured.
Serostatus prediction
We assessed the performance of different methods that predict serostatus from the VirScan data by comparing the predicted serostatus with the ELISA-based serostatus obtained in the same 900 Milieu Intérieur donors. We focused on predicting serostatus for four common viruses for which ELISA data were available: CMV, EBV (EBNA-1 and EA-D), HSV-1 and HSV-2 (Supplementary Note and Supplementary Table 2). We considered four alternative approaches: (1) the hit-based heuristic method, which assigns seropositivity for a given virus when the number of hits is >3 or >5 (as in ref. 16); (2) the hit-based optimized method, which involves searching for the number of positive hits for a given virus that maximizes prediction precision and recall; (3) the AVARDA-based optimized method, which involves searching for the threshold value of the AVARDA breadth score for a given virus that maximizes prediction precision and recall; and (4) an elastic net penalized logistic regression trained from a subset of the VirScan Z score data.
To train the elastic net model, we shuffled and split the data into a training set (70% of the data) and a test set (30%) so that the ratio of seropositive to seronegative samples in both sets was the same as in the original data. We only considered VirScan peptide Z scores for the tested virus as features during feature selection. Two complementary approaches were implemented to reduce overfitting: we discarded features with variance lower than a user-specified threshold, defining a first hyper-parameter, and kept the features with univariate association statistics higher than a user-specified percentile, defining a second hyper-parameter. A grid-based approach was used to optimize the two hyper-parameters and the ratio between elastic net L1 and L2 penalty, performing a fivefold cross-validation for each point of the three-dimensional grid. We visually inspected learning curves to ensure the absence of overfitting. Processing and modeling were carried out using Python 3.12.2 and the following packages: numpy 1.26.4, scipy 1.12.0, pandas 2.2.1 and scikit-learn 1.4.1.post1. All of the packages were installed in a conda 24.3.0 environment for reproducibility.
To estimate serostatus for the M1 protein of IAV, for which no ELISA data were available, we fitted a two-component Gaussian mixture to the non-transformed Z scores using the mclust R package, and considered the 95% percentile of the left distribution to be the threshold for seropositivity.
Flow cytometry data
Ten eight-color flow cytometry panels were previously established22 to count blood cell types, including 78 counts for 27 innate immune cell subtypes and 51 adaptive immune cell subtypes. The protocols, panel design, staining antibodies and gating strategies used to acquire and analyze flow cytometry data are detailed elsewhere22. In brief, cells were acquired using two MACSQuant analyzers calibrated with MACSQuant Calibration Beads (Miltenyi Biotec). Generated MQD files were converted to FCS format and analyzed with FlowJo. Then, 313 immunophenotypes (cell counts, cell proportions, median fluorescence intensity values and ratios) were exported from FlowJo, including 78 cell counts used in this study. The exclusion of problematic and outlier values was described previously22. Some 74 donors failed quality control for the T cell panel and were thus excluded. The remaining missing values were imputed by random forest-based imputation using the missForest R package.
Kappa-deleting recombination excision circles assay
To evaluate whether B cell renewal affects antibody levels, we tested the association between all public peptide Z scores and circulating levels of kappa-deleting recombination excision circles (KRECs; that is, excised signal circular DNA segments generated in B cells during their maturation in bone marrow). KRECs serve as surrogates of new B cell output, as they persist in B cells and are diluted with cell division57. KREC quantification was performed as in ref. 58, with some modifications. Whole-blood genomic DNA (1–2 µg) was pre-amplified for 3 min at 95 °C and then 18 cycles of 95 °C for 15 s, 60 °C for 30 s and 68 °C for 30 s, in a 50 µl reaction containing primers, 200 µM of each dNTP, 2.5 mM MgSO4 and 1.25 U Platinum Taq DNA Polymerase, High Fidelity (Thermo Fisher Scientific) in 1× buffer. The forward and reverse primers were TCAGCGCCCATTACGTTTCT and GTGAGGGACACGCAGCC for signal joint KRECs and CCCGATTAATGCTGCCGTAG and CCTAGGGAGCAGGGAGGCTT for coding joint KRECs, respectively. The probes were CCAGCTCTTACCCTAGAGTTTCTGCACGG (signal joint KRECs) and AGCTGCATTTTTGCCATATCCACTATTTGGAGTA (coding joint KRECs). Columns of 48.48 Dynamic Array Integrated Fluidic Circuits (Fluidigm) were loaded with 5 µl of a mixture containing 2.25 µl of a 1/2,000th dilution of pre-amplified DNA, 2.5 µl of 2× Takyon Low ROX Probe MasterMix (Eurogentec) and 0.25 µl of sample loading reagent. Rows were loaded with an equal mixture of 2× Assay Loading Reagent and 2× Assay Biomark containing only the two primers and the probe specific for each assay. These columns were subjected to 40 cycles of PCR (95 °C for 15 s and 60 °C for 60 s) in a Biomark HD system (Fluidigm). Coding and signal joint KRECs were normalized to 150,000 cells using quantification of the albumin gene as an endogenous control.
Genome-wide SNP genotyping
Details about SNP array genotyping of the Milieu Intérieur cohort are available elsewhere22. DNA was extracted from whole blood collected on EDTA using the Nucleon BACC3 Genomic DNA Extraction Kit (RPN8512; Cytiva). The 1,000 Milieu Intérieur individuals were genotyped using the HumanOmniExpress-24 BeadChip (Illumina), and 966 were also genotyped using the HumanExome-12 BeadChip (Illumina). After applying quality control filters, the SNP array datasets from the two genotyping platforms were merged. SNPs that were discordant in genotypes or position between the two platforms were removed, yielding a final dataset containing 732,341 genotyped SNPs. The dataset was then phased using SHAPEIT2 (ref. 59) and imputed using IMPUTE2 (ref. 60), with 1 Mb windows and a buffer region of 1 Mb. After imputation, SNPs with an information metric of ≤0.8, duplicated SNPs, SNPs with a missingness of >5% and SNPs with a minor allele frequency of ≤5% were removed, generating a final dataset of 5,699,237 SNPs. We removed 13 individuals based on relatedness and admixture22. Finally, the dataset was converted to GRCh38 using the LiftoverVcf function from the GATK software package61.
Details about SNP array genotyping of the EIP cohort are available elsewhere20. Peripheral blood mononuclear cells were isolated from blood collected into EDTA vacutainers, monocytes were removed with CD14+ microbeads, and DNA was isolated from the monocyte-negative fraction using a standard phenol–chloroform protocol, followed by ethanol precipitation. Genotyping was performed in all individuals using the HumanOmni5-Quad BeadChip (Illumina) and whole-exome sequencing was performed with the Nextera Rapid Capture Expanded Exome kit. The SNP array genotyping and whole-exome sequencing data were processed separately and merged. For the SNP array data, SNPs were passed through multiple quality control filters, and SNPs originating from the sex chromosomes were removed. For the whole-exome sequencing data, reads were processed according to GATK Best Practices. Discordant variants between the two datasets were removed before merging the SNP array and whole-exome sequencing datasets. After combining the two datasets, the data were phased using SHAPEIT2 and imputed using IMPUTE2, with 1 Mb windows and a buffer region of 1 Mb. After imputation and additional quality control filtering, 19,619,457 SNPs remained. The dataset was converted to GRCh38 using the LiftoverVcf function from the GATK software package61. Finally, four individuals were removed based on relatedness and admixture20.
Whole-genome sequencing
Whole-genome sequencing was performed by the Centre National de Recherche en Génomique Humaine at the Institut de Biologie François Jacob. After quality control, 1 µg genomic DNA was used to prepare a library using the Illumina TruSeq DNA PCR-Free Library Preparation Kit, according to the manufacturer’s instructions. After normalization and quality control, qualified libraries were sequenced on an Illumina HiSeq X5 platform as paired-end 150 bp reads. One lane of HiSeq X5 flow cell was produced for each sample in order to reach an average sequencing depth of ~30× for each sample. FASTQ files were mapped on the human reference genome version hs37d5, using BWA-MEM with default options62. BAM file integrity was verified and duplicated reads were identified with PicardTools and SAMtools. Reads were realigned and recalibrated with GATK61 version 4.1. Sequencing reads mapping to the HLA, IGH, IGK and IGL loci were extracted from the mapped BAM files. Genotypes were called in each individual with HaplotypeCaller in GVCF mode. Multi-sample genotype calling was performed jointly on combined GVCF files with GATK GenotypeGVCFs. After variant quality score recalibration, variants that passed the tranche sensitivity threshold of 99.0% were selected. Multiallelic sites were split into several biallelic sites with bcftools norm -m-both and variants spanning deletions were filtered out. Genotypes were set to missing if the depth of coverage was <8× or the genotype quality was <20. Based on kinship coefficients estimated with KING63, ten related individuals and one individual detected as contaminated were excluded. Finally, variants with a minor allele frequency of <0.05, a Hardy–Weinberg equilibrium P value of <10−10 (calculated using the HWExact function from the GWASExactHW R package) or a call rate of <0.95 were discarded, resulting in a total of 30,503 common variants near and within immunoglobulin genes.
Statistics and reproducibility
Testing associations between VirScan Z scores and non-genetic factors
All statistical associations were tested using multiple regression models. In all models, the dependent variable was either an asinh-transformed VirScan Z score (for a given peptide) or an AVARDA breadth score (for a given virus). The independent variables could be: (1) serological measurements based on ELISA; (2) serological measurements based on Luminex xMAP assays; or (3) age, sex, continent of birth and candidate non-genetic factors, including smoking, diet, past diseases, health biomarkers and anthropometric measures (Supplementary Table 3). The three groups of variables, (1), (2) and (3), were treated as independent families of tests and P values were adjusted for multiple testing accordingly, using the false discovery rate procedure. Tests within the Milieu Intérieur and EIP cohorts were also considered independent. As detailed below, the specific model and complete list of covariates used varied depending on the independent variables being tested.
The effect size of each independent continuous or binary variable was estimated and tested for being non-null (that is, the two-sided alternative hypothesis) using the linear regression model implemented in the glm R function. The β value was used to determine the effect size of the independent variable. When the independent variable was categorical with more than two levels, an analysis of covariance model was applied using the aov R function. In the association analyses of the Milieu Intérieur cohort, age and sex were systematically included as covariates. We also investigated nonlinear effects of age by testing an analysis of variance model that models age as a factor with five ten-year levels. In addition, we tested for age × sex, age × smoking and sex × smoking interactions by adding an interaction term to the linear model. The only analyzed independent variables for the EIP cohort were age and continent of birth. As all individuals in the EIP cohort were male, sex was not used as a covariate in these analyses. When age was used as the variable of interest, the continent of birth was controlled for, and vice versa. To separate genetic from non-genetic effects of continent of birth, we performed an additional analysis that also included genetic variants that influenced the antibody repertoire (Supplementary Table 7; see the section ‘Estimation of the proportion of variance explained’ below).
To leverage the high resolution of the VirScan peptide library while accounting for between-species antibody cross-reactivity, we first tested the association between all public peptide Z scores and non-genetic factors and then evaluated whether AVARDA breadth scores for the tested viruses were associated with the corresponding factors. We considered three scenarios: (1) both the Z scores for several peptides of a given virus and the AVARDA score for the same virus were associated with the candidate factor in the same direction, interpreted as a true association; (2) the Z scores for several peptides of a given virus were associated with the candidate factor in the same direction, but the AVARDA score for the same virus was not, interpreted as a false association due to cross-reactivity; and (3) the Z scores for several peptides of a given virus were associated with the candidate factor in opposite directions, but the AVARDA score for the same virus was not associated, interpreted as true associations obscured by opposite epitope-specific effects.
Testing associations between VirScan scores and genetic factors
GWAS was conducted on the asinh-transformed VirScan Z scores in the Milieu Intérieur cohort. The EIP cohort was used as a replication cohort. To correct for population stratification, a principal component analysis was run on all SNPs, and the first two principal components were included as covariates. Age was included as a covariate for both cohorts, and sex was included as a covariate for the Milieu Intérieur cohort only. The population of origin was included as an additional binary covariate for the EIP cohort. The GWAS analyses were conducted using the assocRegression function from the GWASTools R package64, using a linear additive model. The genome-wide significance threshold was defined as P = 1.31 × 10⁻¹⁰ (that is, the minimum P value obtained by running the GWAS of the 2,608 peptide Z scores after randomly permuting donor identifiers). Manhattan plots, locusZoom plots and tables were all made using the topr R package65.
HLA allele imputation and association testing
HLA allele imputation was done using whole-genome sequencing data of the HLA locus (here defined as position 28–35 Mb in GRCh37), using all variants in the region with a minor allele frequency of ≥5%. Imputation was conducted on the Michigan Imputation Server66, using the four-digit multi-ethnic HLA reference panel (version 2). Association testing was conducted similarly to individual SNP analysis but using HLA allele dosages instead of SNP genotypes.
Estimation of the proportion of variance explained
The proportion of variance explained by demographic and genetic factors was estimated for the VirScan Z scores of the 2,608 public peptides in the Milieu Intérieur cohort. Genetic factors were the most associated SNPs identified through conditional GWAS (that is, by testing associations with all variants while controlling for hitherto identified lead SNPs). This process was continued until no more SNPs with a P value below genome-wide significance (P < 1.31 × 10⁻¹⁰) were identified, leaving a total of 17 SNPs (Supplementary Table 7). Age, sex and smoking were included as demographic factors. The contribution of each of these 20 variables to the variance of each peptide Z score was estimated using the relaimpo R package67.
Estimation of viral evolutionary rates
To estimate evolutionary rates for each residue of the IAV HA and M1 proteins (Fig. 2), HA sequences for all H3 subtypes and M1 sequences for the H5N1 subtype with collection dates between 1 January 1975 and 1 January 2013 were retrieved from the GISAID EpiFlu database on 13 June 2025. Removing sequences with gaps or ambiguities resulted in 4,209 HA sequences and 3,301 M1 sequences. The accession number, virus name, collection date, originating laboratory, submitting laboratory and contributors of each individual sequence can be accessed under the accession codes EPI_SET_250807be (https://doi.org/10.55876/gis8.250807be) and EPI_SET_250807kf (https://doi.org/10.55876/gis8.250807kf), respectively. Normalized evolutionary rates were calculated for each residue with the empirical Bayesian inference from ConSurf-DB68.
Phylogenetic analyses
All UniProt amino acid sequences used to build the VirScan peptide library for RSV protein G were aligned with the msa function from the msa package69. The 41-amino-acid-long region that was covered by the largest number of UniProt sequences was identified. Based on this shared region, a distance matrix between all UniProt sequences was computed with the DistanceMatrix function from the DECIPHER package70, and complete-linkage clustering was used to obtain a phylogenetic tree using the hclust R function. Strain annotations were then interpolated for all VirScan peptides using the constructed tree.
Reporting summary
Further information on research design is available in the Nature Portfolio Reporting Summary linked to this article.