
Mice
All animal experiments were performed in compliance with respective national and federal regulations and approved by animal welfare authorities (Regierungspräsidium Freiburg, French Ministry of Higher Education and Research). C57BL/6JCrl (Charles River) served as WT mice. Ccr2-KO mice were from The Jackson Laboratory (B6.129S4-Ccr2tm1Ifc/J, Jax #004999). Cx3cr1CreERT2 (ref.63), Cxcr4CreERT2 (ref. 39), HexbCreERT2 (ref. 18), Mrc1CreERT2 (ref. 12) and Ccr2CreERT2 (ref. 24) (Jax #035229) lines were crossed with R26tdT (ref. 64) (Jax #007914) or R26YFP (ref. 65) (Jax #006148) reporter lines. Mice were bred under specific-pathogen-free conditions and housed under a regular light–dark cycle at 20–22 °C and 50–60% humidity. Both sexes were included in each group. Age of first gavage was 10 ± 3 weeks.
Tamoxifen treatment
TAM in corn oil (both Sigma-Aldrich) was injected i.p. using Cre-driver line-adjusted protocols: 1 mg TAM per 100 μl oil for 5 days (Cxcr4CreERT2R26tdT), 4 mg 200 μl−1 twice 48 h apart (Cx3cr1CreERT2R26tdT, Mrc1CreERT2R26tdT) in 5–9-week-old animals, 0.4 mg 20 µl−1 on P7 and P9 (HexbCreERT2R26yfp) or 2 mg 200 μl−1 three times 48 h apart (Ccr2CreERT2R26tdT).
BLZ treatment
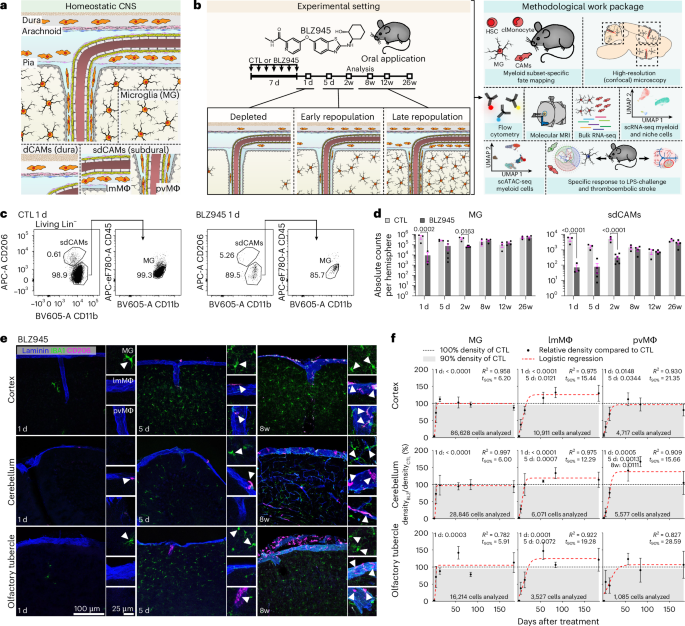
BLZ945-HCl (Novartis) at 27.28 mg ml−1 in aqueous 20% hydroxypropyl-β-cyclodextrin (CTL; Sigma-Aldrich) solution was applied through oral gavage (200 mg kg−1 BW) daily for 7 days.
Antibodies
Information about all antibodies used throughout the study can be found in Supplementary Table 1.
Antibody injections
For adhesion blockade in vivo, antibodies or isotype controls were mixed in InVivoPure, pH 7.0 Dilution Buffer (BioXCell) injected i.p. (200 µg per antibody in 100 µl, every other day for seven injections) starting on the last day of gavage.
Bone-marrow transplantations
Recipient mice were anesthetized with 20 µl of a 1:1 medetomidin (Domitor, Orion Pharma)/ketamine (Ketamin 10%, Serumwerk) mixture, positioned under a ~1-cm thick lead shield covering the head, and irradiated with 11 Gy (X-ray irradiator, Rad Source RS2000). After 24 h, femurs and tibias from sex- and age-matched donor mice (1:2 donor:recipient ratio) were flushed with ice-cold PBS, filtered (100 µm) and centrifuged (4 °C, 300g, 5 min). Red blood cells were lysed (1 ml eBioscience RBC lysis buffer, Thermo Fisher), washed and resuspended at 1 × 10⁵ cells per µl in PBS, filtered (100 µm), and ~15 × 106 cells were injected intravenously into recipients. Mice were housed in IVC cages and received neomycin-sulfate drinking water (1.1 g l−1; Sigma-Aldrich) for 14 days. Blood chimerism was assessed 4 weeks post-transplantation.
LPS injections
Mice were i.p. injected with LPS (Sigma-Aldrich, L2880) in PBS at 2.5 mg kg−1 bodyweight or PBS alone 12 h before killing.
Thromboembolic stroke model
Purified mouse α-thrombin was injected into the middle-cerebral artery (MCA) to induce occlusion as previously described48. In brief, mice were anesthetized, fixed, craniotomized, the dura was removed and a glass micropipette was inserted into the MCA to inject 1 μl thrombin (2 IU μl−1 for WT). The pipette was withdrawn after 10 min for thrombus stabilization. Cerebral blood flow was monitored by laser Doppler up to 20 min after occlusion. Lesion volume was assessed by MRI at +1 d. Experiments followed STAIR recommendations. Group sizes were based on previous studies47,48. RNA-seq experiments were performed at two independent centers. Animals were excluded if they died perioperatively or had infarcts <5 mm³ (2 of 34 mice).
MRI procedure
MRI was performed as previously described48. Mice were anesthetized and imaging was performed on a 7T Pharmascan scanner (Paravision v.6.0.1). T2-weighted multislice multiecho images (TE/TR 33/2,500 ms) were used to quantify lesion volumes with ImageJ. T2*-weighted sequences assessed hemorrhage (0–2 scale) and two-dimensional time-of-flight angiography (TE/TR 12/7 ms) evaluated MCA recanalization using a thrombolysis in cerebral infarction-like scoring system (0–3).
Molecular magnetic resonance imaging
Molecular MRI was performed as previously described42,47. MPIOs were conjugated to anti-P-selectin or anti-VCAM-1 antibodies. Conjugation was verified by intrastriatal LPS injection followed by 3D T2*-weighted imaging. MRI was performed immediately after intravenous injection of conjugated MPIOs (200 μl, 2 mg Fe per kg) at 70-μm isotropic resolution (TE/TR 13.2/200 ms; flip angle 21°). Images were displayed as minimum intensity projections of six slices, and signal voids were quantified in ImageJ using automated thresholding and expressed as the percentage of void area within the region of interest.
Corridor test
Sensorimotor performance was assessed using a corridor exploration task. A black PVC corridor (150 × 6 × 16 cm) with five objects (2 cm) on each side, spaced 18.5 cm apart, 1 cm above the floor was used. Object shape and color varied between test days. After 15 min habituation, mice explored the corridor freely for 1 min, and object explorations were recorded.
Grip strength test
Forepaw grip strength was measured using a BIOSEB grip strength meter. Mice were placed at a T-bar and gently pulled by the tail. Measurements were taken at baseline (day before MCAO), and at 24 h and 5 days post-MCAO. Each session consisted of five trials with 1-min rest intervals, and mean force was calculated. Mean strength deficit relative to baseline was calculated for each mouse.
Immunofluorescence
After transcardial perfusion with PBS, brains were fixed for 5–6 h in 4% PFA, put in 30% sucrose in PBS until saturation, embedded in Tissue-Tek O.C.T. (Sakura Finetek), frozen at −80 °C, sliced (Leica CM1900) at 20 µm (analysis) or 50 µm (representative images), rehydrated in PBS (5 min) and permeabilized for 1 h (5% bovine serum albumin and 0.5% Triton X-100 in PBS). Brain sections were processed free floating or on slides in upright racks. Primary antibodies were added (overnight, 4 °C) in blocking buffer. Secondary antibodies were applied (2 h). Coverslips were mounted with ProLong Diamond (Thermo Fisher Scientific) or with Mowiol.
Immunohistochemistry and H&E staining
Chromogenic IHC66 and hematoxylin and eosin (H&E) staining were conducted on 3-µm-thick FFPE sections. IHC used the labeled streptavidin–biotin technique. The slides were deparaffinized in xylene, subjected to heat-induced antigen retrieval in EnVision low pH buffer (40 min) and treated with 3% hydrogen peroxide (Carl Roth, 8070.1) for 10 min. Blocking solution (10% normal goat serum (SouthernBiotec, 0060-01), 1% Triton X-100 (Sigma, T8787-100ML) and TRIS buffer (EnVision Flex Wash Buffer, DAKO, K8000), at pH 7.2, 1 h) was applied. The primary antibody was incubated overnight. Slides were washed and treated with secondary antibody (45 min) and washed. Streptavidin-HRP (7105-05, SouthernBiotech, 1:1,000 dilution in Tris buffer, 45 min) was applied. Sections were washed, exposed to DAB solution (one drop of EnVision Flex DAB Chromogen per 1 ml of EnVision Flex Substrate Buffer) and counterstained (Gill’s hematoxylin solution (Sigma, 1051750500). For H&E staining, slides were deparaffinized, rehydrated through graded ethanol to water and stained with Gill’s hematoxylin. After rinsing, sections were differentiated in 0.3% acid alcohol (1% HCl in 70% ethanol, 5–10 s), rinsed and blued (0.1% sodium bicarbonate, 1 min). Eosin Y (0.5% in ethanol) staining was performed (1 min), followed by dehydration through ascending ethanol and clearing in xylene (2 × 5 min). Coverslips were mounted with Vitro-Clud (R. Langenbrinck, 04-0001).
Wholemounts
Leptomeninges were sliced off from fixed brains, cut into 3 × 3-mm pieces and processed as described under the immunofluorescence section.
Microscopy
Imaging was conducted with a conventional fluorescence microscope (Keyence BZX or Leica Thunder Imager, quantification) or with a TCS SP8 X confocal (Leica, LAS X 3.5.7.23225, representative images) using a ×20 0.75 NA objective (HC PL APO 20x/0.75 IMM CORR CS2).
Flow cytometry
Flow cytometry was conducted as described previously3. In brief, around 100 µl of blood were collected in PBS with 0,5 mol l−1 EDTA at pH 8.0 and lysed three times with Red Blood Cell Lysis Buffer (Thermo Fisher Scientific) before the staining procedure. Animals were then perfused transcardially with ice-cold PBS. MG and sdCAMs were isolated from whole brain for the experiments in Figs. 1 and 3, otherwise choroid plexuses were removed under a stereomicroscope. For digestion, brains were homogenized in HBSS containing 0.1 mg ml−1 DNase I (Roche) and 0.2 mg ml−1 Liberase (Roche) and put in a shaker at (37 °C, 1,000 rpm, 15 min). Cells were filtered, density centrifuged, cleaned of myelin, washed and used for the staining procedure. For dCAM data, cranial dura mater was removed from the cranial bone under a stereomicroscope and digested in 0.5 mg ml−1 Collagenase IV (Sigma-Aldrich) in PBS (30 min, 37 °C). Cell suspensions were mechanically dissociated, filtered, washed and used for the staining procedure. To analyze niche cells from different compartments, cranial dura, choroid plexus, leptomeninges and the cortical parenchyma were separated and enzymatically digested. Dura and the parenchyma were put into 0.2 mg ml−1 collagenase P (Sigma), 60 U ml−1 DNase I (Applichem), 0.3 U ml−1 Dispase I (Roche), 2% FCS and 20 mM HEPES in RPMI 1640 (all three Lonza) and digested (pH 7.2, 37 °C, 15 min, three cycles). For leptomeningeal dissociation, 0.2 mg ml−1 collagenase type 2, with two 5-min digestion steps was applied. Cells were then washed. From cortical samples, myelin was removed by density centrifugation. For the staining procedure, first, an Fc Block was applied (5 min, 4 °C) and samples were incubated with antibodies for 45 min (for blood 20 min, 4 °C). After washing, cells were sorted using an Aria III or analyzed using a LSRFortessa (Becton Dickinson). Dead cells were defined by labeling with Fixable Viability Dye (65-0866, eBioscience) or DAPI. Data were acquired with FACSDiva (Becton Dickinson). Post-acquisition analysis was performed using FlowJo v.10.10.
Single-cell RNA-sequencing
After isolating whole brain and removing choroid plexuses under a stereomicroscope, for Fig. 2, cerebral cortex, leptomeninges and dural immune and niche cells were sorted by gating DAPI− cells and then for CD11b+CD45+ (immune), CD31+ (endothelial), PDPN+ (fibroblasts) and marker-negative (other cell types) cells as described in the flow cytometry section and as seen in the gating strategies (Supplementary Fig. 1). For Fig. 5, only CD45+CD11b+Gr-1−CD11c− cells were sorted from brain devoid of choroid plexus. Afterwards, the 10x scRNA-seq platform using the Chromium controller with the Chromium Next GEM Single Cell 3’ kit v.3.1 (Fig. 5) or Next GEM Single Cell 3’ HT kit v.3.1 (Fig. 2) (10x Genomics) was applied. Amplification of complementary DNA and library preparation were conducted following the manufacturer’s instructions. Libraries were sequenced on a NextSeq1000 Sequencer (Illumina) appropriate for obtaining 20,000 reads per cell. The resulting fastq files were further processed using the Cell Ranger v.7.1.0 pipeline (10x Genomics) for demultiplexing, read alignment to the mouse genome (GRCm39 or mm10; Cre, tdTomato, WPRE-QY added as chromosomes) and gene count determination.
Doublet detection, quality control and analysis of the single-cell transcriptomic data
Transcriptomic data was analyzed in RStudio (build 764) with R programming language (v.4.4.0). The feature bc matrices were loaded with Seurat (v.5.0.3)67.
For Fig. 2, count matrices were filtered for low-quality cells (features 200–6,000, mitochondrial RNA < 5%) and doublets were removed using scDblFinder (v.1.16.0) after conversion with as.SingleCellExperiment68. Singlets were retained and merged into one Seurat object. Standard Seurat preprocessing was applied (NormalizeData, FindVariableFeatures (5,000), ScaleData, RunPCA, ElbowPlot, RunUMAP, FindNeighbors and FindClusters). Cells were manually inspected with CellSelector and cells expressing multiple lineage markers were removed12,18,29. Visualization used UMAP/DimPlot69. Batch correction was performed using Harmony70 (Split and IntegrateLayers), followed by the standard Seurat workflow using the Harmony reduction. The integrated object was converted to SingleCellExperiment and annotated with SingleR71. Major cell classes were subset (fibroblasts, endothelial, vascular smooth muscle cells, pericytes, immune and others) and subtypes manually annotated using FindAllMarkers with established literature3,22,33,34,35,36,37 and previous biological knowledge. CellChat72 was used to infer cell–cell interactions within the dura and leptomeninges/cortex. For macrophage-niche communication, CellChat objects were split into CTL, 5 d and 8w, top interaction partners were identified (excluding self-loops and niche–niche interactions) and interactions with homeostatic and repopulating macrophages were visualized.
For Fig. 5, processing was carried out as for Fig. 2, but cells were filtered for features 200–3,000 and mitochondrial RNA < 5% and Seurat preprocessing differed for FindVariableFeatures (2,000; excluding artificial, mitochondrial and ribosomal genes). A metadata column for tdTomato+WPRE-QY expression was added. Batch correction was performed using CCA73 (SplitObject, FindIntegrationAnchors and IntegrateData), followed by the standard Seurat workflow. Two additional low-quality clusters were removed based on low nCountRNA/nFeatureRNA and low gene expression. The standard Seurat workflow was applied to the updated object. Cell types were annotated based on known cell-type-specific marker genes, shown in Fig. 6a.
CAM and MG subset analysis
CAMs and MG were subsetted, reintegrated by CCA, and processed using the standard Seurat workflow. The integrated data slot was used for downstream analysis. Clustering resolution was set to 0.25 for both. Heatmap genes were filtered for adjusted P < 0.05, log2fold change > 0.59, pct.1 > 0.2 and pct.1–pct.2 > 0.15, showing up to 30 genes per cluster. Volcano plots (BLZ945 versus CTL) were generated using FindMarkers (pct.min = 0.2). Cluster proportion changes were assessed using the propeller workflow (speckle)74. For CAMs, CAM2 was compared to CAM1 + 3 using FindMarkers (pct.min = 0.2). Overlapping DEGs (adj. P < 0.05, pct.1 > 0.2) between treatment and cluster comparisons were visualized using VennDiagram75; top ten genes up/down by log2fold change are shown. GO analysis was performed with EnrichGO (clusterProfiler) using significant cluster 2 versus 1 + 3 genes and nonzero genes as background, followed by simplify (cutoff of 0.7)76. YS-derived and HSC-derived gene modules were derived from bulk RNA-seq (adj. P < 0.05; log2fold change > 1 or <−1) and visualized in CAM subsets using AddModuleScore with FeaturePlot or DoHeatmap.
Bulk RNA-seq of CNS macrophages and stroke tissue
CAMs, sdCAMs, dCAMs and MG were isolated by FACS from dissociated mouse brains (processed as described in the flow cytometry section) and sorted into RNA Protect Cell Reagent (QIAGEN); total RNA was extracted using the PicoPure RNA Isolation kit. First-strand cDNA was generated from 150–600 pg RNA using the SMARTer Ultra Low Input RNA kit v.4, followed by long-distance-PCR amplification (12–14 cycles), bead purification, Nextera XT library preparation, equimolar pooling and 50-cycle single-read sequencing on Illumina HiSeq 1000; reads were aligned to Gencode M36/mm10 or GRcm39 with STAR v.2.7.11a and counted with FeatureCounts v.2.0.8. In the post-repopulation experiment (Fig. 5), CAMs from Mrc1CreERT2R26tdT mice were sorted (tdT⁺ and tdT⁻ CD206⁺). Lowly expressed genes (sum counts <10 in ≥75% of samples) were removed before performing DESeq2 differential expression, lfcShrink(apeglm), heatmaps of significant DEGs (Padj ≤ 0.05, |log2fold change | ≥ 1; n = 380), volcano plots and enrichGO analysis. For LPS stimulation, MG and (all or tdT⁺/tdT⁻) sdCAMs were isolated from Ccr2CreERT2R26tdT, WT or Ccr2−/− mice 12 h after LPS (2.5 mg kg−1) or PBS. dCAMs were assessed in a separate experiment. Lowly expressed genes (sum count < sample number/2) were filtered, ComBat-seq batch correction was applied to WT/Ccr2−/− datasets (batch = batch, group = treatment; covariates = genotype, cell type). To ensure the quality of RNA-seq analysis and focus on immune response-related gene expression, genes in the KEGG_ribosome pathway, KEGG_oxidative_phosphorylation pathway (msigdbr), biomaRt pseudogenes, predicted genes, novel or uncharacterized genes as well as biomaRt noncoding genes (lincRNA, miRNA, snRNA and snoRNA) and genes with substrings associated with such pathways (‘Mrp’, ‘Rpl’, ‘Rps’, ‘Sn’, ‘Sf’, ‘Gtf’, ‘Med’, ‘Rbm’, ‘Rik’, ‘Atp’, ‘Nduf’, ‘Tomm’, ‘Pol’, ‘Anap’, ‘Rna’, ‘Dna’, ‘Gm’, ‘Ddx’, ‘Smim’, ‘Bola’, ‘Timm’ and ‘Micos’) were removed. DESeq2 was used for differential expression (MG excluded for CAM-specific analyses), with PCA and heatmaps on variance-stabilized top variable genes, apeglm-shrunken volcano plots, enrichGO on DEGs (Padj ≤ 0.05) and ggradar plots of selected LPS-responsive genes. In the stroke experiment (Fig. 8), at 24 h post-MCAO, brains from WT or Ccr2CreERT2R26tdT mice were sectioned, choroid plexus removed, and CAMs sorted as Ly6C⁻Ly6G⁻CD11c⁻CD45⁺CD11b⁺CD206⁺ (tdT⁺/tdT⁻ in reporter mice) or MG as CD206⁻ counterparts (cells of two BLZ945 mice were pooled per replicate); whole-tissue RNA was extracted using RNeasy Micro kit with DNase and Bioanalyzer quality control. Lowly detected genes (sum count < sample number/2) were filtered, DESeq2 performed differential expression, PCA, apeglm-based volcano plots and GO analysis on upregulated genes (Padj ≤ 0.05) in ipsilateral hemisphere (CTL or BLZ945); additional visualizations included Venn diagrams of overlapping upregulated genes, bar plots of gene counts with higher stroke-induced expression, box plots of selected immune genes. Volcano plots for Ccr2CreERT2R26tdT data were generated by plotting DEGs detected in repopulated stroke MG versus CTL MG and overlaying DEGs detected in vehicle stroke MG versus CTL MG or by plotting DEGs detected in tdT+ stroke CAMs versus tdT+ CTL CAMs and overlaying DEGs detected in tdT− stroke CAMs versus tdT− CTL CAMs.
scATAC-seq
MG, sdCAMs, dCAMs and Ly6Chi monocytes were isolated from brains or blood of Mrc1CreERT2R26tdT mice 8 weeks after depletion as described under flow cytometry. Then, 3–4 biological replicates were pooled, MG and monocytes from the same condition were pooled. Cells were sorted and processed using the Chromium Single Cell ATAC-seq platform (10x Genomics). Nuclei were isolated following the 10x Genomics protocol (CG000366, Rev A) with minor adaptations. In brief, sorted cells were lysed in diluted lysis buffer, quenched with wash buffer, centrifuged, resuspended and filtered (10-µm strainer). Nuclei integrity was assessed by DAPI staining and counted using Trypan Blue on a Countess automated cell counter. Encapsulation and library preparation were performed using Chromium Next GEM Single Cell ATAC Reagent Kits v.2 (10x Genomics). Library quality was assessed by Qubit and Bioanalyzer. Raw reads were processed using Cell Ranger ATAC (v.2.2.0) with alignment to the mm10 genome and generation of single-cell accessibility matrices. Downstream analysis was performed in R using Signac (v.1.16). Feature-barcode matrices were loaded, and quality control was performed based on transcription start site enrichment and nCount_peaks. Samples were merged based on a common GRanges peak set. Standard Signac workflow (RunTFIDF, FindTopFeatures, RunSVD, RunUMAP, FindNeighbors and FindClusters) was applied. Gene activity scores were calculated. Cell type annotation was transferred from scRNA-seq data (Fig. 2; macrophages and monocytes from CTL and 8w samples) using TransferData and refined using predicted identities and sorting metadata. Peak calling was performed using CallPeaks (MACS2; group.by = cell type, combine.peaks = TRUE), followed by removal of nonstandard chromosomes, quantification (FeatureMatrix) and annotation (RegionStats). A standard Signac workflow and gene activity calculation were repeated on peak assay. The bar graph of differential accessibility includes increased and decreased peaks. Module contents were based on (sc)RNA-seq analysis and FindAllMarkers results. Motif enrichment was performed using JASPAR2020, and transcription factor activity was assessed using chromVAR. Visualizations were generated with SCpubR77, Signac, EnhancedVolcano78 and ggplot2 (ref. 79).
Analysis and experimental information
Analysis, surgeries and outcome assessments were conducted blinded to treatment conditions. Animals were randomly assigned to treatment groups, with a similar number of males and females per group. Sample sizes were not predetermined, but are similar to those reported previously3,12,47.
Histological analysis
All data points for histological analyses in Figs. 1 and 3 and associated Extended Data derive from manual quantification (ImageJ Fiji and Cell Counter plug-in) of ten regions of interest for cerebral cortex, at least six for cerebellum and at least four for olfactory tubercle per biological replicate. In brief, the laminin channel was activated and parenchyma area measurements and leptomeningeal length measurements were performed, the IBA1 channel was used to count the number of MG. Next, the CD206 channel was used to quantify the number of lmMΦ and pvMΦ. Last, the reporter channel was activated and tdT+ cells were quantified. For Fig. 4, images of whole-brain sagittal sections were semi-automatically analyzed using QuPath v.4.4 software (≥1,000 CAMs per biological replicate). For Fig. 5, whole-brain sagittal sections were manually counted using ImageJ Fiji (≥1,000 CAMs per biological replicate). For analysis of CD62P+, CD62E+ or ICAM-1+ vessels, Cell Profiler v.4.2.5 (Crop, Threshold, IdentifyPrimaryObjects, MaskObjects and MeasureImageAreaOccupied) was deployed.
Statistical analysis
Normality and homoscedasticity were generally assumed; equality of variances was assessed for all GraphPad-based analyses. A significance level of 5% was used (P < 0.05). Histological and flow cytometry data were analyzed in GraphPad Prism v.11 using unpaired two-tailed t-tests or one-way ANOVA with Šidák’s or Tukey’s post hoc tests. For Fig. 1f, cell density data were analyzed in R using biological replicate-level counts. Data were converted to long format and Welch’s two-sample t-tests were performed for each day (CTL versus BLZ), followed by Bonferroni correction across six comparisons. A three-parameter logistic growth model was fitted to mean depletion over time using nonlinear least squares:
$$\mathrm{Depletion}( \% )=L/(1+\exp (-k\times (\mathrm{day}-{t}_{0}))),$$
where L is the asymptote, k is the growth rate and t₀ is the inflection point. Convergence failures were handled with tryCatch. Model fit was evaluated (R²) and time to 90% depletion (t₉₀) was derived analytically. Sequencing data were analyzed in R using methods described in the respective RNA-seq sections. Cluster composition in Figs. 2 and 5 was assessed with the propeller workflow (speckle), applying arcsine square-root transformation followed by a t-test (Fig. 5e, two conditions) or ANOVA (Extended Data Fig. 1c; three conditions) with Benjamini–Hochberg FDR correction. Corridor test discrete number statistics were performed with gstat and significance was tested with the Brunner–Munzel test. P-selectin MPIO signal and strength deficit correlation was evaluated using Spearman correlation and linear regression (lawstat). Box plots were analyzed by ANOVA with Tukey’s test. Discrete number graphs were analyzed by chi-squared testing.
Reporting summary
Further information on research design is available in the Nature Portfolio Reporting Summary linked to this article.