
Mice
All preclinical experiments were conducted under ethics protocols approved by the University Committee on Laboratory Animals at Dalhousie University, Halifax, N.S., Canada (project ID: 20-124). Female humanized transgenic mice (HLA-A2.I-HLA-DRI-transgenic (HHD) H-2 class I/II knockout), 6–23 weeks old, were obtained from Charles River Laboratory (France) and bred in-house. All mice were housed in filter-top cages and were provided food and water ad libitum. Mice were randomized into the two groups. Originally we had aimed to use 15 mice per group, but due to issues related to surgery, there were n = 10 recipient mice in the untreated group and 14 mice in the treated group that received DPX-Survivac, anti-PD-1, and low-dose CPA. Upon study completion or upon reaching humane endpoint, mice were anesthetized via inhaled isofluorane (5%) until loss of pedal reflex and terminated via subsequent cervical dislocation.
Cancer cell line and implant
Mouse ovarian surface epithelial (MOSE) cancer cells were provided by Dr. Vanderhyden and were genetically modified in-house via plasmid to express the survivin epitope and confer puromycin resistance. Cells were cryopreserved in Calf Bovine Serum with 10% dimethyl sulfoxide (DMSO), thawed and cultured in DMEM (Dulbecco’s Modification of Eagle’s Medium; Corning, Corning NY) supplemented with 100 U/mL Penicillin, 100 µg/mL streptomycin (Gibco, Burlington, ON), and 10% Calf Bovine Serum (Hyclone) and grown at 37 °C in an atmosphere of 5% CO2. After the first passage, cells were selected for survivin by adding 10 µg/mL of puromycin.
Prior to cell injections, mice were given a subcutaneous injection of 5 mg/kg meloxicam (Boehringer Ingelheim, Burlington, ON, Canada). At the same time, mice were also given 0.5 mL of warmed Lactated Ringer’s solution (Baxter, Mississauga, ON, Canada). Mice were then anesthetized using isofluorane, with depth assessments done regularly using pedal reflex. The interscapular and left flank region were shaved and a slow-release buprenorphine 1 mg/mL (Chiron Pharmacy, Guelph, ON, Canada) was given via subcutaneous injection on the left side. The flank was massaged to minimize potential buprenorphine-induced lesions, and the surgical site was cleaned with a chlorohexidine:alcohol:betadine scrub three times. Small incisions were made in both the skin and peritoneum to enable access to the ovarian fat pad. The ovary was pulled out through the incision and clamped. A Hamilton syringe (Hamilton, Reno, NV, USA) was loaded with 2 µL of 1 × 10⁴ MOSE cells in 1X PBS (Phosphate Buffered Solution; Corning), and using a surgical microscope, cells were injected into the oviductal-bursal junction. Care was taken to avoid leaking through the injection site. The ovary was then pushed back into the abdomen and the peritoneum and skin were sutured, with wound clips used to ensure closure.
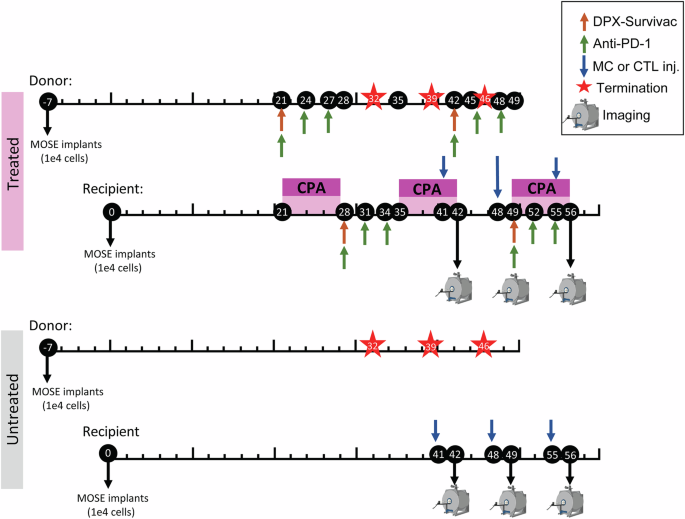
Animals received frequent detailed clinical examinations (DCEs) until the pre-surgery weight was reached. Stitches and wound clips were removed between 5 and 10 days post implant. Once mice regained weight (approximately 3 weeks post-surgery), DCEs were conducted twice/week. Tumors were monitored throughout the study by palpating the abdomen and at certain timepoints via MR imaging (more details below) to obtain precise tumor volumes. Mice were terminated if they lost 15% of their pre-surgery weight, presented severe ascites or ulcerations, or showed signs of pain and lethargy. Implant and treatment timelines can be found in Fig. 1.
DPX-Survivac treatment
DPX-Survivac was prepared at IMV Inc. using their proprietary DPX formulation described elsewhere13. Briefly, DPX-Survivac was formulated by combining the following epitopes: SurA1.T (FTELTLGEF), SurA2.M (LMLGEFLKL), SurA3.K (RISTFKNWPK), SurA24 (STFKNWPFL), and SurB7 (LPPAWQPFL), and the tetanus toxin universal T-helper peptide TT830–843(AQYIKANSKFIGITEL; A16L). DPX-Survivac was resuspended in Montanide ISA 51 VG (SEPPIC, France). Doses of 50 µL were given subcutaneously on the right flank to each mouse on days 28 and 49 post-MOSE implants (Fig. 1). The dosing schedule for all treatments was chosen based on previous work done by Weir et al.21 demonstrating that this dosing combination and schedule worked well in an HPV model.
Cyclophosphamide (CPA; MilliporeSigma, Oakville, ON, Canada) was reconstituted in PBS and delivered to mice in drinking water at 0.133 mg/mL for seven consecutive days, beginning on days 14, 28, and 42 post-MOSE implants (Fig. 1). Mice received 20 mg/kg/day, assuming a 20 g mouse consumes 3 mL water/day.
Anti-PD-1 (clone RPM1-14; BioXCell; West Lebanon, NH, USA) was diluted to 2 mg/mL in 1x PBS. Treated donor mice received six intraperitoneal injections of anti-PD-1 at 200 µg per dose on days 21, 24, 27, 42, 45, and 48 post-MOSE implants. Treated recipient mice received injections on days 28, 31, 34, 49, 52, and 55 post-MOSE implants. (Fig. 1).
CD8+ cytotoxic T lymphocyte (CTL) isolation and labeling
Inguinal, axial, brachial, and mesenteric lymph nodes were collected from disease-matched and treatment-matched donor mice for isolation of CD8+ T cells. This ensured that the cells used for adoptive transfer were exposed to the same cancer and immune environment as recipient mice. CD8+ T cells were isolated from lymph nodes using the EasySep™ Mouse CD8+ T cell Isolation Kit (Stemcell Technologies, Cambridge, MA, United States). Cells were suspended at 5 × 10⁵ cells/mL in complete RPMI (cRPMI) media (RPMI 1640 (Corning), 10% FBS (Hyclone), 1% penicillin/streptomycin (Gibco), and 55 μM β-mercaptoethanol (Gibco)) and incubated in a CD3-coated cell culture plate with human IL-2 (20 U/mL), mouse IL-12 (100 ng/mL), hamster anti-mouse CD28 (1 µg/mL), and Gentamicin (5 µg/mL). Cells were monitored and kept at a density of 0.5–1 × 10⁶ cells/ml. Fresh cRPMI with IL-2 (20 U/mL) was added as required. Four days following CTL isolation, antigen-presenting cells (APC) were isolated from the spleens of disease- and treatment-matched donor mice. Splenocytes were incubated with LPS (10 µg/mL) in media (DMEM + 10% FBS + 55 μM β-mercaptoethanol +1% Penicillin–Streptomycin + 1% L-glutamine) for 48 h. Non-adherent cells were then treated with mitomycin-c (50 µg/mL) for 20 min, washed, and added to the CTL culture at a ratio of 1:6 (APC: CTL) with survivin peptides (10 µg/mL). Following a 48 h incubation with the APCs, a sample of cells was collected to assess cell purity via flow cytometry, and the other cells were used for in vivo studies. Activated CTLs were collected, washed, and incubated with SPIO-Rhodamine B Molday ION (0.075 mg/mL; Biopal Inc., Worchester, MA, USA) and IL-2 (100 U/mL) at 4 × 10⁶ cells/mL in cRPMI for 22–24 h. Cell viability of CTLs post-SPIO labeling was found to be >90%. Previous work35 demonstrated that labeling CTLs using this methodology does not affect the cytotoxicity ability of CTLs. A subset of labeled CTLs was removed for flow cytometry analysis to assess the effects of labeling on functionality.
Bone marrow-derived myeloid cell isolation and labeling
Bone marrow was collected from the femurs and tibias of disease- and treatment-matched donor mice for isolation of bone marrow-derived myeloid cells (described as MCs hereafter). Red blood cells were lysed with 1x RBC lysis buffer (Tonbo Biosciences, San Diego, CA, USA). Three million cells were incubated in Petri dishes with 10 mL of media containing RPMI, 10% FBS, 1% penicillin-streptomycin, 20 mM HEPES (MilliporeSigma), and 20 ng/mL of granulocyte monocyte-colony stimulating factor for 72 h (GM-CSF; Peprotech, Rocky Hill, NJ, USA). After incubation, 10 mL of media with 20 ng/mL of GM-CSF was added to each plate. Following another 72 h, cells were collected, centrifuged, resuspended in fresh media with 20 ng/mL of GM-CSF, and returned to the plates. The next day, cells were stimulated overnight with survivin peptide SurA2.M (20 µg/mL). Forty-eight hours later, cells were collected, resuspended at 4 × 10⁶ cells/mL, and a sample of cells was assessed for cell purity using flow cytometry, with the remaining cells being used for in vivo studies. The purified myeloid cells were incubated with 0.030 mg/mL of SPIO-Rhodamine B Molday ION for 18–20 h. Cell viability of MCs post SPIO labeling was found to be >90%. A subset of labeled MCs was also removed for flow cytometry analysis to assess the effects of labeling on functionality.
Cell injection and preparation
SPIO-labeled cells (CTLs or MCs) were collected, washed twice with 1x PBS, twice with HBSS++ (Hank’s Balanced Salt Solution; Corning), and then resuspended in HBSS++ with 20 mM HEPES at 5 × 10⁶ cells/mL (MCs) and 25 × 106 cells/mL (CTLs). All mice received 200 µL of CTLs or MCs through intravenous tail vein injections. Cells were injected on days 41, 48, and 55 post-implant (24 h before MRI). Iron loading was assessed in the remaining cells using a Prussian blue assay35; cells were lysed overnight in 100 µL of 1 M HCl, and then 100 µL of K4Fe(CN)6 was added to each sample. The absorbance (\(\lambda\) = 620 nm) was recorded on SpectraMax i3 (Molecular Devices, San Jose, CA, USA) and compared to a standardized in vitro calibration curve.
Tumor dissociation for tumor-infiltrating lymphocyte assay
Tumors were removed from mice following their final MRI scans. In Petri dishes, the tumor was chopped into smaller pieces with a scalpel and then incubated in digestion buffer [1 mg/mL collagenase type 1 (Gibco) + 0.1 mg/mL DNase I (MilliporeSigma) + 5% FB Essence in HBSS++] at 37 °C for 30 min. Samples were then filtered through a 70 µm strainer with separation buffer [2% FB essence + 1 mM EDTA in 1x PBS (Gibco)]. Red blood cell (RBC) lysis was performed on the suspension as required. Cells were washed with 1x PBS and used for flow cytometry.
Ascites sample preparation
At the endpoint, mice were euthanized, and ascites fluid was collected using a 25G needle and a 5 mL syringe. Red blood cells were lysed with an equal volume of 1x RBC lysis buffer, and samples were centrifuged to collect cells. These remaining cells were washed thoroughly with 1x PBS and used for flow cytometry.
Flow cytometry
Cell samples were blocked in 5% normal rat serum (NRS) for 10 min and then incubated with antibody cocktails at 4 °C for 20 min (Supplementary Tables 1). The same staining procedure was followed as in ref. 35. After staining, samples were fixed with 4% paraformaldehyde (PFA). OneComp eBeads (eBioscience) were used for controls. Data were acquired with a FACS Celesta or FACS Canto II equipped with FACSDiva software (BD Biosciences, Franklin Lakes, NJ, USA) at the Dalhousie University Flow Cytometry Core Facility. Samples were analyzed using FlowJo v10.6.2 (Vicro, Torrance, CA).
Immunohistochemistry
Samples (spleen, tumor, and lymph nodes) were frozen immediately after termination in an Optical cutting temperature (OCT; Fisher)/Sucrose (1:1) solution and stored in a −80 °C freezer until sectioning. Samples were taken to the Dalhousie immunohistochemistry core for processing; tissues were sectioned on the cryostat and placed on slides. Slides were then fixed in −20 °C cold acetone for 2 min, dried, and stored in a −20 °C freezer until staining. For IHC staining, slides were brought to RT, dried, and fixed in cold acetone for 10 min and air-dried again for 30 min. They were then washed in a Tris-buffered saline (TBS)/Bovine serum albumin (BSA) wash and blocked with 20% horse serum for 1 h. They were rinsed again in the TBS/BSA before staining with the Avidin-Biotin Vector kit for 15 min. The samples were stained with the biotinylated primary antibodies overnight (CD8-biotin for the CD8 T cells and CD11-biotin for the MCs, 1:50 dilution). Samples were washed with the TBS/BSA and stained with the Avidin-Alexa Fluor 633 fluorophore (1:200) for 1 h, washed with TBS/BSA and TBS alone. Slides were mounted with antifade mounting media with 4’,6-diamidino-2-phenylindole (DAPI) and visualized on the Zeiss LSM 710 (upright) laser-scanning confocal microscope at the Dalhousie microscopy core facility.
MRI acquisition
Mice were imaged with MRI using a 3T preclinical Agilent MRI (Varian Inc., Santa Clara, CA, USA). The MRI contained a 21-cm inner-diameter gradient coil (200 mT/m; Magnex Scientific, Oxford, UK) and was interfaced with a Varian DD Console (Varian Inc.). Mice were anesthetized with 2–3% isofluorane and secured in an animal holder immediately before imaging. Temperature and respiration rates were monitored throughout imaging using a rectal probe and breathing monitor.
Anatomical images were acquired using a balanced steady-state free precession (bSSFP) pulse sequence. The bSSFP parameters were set at a repetition time of 8 ms, echo time of 4 ms, and a flip angle of 30°. The field of view (FOV), 256 × 170 × 170 matrix, was set at an isotropic resolution of 200 μm and was centered over the torso. The TurboSPI parameters were set with a FOV of 32 × 32 × 32 mm and a slab size of 30 mm15,29. The repetition time (TR) was 250 ms, the echo train length was 8, and the echo spacing (ESP) was 10 ms. Mice were scanned on days 42, 49, and 56 post-implant, approximately 24 h after SPIO-labeled cell injections.
Imaging analysis
MRI Images were loaded in VivoQuant (InVicro, Ma, US), and regions of interest (ROI) were drawn on the tumor and lymph nodes using the bSSFP image for each imaging time point as in15. Cell density in tumors and lymph nodes was obtained by extracting frequency histograms of the R2* signal from the ROIs, and converted from R2* values per voxel to cell density per mm3 using the calibration curve for either CTLs or MCs. Each voxel was then summed over the ROI, resulting in total cell density for each tumor and lymph node ROI (same methods as refs. 15,26). Data were then imported into GraphPad Prism 8 (San Diego, CA, USA) for statistical analysis.
R2* calibration
The same CTL and MC isolation procedures and SPIO labeling were done to isolate sufficient numbers of cells to prepare calibration samples. Six samples for each cell type were prepared by suspending 0, 1 million, 2 million, 3 million, 4 million or 5 million cells in 1.5 mL of a 4% gelatin/PBS mixture in 5 mm NMR tubes. These tubes were then scanned using the same MRI procedures described previously in the methods to obtain R2* values for each tube. A calibration curve was then plotted in Prism and the slope was used to convert relaxation rate (s−1) to cellular density (cells/mL) for the in vivo data.
Statistical analysis
To compare the results between the two treatment groups, we used a Student’s t test with Bonferroni correction for multiple comparisons, and to evaluate group-level results across both time and treatment groups, we used a two-way ANOVA. Significance is designated as *p \(\le\) 0.05, **p \(\le\) 0.01, ***p \(\le\) 0.001.