
Reagents
Chemical reagents were purchased as follows: sodium arsenite (Sigma-Aldrich, USA); thapsigargin (Sigma-Aldrich, USA); diABZI (Selleckchem, USA); SN-011 (MedchemExpress, USA); H-151 (MedchemExpress, USA); MG132 (Sigma-Aldrich, USA); Polybrene (Sigma-Aldrich, USA); Biotin (Sigma-Aldrich, USA); puromycin (Sigma-Aldrich, USA); G418 (LPS solution, South korea); lipofectamine 3000 (Invitrogen, USA); lipofectamine CRISPRMAX reagents (Invitrogen, USA); RNAiMAX (Invitrogen, USA); digitonin (Wako chemicals, USA); MitoSOX™ mitochondrial superoxide indicators (Invitrogen, USA).
Antibodies
Rabbit anti-STING (Cat# 13647), rabbit anti-p-STING (Cat# 19781), rabbit anti-TBK1 (Cat# 3504), rabbit anti-p-TBK1 (Cat # 5483), rabbit anti-IRF3 (Cat #4302), rabbit anti-p-IRF3 (Cat #4947), rabbit anti β-ACTIN (Cat# 4970), rabbit anti-eIF4G (Cat# 2498), rabbit anti-caspase-3 (Cat# 9662), rabbit anti-Flag (Cat# 14793), rabbit anti-HA (Cat# 3724), rabbit anti-Myc tag (Cat# 2278), rabbit anti-eIF2α (Cat# 5324), rabbit anti-p-eIF2α (Cat# 3398), rabbit anti-histone H3 (Cat# 9715) and rabbit anti-UBAP2L (Cat# 40199) were purchased from Cell Signaling Technology (USA). Rabbit anti-G3BP1 (Cat# PA5-29455) and goat anti-calnexin (Cat# PA5-19169) were purchased from Invitrogen (USA). Mouse anti-Flag (Cat# F1804) was purchased from Sigma-Aldrich (USA). Rabbit anti-GM130 (Cat# ab52649) and rabbit anti-GST (Cat# ab19256) were purchased from Abcam (UK). Mouse anti-GAPDH (Cat# sc-32233) was purchased from Santa Cruz Biotechnology (USA).
Cell lines
HeLa cells, mouse embryonic fibroblast (MEF) cells, and HEK293T cells were cultured in Dulbecco’s modified Eagle’s medium (DMEM) (Welgene, Korea) supplemented with 10% heat-inactivated fetal bovine serum (Gibco, USA), 2 mM L-glutamine (Gibco, USA), 10 mM HEPES (Hyclone, USA), and 100 units/ml penicillin/streptomycin (Gibco, USA) in a 5% CO2 incubator at 37 °C. To generate knockout cells, a single guide RNA was delivered with Cas9 nuclease (Enzynomics, Korea) to cells via lipofectamine CRISPRMAX reagents (Invitrogen, USA) according to the manufacturer’s protocol. The sequence of the sgRNAs were as follows: sgSTING, 5’-AAUAUGACCAUGCCAGCCCA-3’; sgUBAP2L, 5’-GCUAUCAAUGUUCUUCUGGA-3’. The loss of STING and UBAP2L expression was verified by immunoblotting.
Mice
10–12 weeks female mice were used for experiment. C57BL/6J-Sting1gt/J mice (Stinggt/gt) were purchased from Jackson Laboratory (Bar Harbor, Me). All procedures were approved by the Institutional Animal Care and Use Committee (IACUC) of KAIST and conform to the relevant regulatory standards (KA2024-155-v2).
Expression constructs and transfection
For transient expression in HEK293T cells, DNA sequences encoding Flag-tagged WT, NTD, CTD, and ΔCTT STING were cloned into a pcDNA3.1(+) plasmid. HA-G3BP1, Myc-G3BP1, and UBAP2L-HA were cloned into a pLPCX retroviral plasmid. Plasmids were transfected using polyethylenimine (PEI).
Generation of stable cell lines
For stable expression in HeLa cells, DNA sequences encoding Myc-tagged WT STING was cloned into pLNCX2 retroviral vectors. TurboID-G3BP1, Myc-tagged WT, ΔNTF2L, ΔIDR1-2, ΔRRM, ΔIDR3, ΔRBD G3BP1, HA-tagged WT, ΔUBA, ΔRGG, Δ239-290, ΔDUF UBAP2L, Flag-tagged WT NTD, CTD, ΔCTT, and CTD-Cyb5 STING were cloned into pLPCX retroviral vectors. TDP-43 A315T (Cat #133755), FUS R521C (Cat #175067), SOD1 G93A (Cat #26401) constructs were purchased from Addgene (USA) and cloned with Flag tags into pLPCX retroviral vectors. The Myc-tagged inactive STING mutants and TDP-43 WT-Flag constructs were generated with the Phusion Site-Directed Mutagenesis Kit (Thermo Fisher Scientific, USA). Retroviruses were packaged in HEK293T cells and transduced into target cells with 10 μg/ml polybrene (Sigma-Aldrich, USA). Cells were selected with 1 μg/ml puromycin (Sigma-Aldrich, USA) or 2 mg/ml G418 (LPS solution, Korea).
Stress conditions
To induce ROS or ER stress, cells were treated with 250 μM of sodium arsenite for the indicated times or 50 μM of thapsigargin for 15 or 30 min in a 5% CO2 incubator at 37 °C. To induce heat shock stress, cells were incubated in a 5% CO2 incubator at 43 °C for 1 h.
Knockdown by siRNA
Cells were reverse transfected with siRNAs (50 nM) for 48 h using RNAiMAX (Invitrogen, USA) according to the manufacturer’s instructions. The sequences of the siRNAs were as follows: siCtrl, 5′-CCUACGCCACCAAUUUCGU-3′; siSTING, 5’-GCAUCAAGGAUCGGGUUU-3’; siSting, 5’-CCAACAGCGUCUACGAGA-3’.
RT-qPCR
Total RNA was isolated from cells using the TRI reagent (Thermo Fisher Scientific, USA) according to the manufacturer’s instructions. RNA concentrations were quantified with a NanoDrop (Thermo Fisher Scientific, USA), and equal amounts were used for each sample. cDNAs were synthesized using SuperScript IV VILO Master Mix (Invitrogen, USA) according to the manufacturer’s instructions. Real-time quantitative PCR (RT-qPCR) was performed with target gene primer sets and qPCR 2× PreMIX (SYBR Green with low ROX) (Enzynomics, South Korea) in a CFX Duet Real-Time PCR System (Bio-Rad, USA). The primer sequences were as follows: ISG56 F, 5′-CGGGGTACCCAACCATGAGTACAAATG-3′; ISG56 R, 5′-CGCGGATCCAGGACCTTGTCTCACAGA-3′; IFNβ F, 5’-GGAGGACGCCGCATTGAC-3’; IFNβ R, 5’-CAATAGTCTCATTCCAGCCATGTC-3’; GAPDH F, 5′- GAGCTGAACGGGAAGCTC-3′; and GAPDH R, 5′-CCAGGAAATGAGCTTGAC-3′. Transcript amounts were measured as cycle threshold (CT) values, and the data were analyzed via the ΔΔCT method. Target gene mRNA expression was normalized to GAPDH expression.
Quantification of cytosolic mtDNA release
Cells were resuspended in 150 μl of digitonin buffer (150 mM NaCl, 50 mM HEPES pH 7.4, and 25 µg/ml digitonin (Wako chemicals, USA). Samples were incubated for 10 min at room temperature (RT), and then centrifuged at 16,100 × g for 25 min at 4 °C. Supernatants were diluted with distilled water (DW) (1:20) and used for RT-qPCR. Pellets were resuspended in 300 μl of digitonin buffer supplemented with 5 mM EDTA and proteinase K (Enzynomics, South Korea) and incubated at 55 °C overnight. Digested pellets were diluted with DW (1:20) and heated to 95 °C for 20 min to inactivate proteinase K. The samples were then used for RT-qPCR with the following mtDNA-specific primers (MT-ND2): MT-ND2 F, 5′-GTAGACAGTCCCACCCTCAC-3′; MT-ND2 R, 5′- TTGATCCCGTTTCGTGCAAG-3′. Transcript amounts were measured as cycle threshold (CT) values, and the data were analyzed via the ΔΔCT method. Cytosolic MT-ND2 levels were normalized to the total MT-ND2 level.
Mitochondrial membrane potential (ΔΨm) measurements
Cells were washed once with Dulbecco’s PBS (DPBS) (Welgene, Korea) and then incubated with Tetramethylrhodamine methyl ester (TMRM) (Invitrogen, USA) (20 nM) in Opti-MEM (Gibco, USA) for 30 min in a 5% CO2 incubator at 37 °C. Cells were washed with DPBS detected by flow cytometry (LSRFortessa) (BD Biosciences, USA), and the resulting data were analyzed with the FlowJo software package (BD Biosciences, USA).
Immunofluorescence
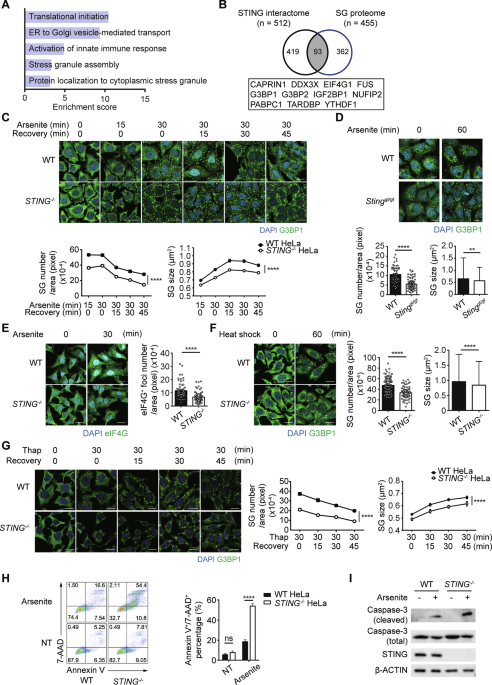
Cells were seeded on coverslips in 24-well plates, fixed in 3.7% formaldehyde in PBS, and then permeabilized in permeabilization solution (0.1% saponin (Sigma-Aldrich, USA), 5% bovine calf serum (BCS), 10 mM glycine, and 10 mM HEPES (pH 7.4) in PBS). The cells were incubated with primary antibodies diluted in permeabilization solution. Alexa Fluor™ 488- or Alexa Fluor™ 594-conjugated goat anti-mouse or anti-rabbit IgGs (Thermo Fisher Scientific, USA) were used as secondary antibodies. Micrographs were captured with a Zeiss LSM880 or LSM980 confocal microscope and analyzed with the ZEN software package (Carl Zeiss, Germany). Stress granule number, size and cell area were quantified with ImageJ (National Institutes of Health, USA). Manders coefficients for STING and Calnexin co-localization were quantified with ImageJ Coloc 2 plugin (National Institutes of Health, USA). For stress granule analysis, all stress granules with an area of 0.1–4 μm2 detected in more than fifty cells per condition were quantified. Stress granule number was normalized to cell area, and stress granule size represents measurements of individual granules within this area range pooled from the analyzed cells, as indicated in the graphs.
Immunohistochemistry
For imaging stress granules in vivo, the mice were given intraperitoneal injection of PBS or sodium arsenite (10 mg/kg) for 1 h. Mice were perfused by transcardial perfusion and the liver tissues were harvested. Liver tissues were fixed in 4% formaldehyde in PBS at 4 °C overnight and then transferred to 30% sucrose at 4 °C overnight. Liver tissues were embedded and frozen in OCT medium (Sakura Finetek). Frozen liver tissues were cut into 8-μm sections with a CM1850 cryostat (Leica). Sections were subjected to antigen retrieval by heating in 10 mM sodium citrate buffer (pH 6.0) containing 0.05% Tween-20 at 95 °C for 20 min, followed by cooling in water at room temperature for 10 min. Sections were then permeabilized with 0.25% Triton X-100 in PBS for 1 h at room temperature. After blocking with blocking buffer (5% goat serum, 3% BSA, 0.01% Triton X-100 in PBS) for 1 h, sections were incubated with anti-UBAP2L antibodies at 4 °C overnight. Alexa Fluor™ 488-conjugated goat anti-rabbit IgG (Thermo Fisher Scientific, USA) was used as secondary antibody. Micrographs were captured with a Zeiss LSM980 confocal microscope and analyzed with the ZEN software package (Carl Zeiss, Germany). Stress granule numbers and sizes were quantified with ImageJ (National Institutes of Health, USA).
Proximity ligation assay (PLA)
Cells were seeded on coverslips in 24-well plates, fixed in 3.7% formaldehyde in PBS, and then permeabilized with permeabilization solution. Proximity ligation assays were performed using the Duolink® In Situ Red Starter kit (Sigma-Aldrich, USA) according to the manufacturer’s instructions with the primary antibodies indicated in the figure legends. Counterstaining was performed by incubating the cells with Alexa Fluor™ 488-conjugated goat anti-mouse or anti-rabbit IgG (Thermo Fisher Scientific, USA). Micrographs were captured with a Zeiss LSM880 or LSM980 confocal microscope and analyzed with the ZEN software package (Carl Zeiss, Germany). PLA dots and cell area were quantified with ImageJ (National Institutes of Health, USA). More than fifty cells were quantified. The PLA quantifications normalized to cell area are indicated in the graphs.
Immunoblotting and co-IP
Cells were lysed in lysis buffer containing 1% Triton X-100, 5 mM iodoacetamide (IAA), 0.5 mM phenylmethylsulfonyl fluoride (PMSF), 1 mM sodium orthovanadate (Na3VO4), and 1 mM sodium fluoride (NaF) in 1X TBS (24.7 mM Tris-HCl, 137 mM NaCl, and 2.7 mM KCl, pH 7.3) on ice for 15 min. Cells were centrifuged at 16,100 × g for 10 min at 4 °C. The protein concentrations of the supernatants were measured with the Pierce™ BCA Protein Assay Kit (Thermo Fisher Scientific, USA). For cell fractionation experiments, a cell fractionation kit (Cat #9038) (Cell Signaling Technology, USA) was used according to the manufacturer’s instructions. Briefly, cells were resuspended in cytoplasmic isolation buffer (CIB) and incubated on ice for 5 min. Samples were centrifuged at 500 × g for 5 min, and the supernatants were used as cytoplasmic fractions. The pellets were resuspended in cytoskeletal/nuclear isolation buffer (CyNIB) and sonicated three times for 5 sec each at 20% power to produce the soluble nuclear fraction. Cell lysates were subjected to denaturation by boiling at 95 °C for 10 min in sample buffer containing 1% SDS, 10% glycerol, 5% β-mercaptoethanol, and 0.05% bromophenol blue in 6.25 mM Tris buffer (pH 6.8). For co-immunoprecipitation, the cell lysates were incubated with primary antibodies and protein G Sepharose® beads (GE Healthcare, USA) at 4 °C overnight. The samples were washed five times with ice-cold wash buffer containing 0.1% Triton X-100 in 1X TBS and then denatured by boiling in sample buffer at 95 °C for 10 min. The proteins were resolved via 10–12% SDS-PAGE, transferred to a polyvinylidene difluoride (PVDF) membrane (Merck Millipore, USA), incubated with primary antibodies and horseradish peroxidase (HRP)-conjugated secondary antibodies (Jackson Laboratory, USA), and then developed with the Luminata Crescendo Western HRP substrate (Merck Millipore, USA).
Protein purification
DNA sequences encoding GST, GST-tagged G3BP1, and GST-tagged CTD STING were cloned into the pGEX-4T-1 vector. Constructs for G3BP1 and CTD STING contained a TEV protease cleavage site between the N-terminal GST tag and the protein. Recombinant proteins were expressed in E. coli BL21(DE3) cells. Cultures were grown at 37 °C to OD600 ≈ 0.6, and expression was induced with 0.5 mM IPTG for 4 h at 30 °C. Cells were harvested and resuspended in lysis buffer (20 mM Tris-HCl pH 7.9, 1 M KCl, 0.2 mM EDTA, 20% glycerol, 0.1% NP-40, 0.2 mM PMSF) and disrupted by sonication. Lysates were clarified by centrifugation, and the supernatants were incubated with Glutathione Sepharose™ 4B resin (Cytiva, USA) for 3 h at 4 °C. The resin was washed five times with lysis buffer, and bound proteins were eluted with lysis buffer containing 10 mM glutathione (Sigma-Aldrich, USA). GST-tagged CTD STING was further incubated with TEV protease (enzyme:substrate ratio 1:20, w/w) at 4 °C overnight in cleavage buffer (50 mM Tris-HCl pH 8.0, 100 mM NaCl, 8% glycerol, 1 mM β-mercaptoethanol) to remove the GST tag. Proteins were subsequently dialyzed at 4 °C overnight against dialysis buffer (20 mM Tris-HCl pH 7.9, 150 mM NaCl, 0.2 mM EDTA, 20% glycerol, 0.01% NP-40, 0.1 mM PMSF, 1 mM β-mercaptoethanol). Purified proteins were aliquoted, flash-frozen in liquid nitrogen, and stored at −80 °C.
GST pull-down assay
3 μg of GST or GST-G3BP1 was immobilized on Glutathione Sepharose™ 4B resin (Cytiva, USA) at 4 °C for 1 h in binding buffer (20 mM Tris-HCl pH 7.9, 150 mM NaCl, 0.2 mM EDTA, 20% glycerol, 0.1% NP-40, 0.2 mg/ml BSA, 0.5 mM PMSF). After incubation, the resin was washed with binding buffer to remove unbound proteins. Subsequently, 600 ng of tagless CTD STING was added and incubated for 3 h at 4 °C. The resin was washed five times with binding buffer without BSA, and bound proteins were eluted by boiling in sample buffer and analyzed by immunoblotting.
Annexin V/7-AAD staining
After treatment, cells were harvested and resuspended to Annexin V binding buffer (Biolegend, USA). APC-conjugated Annexin V (1:20) (Biolegend, USA) and 7-AAD (1:20) (BD Biosciences, USA) were added and incubated for 30 min in RT. Annexin V+/7-AAD+ cells were detected by flow cytometry (LSRFortessa) (BD Biosciences, USA), and the resulting data were analyzed with the FlowJo software package (BD Biosciences, USA).
Mitochondrial ROS measurements
Cells were washed once with Dulbecco’s PBS (DPBS) (Welgene, Korea) and then incubated with MitoSOX™ Mitochondrial Superoxide Indicators (Invitrogen, USA) (5 μM) in Opti-MEM (Gibco, USA) for 30 min in a 5% CO2 incubator at 37 °C. Cells were washed with DPBS and then treated with sodium arsenite (250 μM) for 30 min. MitoSOX-positive cells were detected by flow cytometry (LSRFortessa) (BD Biosciences, USA), and the resulting data were analyzed with the FlowJo software package (BD Biosciences, USA).
TurboID proximity labeling and NeutrAvidin pull-down
TurboID-G3BP1 expressing WT and STING-/- HeLa cells were treated with 50 μM of biotin (Sigma-Aldrich, USA) simultaneously with or without 250 μM of sodium arsenite for 15 or 30 min to perform biotinylation. Cells were lysed in lysis buffer on ice for 15 min and centrifuged at 13,200 × g for 10 min at 4 °C. Cell lysates were incubated with Pierce™ NeutrAvidin™ agarose beads (Thermo Fisher Scientific, USA) at 4 °C for 2 h to pull-down biotinylated proteins. Samples were washed five times with ice-cold wash buffer and then denatured by boiling at 95 °C for 10 min in sample buffer.
Mass spectrometry
TurboID-biotinylated protein pulldowns were resolved on a 10% SDS-PAGE gel. To minimize diffusion and optimize visualization for downstream mass spectrometry, electrophoresis was performed only until the protein bands migrated approximately 1.5 cm from the well. The gel was subsequently stained with Coomassie Blue R-250 staining solution (Enzynomics, Korea) for 1 h in RT with gentle agitation. The gel was destained with Coomassie Blue R-250 destaining solution (Enzynomics, Korea) until the protein bands were easily distinguishable. The region of the gel containing the resolved protein bands was carefully excised to approximately 1.5 cm in length. The samples were analyzed by the Taplin Biological Mass Spectrometry Core Facility at Harvard Medical School for protein identification.
Statistical analysis
All statistical analyses were performed using Graphpad Prism (GraphPad). Unpaired two-tailed Student’s t-tests were used for comparing two datasets. One-way or two-way analysis of variance (ANOVA) was used with Tukey’s post-hoc tests for comparing more than two datasets. Significance was indicated with P-values: *,< 0.05; **, < 0.01; ***, < 0.001; ****, < 0.0001. P > 0.05 was considered non-significant (ns).
Use of generative AI tools
We used ChatGPT (OpenAI) for grammar correction and editing. We subsequently reviewed and edited all the content.