
Materials
Fumaryl chloride, cholesterol, 1,2-distearoyl-sn-glycero-3-phosphoethanolamine (DOPE) and 1,2-dimyristoyl-rac-glycero-3-methoxypolyethyleneglycol-2000 (DMG-PEG) were bought from Shanghai Macklin Biochemical Co., Ltd. 2,4,6-triisopropylbenzenesulfonyl chloride (TPSCL), 2H-3,4-dihydropyran, tert-butyldimethylsilyl chloride, Glyoxaline, 4-Methyl-1-piperazineacetic acid, 4-Methyl-1-piperazinepropanoic acid, 4-Methyl-1-piperazinebutanoic acid, Pyridin-1-ium 4-methylbenzenesulfonate (PPTS), tetradecanoic acid, N-Boc L-Ser, thiazolidine-2-one, 2-(2-Iminoimidazolidin-1-yl) acetic acid, (4-methylpiperazin-1-yl) acetic acid, 4-methyl-1-piperazinebutanoic acid, olive oil and carbon tetrachloride were purchased from Meryer, Bidepharm Co., Ltd and Mreda Technology Inc. Sodium (R)-2,3-bis(stearoyloxy) propyl hydrogenphosphate (DSPA) were purchased from AVT (Shanghai) Pharmaceutical Tech Co., Ltd. Recombinant murine granulocyte-macrophage colony-stimulating factor (GM-CSF) and TGF-β was purchased from PeproTech Inc and Solarbio. Cell Counting Kit-8 (CCK8), bicinchoninic acid (BCA) assay kit, and cell plasma membrane staining kit with DiD were provided by Beyotime. LysoTracker Red was provided by Dalian Meilun Biotech Co., Ltd. EGFP plasmids, anti-FAP CAR plasmids, TRIM13 plasmids were purchased from Shanghai GeneBiogist Co., Ltd. The Quant-iT RiboGreen RNA Assay Kit was purchased from Thermo Fisher Scientific. The Hydroxyproline (HYP) content assay kit and Red Blood Cell Lysis Buffer were provided by Solarbio.
The antibodies used in this study were listed in Supplementary Table S4. Cell culture media and consumables were procured from Gibco BRL and CORNING. Cell-Tracker Red CMTPX and Cell-Tracker Green CMFPA were provided by Shanghai Maokangbio. The pHrodoTM Red was purchased from Thermo Fisher Scientific. Plasmid DNA was prepared using Plasmid Mini Kit Plus (Tsingke). In vitro transcription was performed with a T7 High Yield RNA Transcription Kit, and the resulting transcripts were capped using a Cap 1 Capping System (both from Novoprotein). The ELISA kits were purchased from Wuhan Servicebio Technology Co., Ltd.
Cells
The RAW 264.7 cells were purchased from the National Collection of Authenticated Cell Cultures, Chinese Academy of Science (SCSP-5036). RAW 264.7 cells were cultured in DMEM (Gibco) containing 10% fetal bovine serum (HyClone), 1% penicillin/streptomycin (Gibco) and a 5% CO2 atmosphere at 37 °C. Bone marrow-derived macrophages (BMDMs) were isolated from mice femurs and cultured in DMEM (Gibco) containing 10% fetal bovine serum (HyClone), 1% penicillin/streptomycin (Gibco) and 10 ng/ml GM-CSF (PeproTech) in a 5% CO2 atmosphere at 37 °C. AML12 cells were purchased from National Collection of Authenticated Cell Cultures, Chinese Academy of Science (SCSP-550). AML12 cells were cultured in DMEM-F12 containing 10% fetal bovine serum, 0.5% ITS-G (100×), 40 ng/mL Dexamethasone, and 1% Penicillin/Streptomycin. Primary HSCs were isolated by differential centrifugation. Briefly, the mouse was sterilized and the liver was exposed, then perfused via the portal vein with 30 mL of calcium- and magnesium-free Hank’s solution followed by 1 mg/mL type IV collagenase (3 mL/min). The liver was excised, minced, and digested in a 37 °C oscillating water bath for 30 min. The cell suspension was filtered through a 100-μm nylon mesh, washed, and centrifuged twice. HSCs were isolated by continuous 60% Percoll density gradient centrifugation (4 °C, 800 × g, 20 min). HSCs were cultured in DMEM-F12 (Gibco) containing 10% fetal bovine serum (HyClone) and 1% penicillin/streptomycin (Gibco) in a 5% CO2 atmosphere at 37 °C46.
Animals
Male C57BL/6 J mice (6–8 weeks) were obtained from an accredited vendor (Ji’nan Pengyue Laboratory Animal Breeding Co., Ltd.). All animal procedures were reviewed and approved by the Institutional Laboratory Animal Ethical and Welfare Committee (Cheeloo College of Medicine, Shandong University) and conducted in accordance with institutional guidelines. For the CCl4-induced liver fibrosis model, mice were treated with intraperitoneal injection of a CCl4/olive oil (1/4, v/v) mixture at a dose of 2 μL/g twice a week for 6 weeks, with treatment commencing after the first 4 weeks of CCl4 administration. Male C57BL/6J mice (6–8 weeks) were fed a HFMCD diet (A06071301B, Research Diets) to establish the HFMCD model, while control mice received a normal diet (D11112201, Research Diets) under identical housing conditions. After model establishment, treatment was administered following the same protocol as used in the original CCl4-induced fibrosis model. Therapeutic outcomes were evaluated by histological analysis of liver sections and quantification of HYP content.
Synthesis and characterization of PnT14 and PST
For the synthesis of PnT14, P1T14 serves as an illustrative example
To a mixture of tert-butyldimethylsilyl chloride (44.6 mmol), imidazole (92.9 mmol), and TRIS (12.4 mmol), 5 mL of anhydrous N, N-dimethylformamide was added, and the reaction proceeded at room temperature for 12 h. The reaction mixture was then diluted with water and extracted with dichloromethane (CH2Cl2). The organic phase was separated, dried over anhydrous sodium sulfate (Na₂SO₄), and concentrated under reduced pressure. The resulting crude product was purified by silica gel column chromatography (ether/ethyl acetate), yielding the TRIS-TBS (94.21% yield).
For the synthesis of P1TBS, a mixture of 4-methyl-1-piperazineacetic acid (6.32 mmol) and dichloromethane (10 mL) was treated dropwise with 7.200 mL of triethylamine under stirring in an ice bath for 10 min. Subsequently, 1-ethyl-(3-dimethylaminopropyl) carbodiimide hydrochloride (9.39 mmol) and 1-hydroxybenzotriazole (9.32 mmol) were added, and the reaction was carried out for 30 min. The TRIS-TBS (6.47 mmol) was dissolved in dichloromethane and added dropwise to the reaction mixture, which was then stirred for 24 h. The organic phase was diluted with saturated sodium bicarbonate (NaHCO3) and extracted with CH2Cl2. After drying with anhydrous Na2SO4, the solvent was removed under reduced pressure. The yellow oil was purified by silica gel column chromatography (dichloromethane/methanol), yielding the P1TBS (74.11% yield).
To a solution of 2.73 mmol of TBAF·3H2O dissolved in tetrahydrofuran (THF), the solution was added dropwise to a mixture of P1TBS (0.828 mmol) and 10 mL of THF under an ice bath. The reaction proceeded for 3 h and then removed the solvent under reduced pressure to obtain a light yellow oil. 9.39 mmol of 1-ethyl-(3-dimethylaminopropyl) carbodiimide hydrochloride, 9.32 mmol of 1-hydroxybenzotriazole, and 3 mmol of tetradecanoic acid were added to this system, and the reaction was carried out for 24 h. The organic phase was diluted with saturated NaHCO3 and extracted with CH2Cl2. After drying with anhydrous Na2SO4, the solvent was removed under reduced pressure, and the product was purified by silica gel column chromatography (dichloromethane/methanol), yielding a yellow oily material P1T14 (24.22% yield).
For the synthesis of PST
N-Boc L-Ser (146 mmol), PPTS (146 mmol), and 2H-3,4-dihydropyran (146 mmol) were dissolved in 100 ml of CH2Cl2 and reacted at room temperature for 24 h. The mixture was removed under reduced pressure, and the residue was dissolved in ethyl acetate and washed with water. The organic phase was subsequently dried over anhydrous Na2SO4 and concentrated under reduced pressure. The crude product was purified by silica gel column chromatography, yielding THP-Boc-Ser as a white solid in 31.42% yield.
TEA (1.110 mL) was added dropwise to THP-Boc-Ser (1.73 mmol) dissolved in CH2Cl2 at 0 °C, followed by the addition of 1-ethyl-(3-dimethylaminopropyl) carbodiimide hydrochloride (2.07 mmol), 1-hydroxybenzotriazole (2.07 mmol), and thiazolidine-2-one (1.73 mmol). The reaction was carried out for 24 h. The organic phase was diluted with saturated NaHCO3 and extracted with CH2Cl2. After drying with anhydrous Na2SO4, the solvent was removed under reduced pressure. The crude product was purified by silica gel column chromatography, yielding THP-Boc-Ser-T as a white solid in 40.58% yield.
THP-Boc-Ser-T (0.6 mmol) and PPTS (0.6 mmol) were dissolved in anhydrous ethanol and stirred at 55 °C for 12 h. After evaporation under reduced pressure, the reaction mixture was diluted with saturated NaHCO3 and extracted with CH2Cl2. The organic phase was dried with anhydrous Na2SO4 and concentrated under reduced pressure, yielding Boc-Ser-T 92.15%.
DSPA-Na (0.131 mmol) and TPSCL (0.394 mmol) were placed in a dry vessel, and Boc-Ser-T (0.262 mmol) dissolved in 5 mL of anhydrous pyridine was added under N2 protection. The reaction proceeded overnight at 40 °C. The solvent was removed under reduced pressure, and the residue was dissolved in CH2Cl2. The crude product was purified by silica gel column chromatography, yielding Boc-PST as a white solid in 35.88% yield.
Boc-PST (0.47 mmol) was dissolved in CH2Cl2, and 1 mL of trifluoroacetic acid was added dropwise to the system in an ice bath. The reaction was carried out for 2 h, and subsequently concentrated under reduced pressure. The residue was diluted with saturated NaHCO3 and extracted with CH2Cl2, the organic phase was dried over anhydrous Na2SO4 and concentrated to obtain a white solid product PST with a yield of 96.16%.
¹H and ¹³C NMR spectra for PnT14 and PST were acquired in CDCl₃ using Bruker DRX-400 (¹H) and Bruker AV-600 (¹³C) instruments.
mRNA construction
Anti-FAP CAR plasmids were linearized with Mlu I, purified, and used as templates for T7-driven in vitro transcription. The resulting RNA was subsequently Cap-1 capped and purified, and transcript integrity was assessed by agarose gel electrophoresis. TRIM13 mRNA was prepared identically to FAP-specific CAR mRNA.
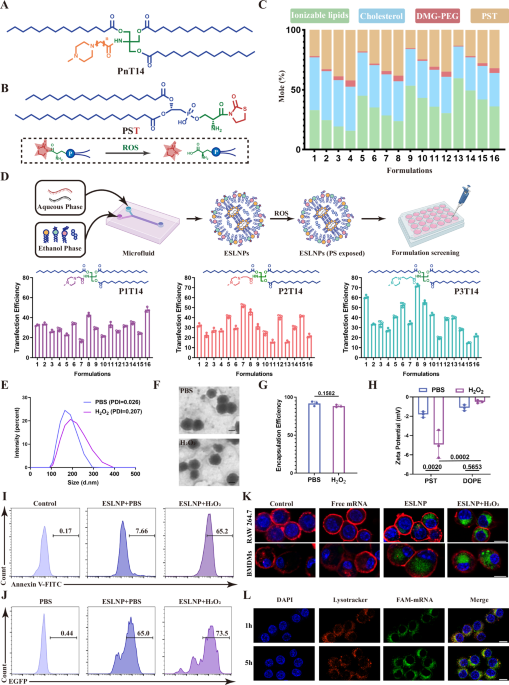
Formulation, optimization and characterization of ESLNPs
LNPs containing EGFP mRNA were prepared based on different formulations shown in Supplementary Table S1 via a microfluidic device. RAW 264.7 cells were seeded in 48-well plates (1 × 10⁵ cells/ well) and cultured for 12 h, followed by incubation with LNPs for 16 h (300 ng mRNA/well). Flow cytometry (Gallios, Beckman, USA) was used to evaluate transfection efficiency. The formulations with the highest transfection efficiency were used for subsequent experiments. The ionizable lipid P3T14, PST, cholesterol, and DMG-PEG were dissolved in ethanol at a molar ratio of 25:30:30:1.5 and the mRNA was diluted in a citrate disodium hydrogen phosphate buffer (pH = 4). The LNPs were assembled by swiftly combining the ethanol phase and aqueous phase with a microfluidic device. Subsequently, it was dialyzed in a DEPC-PBS solution (MWCO 100 kDa) for 30 min to eliminate ethanol and free mRNA.
For the encapsulation efficiency of ESLNPs, the Quant-iT RiboGreen RNA kit was mixed with either LNPs or LNPs demulsified with 2% Triton X-100. Upon excitation by a 480 nm laser, the fluorescence intensity at 520 nm was measured by a multimode plate reader (EnSight, PerkinElmer, Singapore), and the mRNA content was determined based on the standard curve. The mRNA content in LNP and LNP demulsified with 2% Triton X-100 is denoted as M1 and M2, respectively. The encapsulation efficiency was calculated with the formula: (M2 − M1)/M2 ×100%. The morphology of ESLNPs was determined by transmission electron microscope (TEM). Particle size, polydispersity index (PDI), and zeta potential of ESLNP were measured by the Zetasizer Nano ZS90 (Malvern, UK). PtdSer presentation was validated by flow cytometry20. All the ROS treatment of LNPs was processed with 0.1 mM H2O2 for 12 h.
In vitro cytotoxicity assay
The cell toxicity of ESLNPs was detected by CCK-8 assay. The RAW 264.7 cells were seeded in 96-well plates (1 ×10⁴ cells/well) and incubated with LNPs containing mRNA at different concentrations (62.5, 100, 250, 500, 1000, 1250 ng/mL). After 6 h of incubation, the treated medium was replaced with 100 μL of fresh medium, and cultured for additional 18 h. Subsequently, 10 μL of CCK-8 agent were added to each well, followed by incubation at 37 °C for 2 h. The absorbance at 450 nm was then measured by a multimode plate reader (EnSight, PerkinElmer, Singapore).
Examination of cellular uptake
To visualize LNP-mediated mRNA cellular uptake, mRNA was labeled with carboxyfluorescein (FAM). RAW 264.7 cells (3.0 ×10⁵ cells/well) and BMDMs (3.0 ×10⁵ cells/well) were seeded on sterile glass bottom culture dishes and cultured overnight. PBS, FAM-labeled mRNA and LNPs were added to the dishes and incubated for 5 h. The cells were washed with PBS, and the cell membranes were stained with DiD. Then, extra DiD was removed by washing with PBS, and the nuclei were stained with DAPI. Images were acquired by High-Resolution Living Cell Imager (LSM 900 with Airyscan 2, Zeiss, Germany).
Examination of endosome escape
Raw 264.7 cells (3.0 ×10⁵ cells/well) were seeded on sterile glass bottom culture dishes and cultured overnight. The cells were treated with ESLNPs carrying FAM-labeled mRNA and subsequently incubated for 1 or 5 h. Cells were then washed with PBS and stained with LysoTracker Green (Invitrogen) to label acidic endo/lysosomal compartments, followed by DAPI staining for nuclear visualization. Images were acquired by High-Resolution Living Cell Imager (LSM 900 with Airyscan 2, Zeiss, Germany).
mtDNA isolation and quantification
Mitochondrial DNA (mtDNA) was isolated using a mtDNA isolation Kit (Abcam) according to the manufacturer’s instructions. For immunofluorescence staining, isolated mtDNA was labeled with Cy5-dCTP following the manufacturer’s instructions (Amersham Cy5-dCTP, Cytiva).
Expression of anti-FAP CAR and the macrophage phagocytosis analysis
ESLNPs encapsulating anti-FAP CAR mRNA were prepared for in vitro transfection tests. RAW 264.7 cells and BMDMs cells were seeded into 6-well plates at 3.0 ×10⁵ cells/ well and transfected with LNPs (1 μg of mRNAs/well) for 12 h. Transfection efficiency was tested by flow cytometry, and the expression of Myc-labeled CAR was confirmed by CLSM.
HSCs (1.0 ×10⁵ cells/well) were seeded on sterile glass bottom culture dishes, cultured overnight, and labeled with Cell-Tracker Red CMTPX dye (or pHrodoTM Red for CLSM). To activate quiescent HSCs, the cells were treated with 10 ng/mL TGF-β1 for 24 h. Subsequently, HSCs or aHSCs (1.0 ×10⁵ cells/well) were added to BMDMs (1.0 ×10⁵ cells/well) with different treatments as scheduled and incubated for 12 h. The cells were harvested and stained with anti-CD11b, and the percentage of BMDMs that phagocytosed HSCs and aHSCs was quantified by flow cytometry.
Phenotype changes of macrophages with different treatment
BMDMs were seeded in 6-well plates (3.0 ×10⁵ cells/well) and cultured for 12 h. To mimic profibrotic phenotype macrophage in the fibrotic foci, RAW 264.7 cells and BMDMs were stimulated with mtDNA (100 ng/mL) for 12 h. The macrophages were then incubated with ESLNP encapsulating mRNAs as scheduled. After incubation, the medium was collected, and the concentration of TNF-α, IL-6 et al. was measured by ELISA (Servicebio, China) following the manufacturer’s instruction. The expression of Ly6C and CD86 was detected by flow cytometry (Gallios, Beckman, USA).
Apoptotic cell clearance capacity
AML12 cells were washed once with PBS and incubated with prewarmed Cell-Tracker Red, protected from light, for 30 min in a 5% CO2 atmosphere at 37 °C; cells were then washed twice with PBS and treated with 1968 µL complete DMEM containing 32 µL of 50 mM palmitic acid stock (final palmitate 0.8 mM) for 24 h.
Macrophages treated with or without ESLNPs were labeled with Cell Tracker Green, and then co-incubated with Cell Tracker Red-labeled apoptotic AML12 cells at a 1:1 ratio for 4 h. The efferocytosis process was further visualized by CLSM.
The distribution of LNPs in vivo
To induce CCl4-related liver fibrosis, 6–8 weeks C57BL/6 mice were intraperitoneally (i.p.) injected with 2 μL/g CCl4 diluted in olive oil (1/4, v/v) twice a week. Olive oil injection served as the control group. Both healthy mice and fibrotic mice were injected with LNPs encapsulating Luci mRNA (0.3 mg/kg), and the bioluminescent signals were detected by the IVIS imaging system after luciferin injection (100 mg/kg).
To further determine CAR expression in the liver after systemic administration of C@ESLNPs (1 mg/kg), liver tissues were collected and the proportion of CAR+ cells was analyzed by flow cytometry. (Gallios, Beckman, USA). Macrophages were labeled with anti-F4/80-BV421, and CAR expression was detected with anti-Myc-FITC. CAR expression was further confirmed by immunofluorescence staining of liver tissue sections.
In vivo treatment of CCl4-induced fibrotic mice
Six to eight weeks C57BL/6 mice were intraperitoneally (i.p.) injected with 2 μL/g CCl4 diluted in olive oil (1/4, v/v) twice a week for 4 weeks. Then, the CCl4-treated mice were randomly divided into 4 groups and systemically injected with PBS, T@ESLNP, C@ESLNP and CT@ESLNP twice a week (1 mg/kg) for following two weeks with continued CCl4 stimulation. Body weight was monitored throughout the study. At the end of the treatment period, mice were euthanized and the liver tissues and blood samples were collected for subsequent analysis.
Liver tissue decellularization
To obtain decellularized whole-liver ECM from mice, we followed an in situ perfusion protocol. Briefly, mice subjected to various treatments were anesthetized, and the hepatic portal vein was cannulated with a polyethylene tube connected to a peristaltic pump. The flow rate was set at 3 ml/min, and the inferior vena cava was severed to allow for buffer perfusion. 1.9% EGTA solutions were perfused for 20 min to flush out blood. Then, sodium dodecyl sulfate (SDS) solutions at concentrations of 0.01%, 0.02%, and 0.05% were sequentially perfused over 12 h for each step. Deionized water was subsequently perfused for an additional 12 h to thoroughly rinse away any residual buffer. The decellularized tissues were collected and preserved in glutaraldehyde fixative (Biosharp, China) and further characterization was conducted by Shiyanjia, China.
HYP assays
The total collagen content of liver tissue was quantified by the HYP Content Assay kit (Solarbio, China) according to the manufacturer’s instructions.
In vivo flow cytometry
For the flow cytometry analysis, the tissues were collected and placed into a digestive enzyme cocktail, followed by shaking at 37 °C for 1 h. Then the tissues were homogenized and the suspension was filtered through 70 μm nylon cell strainer, followed by centrifugation at 800 × g for 7 min. The pellet was resuspended in RBC lysis buffer and vortexed for 2 min. Afterward, PBS was added and repeated centrifugation step47. Finally, the sediments were resuspended into PBS and treated with FcR blocking reagent for 15 min (Miltenyi Biotec, Germany). Then, the cell suspension was incubated with desired antibodies for 1 h at room temperature. All samples were analyzed by flow cytometry (Gallios, Beckman, USA).
Immunofluorescence and immunohistochemistry
The cells were seeded on sterile glass bottom culture dishes and cultured for 12 h. After that, these cells were fixed in 4% paraformaldehyde and permeabilized with 0.2% Triton X-100. Non-specific binding was blocked with 2% bovine serum albumin (BSA), after which the cells were incubated with primary antibodies at 37 °C for 1 h. Subsequently, fluorophore-labeled secondary antibodies were applied, and nuclei were counterstained with DAPI as needed.
For immunohistochemistry analysis, mice with various treatments were euthanized, and the liver tissues were harvested and fixed in 4% paraformaldehyde, embedded in paraffin, and sectioned for staining (conducted by Wuhan Servicebio Technology Co., Ltd). Subsequently, the stained sections were visualized and captured by the HD panoramic scan and image analysis system (VS120, Olympus, Japan).
Quantitative PCR
Total RNA from liver was extracted using RNA extraction solution (Wuhan Servicebio Technology Co., Ltd) following the manufacturer’s instructions. RNA samples (1 µg) were then reverse-transcribed into complementary DNA (cDNA) using SweScript All-in-One RT SuperMix for qPCR (Wuhan Servicebio Technology Co., Ltd). The data were normalized to housekeeping gene β-actin expression, and statistical analysis was calculated by the 2−ΔΔCt equation. The primers used in this study are shown in Supplementary Table S3.
Single-cell RNA sequencing
The samples were obtained from the liver from mice treated with PBS or CT@ESLNP. The harvested tissues were transferred to a Petri dish (kept on wet ice) prefilled with 1× PBS (RNase-free, Ca2+/Mg2+-free) and washed with 1× PBS to remove blood, grease, and other surface contaminants. Tissues were then diced into ~0.5 mm2 pieces and washed again with 1× PBS. The tissue pieces were incubated in dissociation solution (0.35% collagenase IV5, 2 mg/mL papain, 120 U/mL DNase I) for 20 min at 37 °C in a shaking water bath (100 rpm). Dissociation was terminated by adding PBS containing 10% fetal bovine serum. The samples were gently triturated 5-10 times with a pipette (carefully to avoid shear-induced cell death), filtered through a 70–30 µm cell sieve, and centrifuged at 300 × g for 5 min at 4 °C The cell pellet was resuspended in 100 µL 1× PBS (0.04% BSA). To remove erythrocytes, 1 mL of 1× erythrocyte lysis solution (MACS 130-094-183, stock 10×) was added and incubated at room temperature or on wet ice for 2–10 min. After lysis, cells were centrifuged at 300 × g for 5 min at 4 °C and the pellet collected. Dead Cell Removal MicroBeads (100 µL; MACS 130-090-101) were added, mixed, and incubated for 15 min at room temperature. Binding buffer was then added and the suspension applied to MS Columns (130-042-201) to remove reagents and dead cells. Cell pellets were collected by centrifugation at 300 × g for 5 min at 4 °C, resuspended in 1× PBS (0.04% BSA), and centrifuged again at 300 × g for 5 min at 4 °C (repeated twice). The resulting single-cell suspension was adjusted to 100 µL of 1× PBS (0.04% BSA). Cell viability was assessed by trypan blue staining and required to be >85%. Cell counts were obtained using a hemocytometer or a Countess II Automated Cell Counter, and the final cell concentration was 700–1200 cells/µL.
Single-cell suspensions were loaded onto a 10× Chromium chip following the manufacturer’s instructions for the 10× Genomics Chromium Single-Cell 3′ Kit (v3). cDNA amplification and library construction were performed according to standard protocols. Libraries were sequenced by LC-Bio Technology (Hangzhou, China) on an Illumina NovaSeq 6000 system (paired-end, 150 bp) to a minimum depth of 20,000 reads per cell. For bioinformatic analysis, raw Illumina base-call files were converted to FASTQ format using bcl2fastq (v5.0.1). scRNA-seq reads were aligned to the reference genome and cellular 3’-end transcripts were identified and counted using Cell Ranger (v7.0.0) (see 10× Genomics support). The Cell Ranger output expression matrix was imported into Seurat (v4.1.0) for quality filtering, scaling and clustering. Low-quality cells were removed using the following thresholds: >500 genes detected per cell and <25% mitochondrial gene content. Finally, cells were projected into two-dimensional space using t-SNE or UMAP.
Biosafety analysis
For the biosafety analysis, healthy mice were randomly divided into four groups and subjected to injections of PBS, C@ESLNP, T@ESLNP and CT@ESLNPs. The mice were euthanized, and the major organs (heart, liver, spleen, lungs, kidneys) were sectioned and stained with H&E. Whole blood was collected, and serum was isolated for the measuring of ALT, AST, CREA and BUN.
Statistical analysis
All statistical analyses of raw data were conducted by GraphPad Prism software. The statistical significance was analyzed by Student’s t test or ANOVA. Significant differences are indicated as ns P ≥ 0.05, *P < 0.05, **P < 0.01, ***P < 0.001, and ****P < 0.0001.
Reporting summary
Further information on research design is available in the Nature Portfolio Reporting Summary linked to this article.