
TTF2 overexpression in glioma and its link to poor prognosis
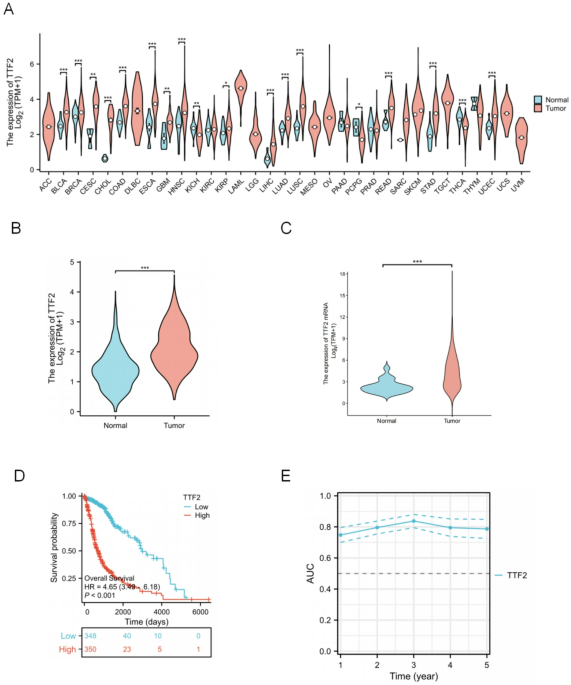
Compared to normal tissue, TTF2 for almost all tumor types in the TCGA database mRNA expression was significantly overexpressed in invasive glioma (GBM and LGG), breast carcinoma (BRCA), colonic adenocarcinoma (COAD), cholangiocarcinoma (CHOL), esophageal carcinoma (ESCA), head and neck squamous cell carcinoma (HNSC), and renal Chromophobe (KICH), hepatocellular carcinoma (LIHC), Lung adenocarcinoma (LUAD), Lung squamous cell carcinoma (LUSC), pheochromocytoma, paraganglioma (PCPG), Rectal adenocarcinoma (READ), Gastric adenocarcinoma (STAD), Thymic carcinoma, prostate carcinoma (PRAD)(Fig. 1A). To further investigate the expression pattern of TTF2 specifically in glioma, UCSC Xena and CGGA datasets were analyzed. Both datasets consistently showed that TTF2 expression in glioma tissues was significantly higher than in normal brain tissues (Fig. 1B–C).Kaplan-meier survival analysis showed that the high expression of TTF2 was significantly associated with a poor prognosis (Fig. 1D). The prognosis of glioma patients was analyzed using the expression level of TTF2mRNA, and the AUC value was 0.7–0.8 (Fig. 1E).

TTF2 mRNA in Glioma and other types of human cancers from TCGA and CGGA data: (A) The expression level of TTF2 in different tumor types in the TCGA database. (B) UCSC Xena analyzed the expression levels of TTF2 in Glioma and normal tissues. The expression of TTF2 in glioma was significantly higher than the normal level. (C) The CCGA database shows the expression levels of TTF2 in Glioma and normal tissues. (D)TCGA data analysis showed that high expression of TTF2 was associated with poor prognosis. (E) Relationship between the expression level of TTF2 and the AUC curve.
High TTF2 expression linked to poor prognosis and a predictive model for glioma survival
The total sample size was 698 cases, among which 401 were male and 297 were female. According to the median expression level of TTF2 in low-grade gliomas, the total samples were divided into the low-expression group and the high-expression group. The detailed clinicopathological features are shown in Table 1. Univariate and multivariate Cox analyses of clinical data showed that: WHO classification (HR = 9.538, 95%CI:7.243–12.560, P < 0.001), 1p/19q coding (HR = 0.225, 95%CI:0.147–0.346), IDH status (HR = 0.116, 95%CI: 0.089–0.151, P < 0.001), Age(HR = 4.696, 95%CI: 3.620–6.093, P < 0.001), TTF2 (HR = 4.645, 95%CI:3.494–6.177, P < 0.001), multivariate analysis showed: WHO classification (HR = 2.571, 95%CI:1.795–3.682, P < 0.001), IDH status (HR = 0.266, 95%CI: 0.179–0.396, P < 0.001), Age(HR = 1.489, 95%CI: 1.090–2.035, P < 0.001) and TTF2 (HR = 1.608, 95%CI:1.113–2.323, P = 0.011) were independent prognostic factors(Table 2) (Fig. 2A-B). We verified this result by fitting TTF2 mRNA expression and other clinicopathological parameters, and established an OS prediction model in TCGA data, including TTF2 and other independent prognostic factors, such as WHO grade, IDH mutation status and age (Fig. 2C). The higher the point on the chart is, the worse the indicative factor is. The performance of the model diagram is evaluated using the calibration curve (Fig. 2D). The accuracy of the model was further verified using the CGGA database (Supplementary Figure S1). Interestingly, using TCGA data analysis, we found that the expression of TTF2 was significantly increased in high-grade gliomas (Fig. 3A). In the analyses of PD (Progressive disease), SD (StableDisease), PR (PartialResponse), and CR (CompleteResponse), it was found that the expression of TTF2 was inversely proportional to the treatment correlation (Fig. 3B). The relationship between progression-free survival (PFI), disease-specific survival (DSS) and the expression of TTF2 also proves this point (Fig. 3C-D).

Univariate and multivariate cox regression analysis of glioma and construction of TTF2 prognostic model: (A–B) Univariate and multivariate Cox regression analysis was conducted using the TCGA database to explore the independent risk factors in glioma. WHO grade, IDH status, Age, and TTF2 were the independent risk factors related to prognosis. (C) nomogram integrating TTF2 and other prognostic factors from TCGA data. (D) Calibration curves of the prediction models for 1/3/5 years.

High TTF2 expression is inversely proportional to the therapeutic effect: (A) The expression of TTF2 significantly increases in high-grade gliomas. (B) In PD (progressive disease), SD (stable disease), PR (partial response), and CR (complete response), the expression of TTF2 is inversely proportional to the therapeutic correlation. (C–D) The relationship between progression-free survival (PFI), disease-specific survival (DSS) and the expression of TTF2 also proves this point.
Functional enrichment analysis of samples with high and low TTF2 expression
To explore the potential mechanism by which TTF2 promotes tumor progression, we analyzed samples with high and low expression of TTF2 and subsequently presented genes co-expressed with TTF2, including up-regulated genes and down-regulated genes (Fig. 4A-B). The correlations of co-expressed genes were demonstrated, with red representing positive correlations and blue representing negative correlations (Fig. 4C). Subsequently, GO enrichment analysis was used to predict the co-expression function of glioma patients. The Top go bioenrichment program (BP), molecular function (MF), and cellular component (CC) groups, including immunoglobulin complexes, signal receptor activation, receptory-ligand activity, cell recognition, etc. (Fig. 4D), KEGG analysis revealed that TTF2 may be involved in a variety of pathways including cell adhesion, the PI3K-AKT signaling pathway, the AGE-RAGE signaling pathway, etc. (Fig. 4E) (Table 3), and the key pathways related to TTF2 were determined through GSEA analysis. GSEA analysis revealed that the data set satisfied FDR < 0.25, P < 0.05. Enrichment analysis and GSEA analysis showed that the expression of TTF2 was related to the production of immunoglobulins, adaptive immune responses, immune regulation, and the transmission of immune cell signaling factors, etc. (Fig. 4F-I).

Functional enrichment of TTF2 in Glioma: (A–B) The samples were divided into high-expression and low-expression groups using the median of TTF2 to explore the co-expressed genes of TTF2. The heat maps respectively showed the top 20 genes positively correlated with TTF2 expression and the top 20 genes negatively correlated with TTF2 expression. (C) The correlation matrix diagram shows the genes associated with TTF2. (D) GO enrichment analysis diagram. (E) KEGG analysis revealed that TTF2 might be involved in multiple pathways such as cell adhesion, the PI3K-AKT signaling pathway, and the AGE-RAGE signaling pathway. (F-I)GSEA analysis showed a correlation with immune responses, such as the production of immunoglobulins, adaptive immune responses, immune regulation, and the transmission of immune cell signaling factors.
The expression of TTF2 in glioma is related to the level of immune infiltration
Considering that both KEGG and GSEA enrichment analyses found that TTF2 might be involved in the tumor immune response, we further used ssGSEA to analyze the relationship between TTF2 mRNA expression and the infiltration level of immune cells. The correlation between immune cell infiltration and TTF2 mRNA expression (Fig. 5A). The results showed that the expression level of TTF2 mRNA was higher than that of Th2 Cells (R = 0.595, P < 0.001) and macrophages (R = 0.509, P < 0.001;) (Fig. 5B-C), neutrophils (R = 0.422, P < 0.001; (Fig. 5D) shows a positive correlation. Additionally, ssGSEA also indicates that the expression of TTF2 is negatively correlated with pDC (R=−0.455, P < 0.001) (Fig. 5E).

TTF2 immune correlation analysis: (A) ssGSEA was used to analyze the relationship between TTF2 mRNA expression and the infiltration level of immune cells. (B) The expression of TTF2 was positively correlated with that of Th2 cells, p < 0.001. (C) The expression of TTF2 was positively correlated with that of macrophages. (D) The expression of TTF2 was positively correlated with that of neutrophils, p < 0.001. (E) The expression of TTF2 was negatively correlated with that of pDC cells, p < 0.001.
To verify the clinical characteristics and expression levels of TTF2 in glioma
The results showed that after dividing the samples into two groups with high and low expression of TTF2, the expression of TTF2 was inversely proportional to 1/19q (Fig. 6A). The expression of TTF2 in mutant IDH was also lower than that in wild-type IDH (Fig. 6B). However, in terms of gender (Fig. 6C), there was no significant difference in the expression of TTF2. In those over 60 years old (Fig. 6D), the expression of TTF2 was significantly increased. The expression of TTF2 was verified using brain tissue and glioma, and it was found that the expression in tumor tissue was significantly higher than that in normal tissue (P < 0.001;) (Fig. 6E).

Correlation analysis of TTF2 expression with clinical characteristics and verification of tissue specimens: (A) In 1p/19q codeletion, the expression of TTF2 was higher in the Non-codel group. (B) In IDH status, TTF2 is expressed higher in WT. (C) In terms of gender, there was no significant difference in the expression of TTF2. \ n (D) In terms of age, the expression of TTF2 was significantly increased in those over 60 years old. (E) The expression of TTF2 was verified using glioma and normal tissue samples. The expression of TTF2 was significantly increased in glioma tumor samples.