
Study design
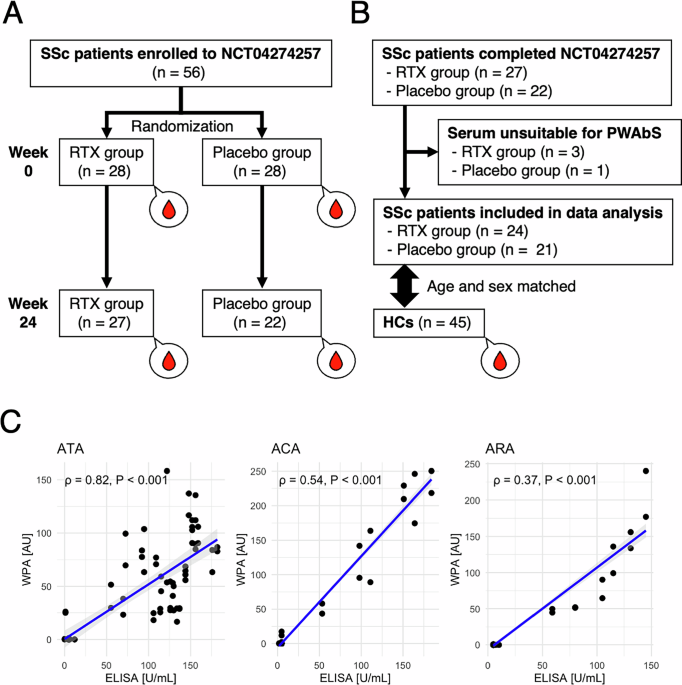
The study design for the DESIRES trial has been previously reported (NCT04274257)30. The full protocol of the trial is available at https://clinicaltrials.gov/study/NCT04274257. Briefly, the DESIRES trial was a randomized, double-blind, placebo-controlled trial of 24 weeks. The primary endpoint of the double-blind phase was the absolute change in mRSS 24 weeks after 13 intervention initiation compared to the baseline. In total, 56 patients were randomized to receive either intravenous rituximab (375 mg/m2) or matching placebo once per week for 4 weeks, based on the allocation factors of 4 disease duration ( ≤ 6 years or >6 years), mRSS ( ≥ 20 or <20), and concomitant ILD (present or absent) by the minimization method. Of these, 49 patients completed the double-blind phase. Serum samples were collected and served for PWAbS at the beginning and the end of the double-blind phase (Fig. 1A). After excluding 4 cases due to their serum unsuitable for PWAbS, data of 45 patients were included in our analysis. Age and sex matched HCs were selected from a cohort of healthcare providers on annual checkups without any medical history (Fig. 1B), using ‘matchIt’ R package52. This study was approved by the ethics committee of the University of Tokyo Graduate School of Medicine and conducted in accordance with the Declaration of Helsinki. Written informed consent was obtained from all patients.
Assessments
Clinical and laboratory assessments were performed at baseline and at 24 weeks after the first infusion of RTX. Skin sclerosis was assessed by mRSS53. Presence and severity of interstitial lung disease (ILD) was judged upon occupied area of interstitial shadows (reticular changes, honeycombing, and ground-glass opacities) by high-resolution CT. Lung function was evaluated by pulmonary function tests. Serum levels of Krebs von den Lungen-6 (KL-6), surfactant protein-A (SP-A), and surfactant protein-D (SP-D) were measured as established markers of ILD in patients with SSc. Laboratory examinations included serum levels of immunoglobulin G (IgG), immunoglobulin M (IgM), immunoglobulin A (IgA), brain natriuretic peptide (BNP). Serum levels of anti-topoisomerase I antibody (ATA), anti-centromere antibody (ACA), anti-RNA polymerase III antibody (ARA), and anti-ribonucleoprotein antibody (RNP) were measured by enzyme-linked immunosorbent assays (ELISA). Quality of life was assessed using the medical outcomes study 36-item short-form general health survey (SF-36) and health assessment questionnaire disability index (HAQ-DI). High responders (HRs) were defined as patients who achieved a ≥ 7-point decrease in mRSS over 24 weeks, while those with a ≤ 6-point change were classified as low responders (LRs). This cutoff was selected to (1) exceed the minimal clinically important difference reported in previous studies54, (2) reflect the shorter time frame compared to typical 12-month endpoints, and (3) ensure a balanced distribution of patients to maximize statistical power within our modest sample size. Based on this definition, 16 patients were classified as HRs and 13 as LRs (Fig. 2B).
Autoantibody measurement
WPAs were arranged as follows33. First, proteins were synthesized in vitro utilizing a wheat germ cell-free system from 13,455 clones of the HuPEX31. POLR3A and TRIM21 existed in two forms: full-length and truncated. ‘TRIM21(1-400)’ indicates a truncated version of TRIM21, covering amino acids 1 to 400, and lacks the protein’s immunoglobulin-binding domains. This truncated version was included in the database to avoid the difficulties in differentiating autoantibody signals from background noise due to the binding nature of full-length TRIM21. ‘POLR3A_D’ represents a truncated form of POLR3A (RNA polymerase III), which improves anti-RNA polymerase III antibody detection. All other proteins were full-length. Second, synthesized proteins were plotted onto glass plates (#S339009, Matsunami Glass, Osaka, Japan) in an array format by the affinity between the GST-tag added to the N-terminus of each protein and glutathione modified on the plates. The WPAs were treated with human serum diluted by 3:1000 in the reaction buffer containing 1x Synthetic block (Invitrogen), PBS, and 0.1% Tween 20. Next, the WPAs were washed, and goat anti-Human IgG (H + L) Alexa Flour 647 conjugate (#A-21445, Thermo Fisher Scientific, San Jose, CA, USA) diluted 1000-fold was added to the WPAs and reacted for 1 h at room temperature. Finally, the WPAs were washed, air-dried, and fluorescent images were acquired using a fluorescence imager (Typhoon FLA 9500, Cytiva, Marlborough, MA, USA). Fluorescence images were analyzed to quantify serum levels of autoantibodies targeting each antigen, following the formula shown below:
$${Autoantibody\; level}\,\left[{AU}\right]=\frac{{F}_{{autoantigen}}-\,{F}_{{negative\; control}}}{{F}_{{positive\; control}}-\,{F}_{{negative\; control}}}\times 100$$
AU: arbitrary unit
F autoantigen: fluorescent intensity of autoantigen spot
F negative control: fluorescent intensity of the negative control spot
F positive control: fluorescent intensity of the positive control spot
Machine learning
We applied supervised machine learning techniques using the Python code with the ‘scikit-learn’ library to analyze the autoantibody measurement data. With the random forest model, decision trees were built and trained in parallel on subsets of sampled instances and features. Meanwhile, with the XGBoost model, decision trees were built sequentially to improve each other. The final prediction of the random forest was based on the majority of its decision trees, while that of XGBoost was derived from their weighted average. The performance of the classifiers was evaluated by 5-fold cross-validation, using the area under the operator-receiver operating characteristic curve (AUC), accuracy, precision, recall, and F1-score, with the higher the scores indicating the better classification performance. The accuracy is the ratio of the correct positive and negative predictions, the precision is the ratio of the correct positive predictions, the recall (or sensitivity) is the ratio of the correct positive predictions among all true positive instances, and the F1-score is the harmonic mean of precision and sensitivity.
WGCNA analysis
The analysis included 135 specimens from SSc patients at week 0 (n = 45) and week 24 (n = 45), as well as HCs (n = 45). The weighted correlation network was constructed using the ‘WGCNA’ R package40. We calculated each gene pair’s Pearson correlation coefficient, measured how similar their expressions were, and created a correlation matrix. Scale-free topology requirements were used to compute the ‘soft’ threshold power to build biologically meaningful scale-free networks. Based on the adjacency matrix, dynamic tree cuts and at least 100 genes per module were utilized to generate a topological overlap matrix for co-expression modules. In addition, we assessed gene significance, module membership, and correlated modules with clinical characteristics and mapped signature genes.
Generation of HEK293 cells overexpressing CCR8
Human CCR8 was stably overexpressed in HEK293 cells using a lentiviral transduction system. Lentiviral particles were generated carrying the pLV[Exp]-Puro-CMV > hCCR8[NM_005201.4] construct (Supplementary Fig. 4A and Supplementary Data 6; VectorBuilder, Yokohama, Japan). HEK293 cells (ATCC CRL-1573, Lot No. 70047548) were purchased from the American Type Culture Collection (ATCC, Manassas, VA, USA). This cell line is not listed in the International Cell Line Authentication Committee database of misidentified or cross-contaminated cell lines. Cell line identity was verified by short tandem repeat profiling, confirming a match to the reference HEK293 profile. Cells tested negative for mycoplasma contamination using a PCR-based assay (last tested on May 17, 2025). Cells were used within 10 passages after thawing for all experiments. HEK293 cells were cultured in Dulbecco’s Modified Eagle Medium (DMEM) with 4.5 g/L glucose and 4 mM L-glutamine (#G7513, Sigma Aldrich, St. Luis, MO, USA) supplemented with 10% fetal bovine serum under standard conditions (37 °C, 5% CO₂), and subcultured every 2–3 days at a 1:3–1:4 split ratio. Cells were transduced with the CCR8-expressing lentivirus and selected using puromycin (1.5 μg/mL) for 3–5 days. Following antibiotic selection, stable cell pools were maintained in 0.75 μg/mL puromycin for downstream validation.
RT-qPCR
Total RNA was extracted from transfected and wild-type HEK293 cells, followed by cDNA synthesis. Quantitative real-time PCR was conducted using primers specific for human CCR8 and GAPDH (housekeeping gene). Relative expression levels were calculated using the ∆∆Ct method. The sequence of the primers used is shown in Supplementary Table 2.
Immunocytochemistry
Cells were also seeded on glass coverslips covered by poly-L-lysine (#28356-84, Nakalai Tesque, Osaka, Japan, 1:100 dilution), fixed with −20°C acetone (#013-00356, FUJIFILM Wako Pure Chemical Corporation, Osaka, Japan), and permeabilized with 0.1% Triton X-100 (#35501-12, Nakalai Tesque, Osaka, Japan, 1:1000 dilution). After blocking with 5% goat serum in PBS, cells were incubated with APC-conjugated primary anti-CCR8 antibody (#566897, BD Biosciences, Franklin Lakes, NJ, USA, 1:100 dilution) overnight at 4 °C. Nuclei were counterstained with VECTASHIELD Mounting Medium with DAPI (#H-1200, Vector Laboratories, Newark, CA, USA) and observed by BZ-X1000 (Keyence, Osaka, Japan).
Isolation of IgG fractions from human sera
IgG fractions were purified from human serum samples using a combination of protein G affinity chromatography, dialysis, and ultrafiltration. Briefly, serum was diluted with binding buffer, applied to a Protein G column (#17112801, Cytiva, Marlborough, MA, USA) and then eluted according to the manufacturer’s instructions. The eluate was then subjected to buffer exchange and removal of low molecular weight components using 10 K molecular weight cut-off dialysis cassettes (#66810, Thermo Fisher Scientific, Waltham, MA, USA). Subsequently, the IgG fraction was concentrated using 10 K molecular weight cut-off centrifugal devices (#88528, Thermo Fisher Scientific). Purified IgG was quantified by absorbance at 280 nm using NanoDrop One (Thermo Fisher Scientific), aliquoted, and stored at −80 °C until use in downstream assays.
Flow cytometry
Live HEK293 cells were collected and washed by PBS. After blocking by 1% FBS and Fc receptor blocking solution (#422301, BioLegend, San Diego, CA, USA, 1:100 dilution) with or without anti-CCR8 antibody (#566897, BD Biosciences, 1:100 dilution), the cells were stained with IgG fraction extracted from anti-CCR8 seropositive SSc sera (n = 4) or from anti-CCR8 seronegative HC at 1 μg/mL (n = 4), followed by staining by PE-conjugated secondary anti-human IgG Fc antibody (#410707, BD Biosciences, 1:100 dilution) and 7-AAD viability staining solution (#420403, BioLegend, San Diego, CA, USA, 1:100 dilution). Flow cytometric analysis was conducted using a CytoFLEX S (Beckman Coulter, Brea, CA, USA) and Kaluza (Beckman Coulter). Gating strategy is shown in Supplementary Fig. 6.
ERK phosphorylation assay
Transfected HEK293 cells were seeded in 24-well plates and cultured for 24 hours. Following serum starvation for 4 hours, the cells were stimulated for 3 minutes under the following conditions: no treatment (n = 4), CCL1 alone (100 ng/mL; n = 4), CCL1 with healthy control IgG (1 µg/mL; n = 4), or CCL1 with IgG purified from anti-CCR8 seropositive SSc patient serum (1 µg/mL; n = 4). Levels of total ERK and phosphorylated ERK were measured using an ELISA kit (#176640, Abcam, Cambridge, UK) according to the manufacturer’s instructions.
Regulatory T cell (Treg) isolation from whole blood
Tregs were isolated from human peripheral blood using the MACSxpress Whole Blood Treg Isolation Kit (#130-109-557, Miltenyi Biotec, Bergisch Gladbach, North Rhine-Westphalia, Germany), following the manufacturer’s instructions with minor modifications. Briefly, 6 mL of EDTA-anticoagulated whole blood was mixed with 500 μL/mL MACS Separation Buffer (#130-091-221, Miltenyi Biotec) and 50 μL/mL Treg Isolation Cocktail. After incubation on a tube rotator at 12 rpm for 10 minutes, samples were placed in a MACSxpress Separator (Miltenyi Biotec) for magnetic depletion. The CD4⁺ fraction was collected and further purified using LS columns (#130-042-401, Miltenyi Biotec), yielding CD4⁺CD25⁺ Treg cells. Cells were pelleted by centrifugation (400 × g, 5 min, RT) and resuspended in ImmunoCult-XF T Cell Expansion Medium (# 10981, STEMCELL Technologies, Vancouver, BC, Canada) at 2 × 10⁶ cells/mL.
Treg culture and expansion
Fresh complete T cell expansion medium was prepared by supplementing ImmunoCult-XF medium with recombinant IL-2 (#202-IL-010, 100 U/mL; R&D Systems, Minneapolis, MN, USA), rapamycin (#73364, 100 nM; STEMCELL Technologies), and ImmunoCult Human CD3/CD28 T Cell Activator (#10971, 25 μL/mL; STEMCELL Technologies). Tregs were cultured at a density of 1 × 10⁶ cells/mL and maintained at 37 °C in 5% CO₂. On days 3 and 6, cells were harvested, counted, and re-seeded in fresh complete medium at 1–2.5 × 10⁵ cells/mL. Cytokine concentrations were maintained throughout culture. After 9 days, Tregs were re-stimulated for 24 hours with CD3/CD28 (12.5 μL/mL) and IL-2 (25 ng/mL) prior to the migration assay.
Transwell migration assay
Following expansion, Tregs were washed and resuspended in PBS containing 1% BSA. Migration assays were conducted using 6.5 mm Transwell® inserts (#3421, 5.0 μm pore, Corning, Corning, NY, USA). The lower chambers were filled with 600 μL of PBS with 1% fetal bovine serum containing CCR8 ligands: CCL1 (#272-I-010, R&D Systems, 100 ng/mL; n = 6), CCL1 and healthy control IgG (1 µg/mL; n = 6), or CCL1 and anti-CCR8 IgG purified from SSc patient serum (1 µg/mL; n = 6). Tregs (5 × 10⁵ cells/well) were seeded in the upper chambers (100 μL/well). All wells received vehicle-matched controls. Plates were incubated at 37 °C and 5% CO₂ for 2 hours. Migrated cells in the lower chamber were collected and stained with FITC-anti-human CD4 (#555346, BD Biosciences) and APC-anti-human CD25 (#555434, BD Biosciences) in PBS, incubated at 4 °C for 30 minutes, washed, and fixed with BD Cytofix Fixation Buffer (#554655, BD Biosciences). Stained cells were analyzed using a flow cytometer to determine the number of migrated CD4, CD25 double-positive cells. Gating strategy is illustrated in Supplementary Fig. 7.
Bleomycin (BLM)-induced SSc mouse model
Pathogen-free, wild-type female C57BL/6NcrSlc mice (MGI ID: MGI:5295404; 6 weeks old) were purchased from Japan SLC, Inc. (Hamamatsu, Shizuoka, Japan), as SSc predominantly affects females in humans and the use of female mice provides a more representative model of disease biology. All mice were housed in an air-filtered clean room under controlled conditions (temperature: 21 ± 1 °C; relative humidity: 60 ± 10%) with a 12-h light/dark cycle. Experimental and control animals were housed under identical conditions to minimize environmental variation. Bleomycin (BLM; Nippon Kayaku, Tokyo, Japan) was dissolved in PBS at a concentration of 1 mg/mL. To induce skin sclerosis, 200 μg of BLM was administered subcutaneously into the shaved dorsal skin of mice once daily for 14 consecutive days using a 30-gauge needle. Control mice received an equal volume of PBS following the same injection protocol. Terminate parameters were established in accordance with the guidelines of the Animal Experiment Committee of the University of Tokyo (Approval number: A2024M092-01). Mice were euthanized if they exhibited feeding or drinking difficulties, signs of distress (such as self-injury, abnormal posture, respiratory distress, or vocalization), persistent external abnormalities without recovery (including diarrhea, bleeding, or genital soiling), or rapid body weight loss exceeding 20% over several days. All experiments strictly adhered to these criteria.
Anti-CCR8 antibody treatment and experimental design
To investigate the potential role of anti-CCR8 Ab in the pathogenesis of systemic sclerosis, a single intraperitoneal injection (200 μL) was administered on day 8 after the initiation of BLM treatment. Six-week-old C57BL/6NcrSlc female mice received either anti-mouse CCR8 monoclonal Ab (#12025; 100 μg/mouse; 0.5 mg/mL; BioLegend) or an isotype-matched rat IgG2b κ control IgG (#400633, 100 μg/mouse; 0.5 mg/mL; BioLegend). The dosage and timing were determined based on preliminary experiments. Experimental groups included six mice in the PBS control group, and five mice in each in the BLM + anti-CCR8 Ab group and the BLM + control IgG group. All procedures involving animals were performed in accordance with the guidelines for animal experimentation of the University of Tokyo and were approved by the Animal Experiment Committee of its Graduate School of Medicine (approval number: A2024M092-01).
Histological analysis
Mice were euthanized by cervical dislocation following anesthesia with isoflurane inhalation (FUJIFILM Wako Pure Chemical Corporation), in accordance with the institutional animal care guidelines. Dorsal skin tissues were collected and bisected. One half of each tissue sample was immediately fixed in MildformR 10 N (#133-10311, FUJIFILM Wako Pure Chemical Corporation) for histopathological analysis, while the other half was preserved in RNAlater RNA Stabilization Solution (#AM-7021, Thermo Fisher Scientific) and stored at −80 °C for subsequent RNA extraction and transcriptomic profiling. The fixed skin specimens were embedded in paraffin, sectioned, deparaffinized, and rehydrated. Hematoxylin and eosin (H&E) staining, Masson’s trichrome staining, and immunohistochemistry utilizing anti-Foxp3 antibody (#12653, Cell signaling technology, Danvers, MA, USA) were performed following standard histological protocols. Stained sections were imaged using a bright-field microscope for histological evaluation.
RNA extraction and next-generation sequencing
Total RNA was extracted from all nine RNAlater-preserved skin tissue samples using the RNeasy Mini Kit (#74106, Qiagen, Hilden, Germany) according to the manufacturer’s instructions. Briefly, tissues were homogenized in Buffer RLT supplemented with β-mercaptoethanol (#444203, Sigma Aldrich) using a TissueLyser II (Qiagen) in microcentrifuge tubes. To eliminate genomic DNA contamination, an on-column DNase digestion step was performed as described in the manufacturer’s protocol. The resulting purified RNA was quantified and assessed using a NanoDrop One spectrophotometer (Thermo Fisher Scientific), and samples with the highest RNA quality from three mice per group were selected for next-generation sequencing. Library construction and sequencing were performed by NovaSeq X Plus (Illumina, San Diego, CA, USA). Read alignment was performed using the STAR aligner55 against the mouse reference genome (GRCm38, version M18).
Differential gene expression and visualization
Differential expression analysis was conducted using DESeq2 (v1.46.0)54 to identify differentially expressed genes (DEGs) across three experimental comparisons: BLM + anti-CCR8 Ab vs. PBS, BLM + control IgG vs. PBS, and BLM + anti-CCR8 Ab vs. BLM + control IgG. Genes with an adjusted p-value (Benjamini–Hochberg corrected) <0.05, an absolute log₂ fold change > 1 (calculated based on the mean normalized counts between conditions) were defined as DEGs. In addition, genes with low expression (TPM < 0.3) in both conditions were excluded from further analysis.
To visualize gene expression patterns, transcript-level TPM values were derived from RNA-seq data. These values were log₂-transformed [log₂ (TPM + 1)] to stabilize variance across genes. The union set of DEGs from all comparisons was selected, and the expression values for these genes were scaled by row (gene-wise Z-score). A heatmap was then generated using the ‘pheatmap’ package (v1.0.12) in R (v4.3.2).
To further illustrate DEG patterns, volcano plots were generated for each comparison using the ‘EnhancedVolcano’ package (v1.24.0). Genes were plotted according to their log₂ fold change and adjusted p-values. Significant genes were color-coded to indicate upregulation or downregulation.
Gene ontology (GO) enrichment analysis of DEGs
To explore the biological functions associated with DEGs, Gene Ontology (GO) enrichment analyses were performed using the ‘clusterProfiler’ package (v4.14.6) in R. DEGs ( | log2 fold change | > 1, adjusted p-value < 0.05, TPM > 0.3 in either condition) were included from further analysis56. GO enrichment was evaluated across the categories of Biological Process (BP), Molecular Function (MF), and Cellular Component (CC). GO terms with a Benjamini–Hochberg corrected p-value < 0.05 were considered significantly enriched. Representative bubble plots were generated to display the top 10 enriched pathways for each category.
Gene set enrichment analysis using hallmark and KEGG pathways
Gene Set Enrichment Analysis (GSEA) was performed to evaluate the enrichment of biologically meaningful pathways based on gene expression changes using the ‘clusterProfiler’ package in R (v4.14.6)57. Only genes with TPM > 0.3 in either condition were included in the analysis. All retained genes were ranked by their log2 fold change values. This complete ranked gene list was used as input for enrichment testing. For Hallmark GSEA, gene sets were obtained from the Molecular Signatures Database (MSigDB, category ‘H’) for Mus musculus. Statistical significance was defined as an adjusted p-value < 0.05. Normalized enrichment scores (NES) were extracted, and pathways with p < 0.05 were visualized heatmap. Color gradients represented the direction and magnitude of enrichment. For KEGG-based GSEA, gene symbols were first mapped to Entrez Gene IDs using the org.Mm.eg.db annotation database. The analysis was performed using the ranked Entrez ID-based gene list as input. Similar visualization procedures were applied.
Ingenuity pathway analysis (IPA)
Gene expression profiles, including log2 fold change values and adjusted p-value of DEGs from mouse skin tissue samples, were uploaded to the Ingenuity Pathway Analysis (IPA, Qiagen) software platform58, as previously described59,60. Core analysis was performed to predict significantly enriched diseases and bio-functions, canonical pathways, upstream regulators, and related molecular interaction networks. The activation state of predicted pathways and regulators was inferred using the IPA z-score algorithm, which evaluates consistency between the observed gene expression patterns and curated directional interactions in the Ingenuity Knowledge Base. Pathways with an absolute z-score ≥2 were considered significantly activated or inhibited.
Statististics and reproducibility
Fisher’s exact test was performed to compare categorical variables. For experiments involving two groups, the Mann–Whitney U test or Wilcoxon signed-rank test was used as appropriate. Multiple comparison adjustment was conducted by Benjamini & Hochberg method. For experiments involving more than two groups, Welch’s ANOVA followed by Dunnett’s T3 multiple comparison adjustment was applied. Spearman’s correlation test was used for correlation analysis. P values < 0.05 were considered statistically significant. Data analyses were conducted using R (v4.2.1) or Prism (v.10.1.1, GraphPad Software, MA, USA). No statistical method was used to predetermine sample size. No data were excluded from the analyses. Animals were allocated to the BLM-treated or control groups according to the experimental design rather than by randomization. All mice were age- and sex-matched and housed under identical specific pathogen-free conditions to minimize variability and control for covariates. Investigators were not blinded to group allocation during the BLM-induced mouse experiments because BLM treatment produces visible skin changes that make the treatment groups readily distinguishable. Blinding was therefore not feasible for these experiments.
Data visualization
Box plots, scatter plots, hierarchical clustering, and correlation matrix were visualized by using R (v4.2.1). Box plots were defined as follows: the middle line corresponds to the median; the lower and upper hinges correspond to the first and third quartiles; the upper whisker extends from the hinge to the largest value no further than 1.5 times the interquartile range (IQR) from the hinge; and the lower whisker extends from the hinge to the smallest value at most 1.5 times the IQR of the hinge.
Reporting summary
Further information on research design is available in the Nature Portfolio Reporting Summary linked to this article.