
Cell lines, primary cells, and culture conditions
Peripheral blood samples were collected from healthy donors with their informed consent. Peripheral blood mononuclear cells (PBMCs) were isolated through density gradient centrifugation using Ficoll-Paque Plus (GE Healthcare). We followed the protocol of NK cell enrichment from PBMC, as reported in previous studies.58 Freshly isolated PBMCs (3 × 10⁶ cells) were co-cultured with K562 cells irradiated with 100 Gy X-rays (0.5 × 10⁶ cells) in a 24-well tissue culture plate. The cultures were maintained in complete RPMI-1640 medium (RPMI media supplemented with 10% heat-inactivated serum, 1% PenStrep, 1 mM NaPyr (stock:100 mM), 10 mM HEPES (stock 1 M), and 50 μM B-ME (stock 50 mM)), supplemented with 10 U/ml recombinant human IL-2 (Peprotech, cat no 200-02). The medium was refreshed every 2–3 days with fresh medium containing 10 U/ml IL-2. After 7 days, the IL-2 concentration was increased to 100 U/ml, and 10 U/ml IL-15 was added. The medium was subsequently replaced every 2–3 days. This culture enriches NK cells from PBMCs with purity >90%. NK-92 cells (a human NK cell line) were a kind gift from Dr. Francesco Colucci, University of Cambridge. These cells have been maintained in RPMI medium supplemented with 10% heat-inactivated serum, 1% PenStrep, 1 mM NaPyr (stock: 100 mM), 10 mM HEPES (stock: 1 M), 50 μM B-ME (stock: 50 mM), and 100 U/ml IL-2. The media was replenished every 3 days. The K562 cell line was a kind gift from Dr. Andrew M Sharkey, University of Cambridge. The K562 cells are irradiated with 100 Gy of X-rays before being used as feeder cells. A549 (human lung carcinoma cell line) was a kind gift from April D’Arcy (Dr Brian Ferguson’s lab), University of Cambridge. The LLC-OVA cell line was a kind gift from Professor Klaus Okkenhaug at the University of Cambridge. RKO (human colorectal cell line) was a kind gift from the Stem Cell Institute, University of Cambridge. The adherent cells have been cultured in DMEM (Invitrogen) supplemented with 10% FBS, 1% penicillin-streptomycin, 1 mM NaPyr, 10 mM HEPES, and 50 μM B-ME.
Bulk RNA-seq processing and analysis
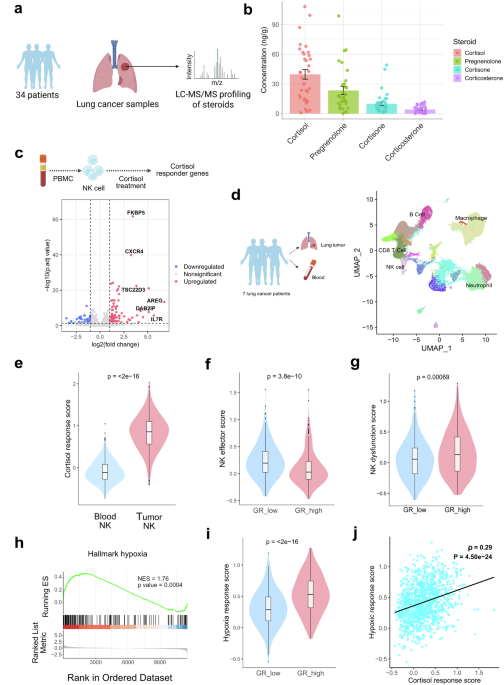
RNA-Seq was performed on high-quality total RNA samples from different samples. RNA was extracted from human primary NK (n = 4), human primary NK treated with cortisol (n = 4), activated human primary NK (co-cultured with K562 for 6 hours) (n = 4), and activated human primary NK treated with cortisol (n = 3). For CAR-NK and glucocorticoid-resistant CAR-NK-related RNA sequencing, RNA was extracted from NK-92 (n = 4), CAR-NK (n = 4), CAR-NK treated with 1 micromolar cortisol (n = 4), NR3C1-KO CAR-NK (n = 4), and NR3C1-KO CAR-NK treated with 1 micromolar cortisol (n = 4) (all cells have been collected from co-cultured with the A549 cell line). For glucocorticoid treatment, cells were treated with one micromolar cortisol (hydrocortisone, h0888-1g, Sigma-Aldrich). In mouse experiments, NK cells have been isolated from subcutaneous tumors. cDNA libraries were constructed, and Sequencing was performed in paired-end mode on an Illumina Novaseq 6000 platform, yielding an average of 30 million reads per library. Raw sequencing reads (FASTQ files) are pre-processed, followed by alignment to the reference genome gencode M32 (Mouse genome GRCm39) or human genome GRCh38 using the alignment tool hisat2 (version 2.2.1).59 The sam files are further inspected, filtered, and processed using samtools (version 1.13).60 HTseq counts obtained from bam files are annotated and subjected to DESeq2 (version 1.34.0) analysis in R (version 4.1.1).61 In the DESeq2 analysis, for each gene, a log2 fold change was computed, and significance was assessed using the Wald test statistic, yielding a p value and an adjusted p value. Differentially expressed genes across conditions were identified using a p adjusted value cutoff of 0.05. The volcano plot was constructed in R using differentially expressed genes identified in bulk RNA sequencing.
Functional enrichment analysis
After differential expression analysis with DESeq2, genes were ranked by fold change, and then, using the fGSEA algorithm, GSEA was performed on all candidate gene sets in the Hallmark database to identify significantly altered pathways. The mouse collection M5: ontology gene sets, the human geneset H: hallmark gene sets, and C5: ontology gene sets from the Molecular Signatures Database (MSigDB) have been used to identify positively and negatively enriched pathways.62 All steps have been performed in R version 4.1.1.
Confocal imaging of HSD11B1 in frozen lung tissue: staining and imaging
Optimal cutting temperature (OCT)-embedded frozen human lung cancer samples were sectioned and mounted on glass slides. Slides were fixed with 1% formalin solution (Sigma-Aldrich) in PBS for 10 minutes at room temperature. After fixation, slides were washed three times with wash buffer (PBS supplemented with 0.5% Tween-20) and permeabilized with 0.2% Triton X-100 in PBS for 10 minutes. This was followed by three additional washes with wash buffer. To block non-specific binding, sections were incubated with 10% goat serum (Invitrogen 31873) in wash buffer for 1 hour at room temperature. Slides were then incubated overnight at 4 °C in a humidified chamber with a rabbit anti-HSD11B1 Polyclonal antibody (Proteintech, 10928-1-AP; 1:100 dilution) prepared in wash buffer containing 5% goat serum. The following day, slides were washed three times with wash buffer (10 minutes per wash at room temperature), then incubated for 1 hour at room temperature in the dark with Alexa Fluor 488-conjugated goat anti-rabbit IgG secondary antibody (Abcam; 1:5000 dilution in 5% goat serum in wash buffer). After secondary antibody incubation, sections were washed three times with wash buffer and counterstained with DAPI (1:2000 dilution) for 10 minutes. Membranes were then stained with CellMask Deep Red according to the manufacturer’s protocol. Final washes were performed three times in wash buffer before slides were mounted using CitiFluor AF1 mounting medium. Imaging was performed using a confocal microscope (STELLARIS8, Leica, Wetzlar, Germany). Images were acquired using a frame size of 512 × 512 pixels in the violet (DAPI; 405 nm excitation, 420–470 nm emission), green (Protein of interest; 488 nm excitation, 495–545 nm emission), and the far-red (CellMask Deep red; 637 nm excitation, 645–700 nm emission) channel. Within the FOV, the upper and lower Z-positions were selected based on the green-channel emission signal, and images were acquired as Z-stacks with 0.5 µm inter-stack spacing.
Generation of CAR-NK cells using Sleeping Beauty (SB) transposon system
To engineer CEACAM5-specific CAR, Sleeping Beauty (SB) transgene cassettes were used. It enables overexpression of second-generation CARs in the NK92 cell line, targeting human CEACAM5. All parental plasmids were custom-designed and obtained from VectorBuilder. For anti-CEACAM5 CAR expression in NK92 cells, the hMN-14 SB vector was synthesized into ultrapure GenCircles (Genscript Biotech). The SB100X mRNA with N1-methyl pseudouridine (m1Ψ) (Genscript Biotech) encoding the Sleeping Beauty transposon has been used to incorporate and stably express the CAR construct. All transgene cassettes, except SB100X, were regulated by the EF1α promoter, whereas SB100X was controlled by the CAG promoter. All electroporations were performed using a Lonza 4D-Nucleofector. For electroporation in the NK92 cell line and RKO cell line, 2 million cells were resuspended in nucleofection buffer and pulsed according to their respective code (For the NK-92 cell line SE kit was used, the nucleofection code was CA 137, and for the RKO cell line SE kit was used with the nucleofection code EN113). For making the CAR-NK 16.4 µL SE solution + 3.6 µL supplement, add 4.8ug of SB100X and 1ug of CEACAM5-specific CAR encoding plasmid. Following nucleofection, cells were immediately rescued with 70 μL of pre-warmed complete media (antibiotic-free) and incubated at 37°C for 20 minutes. Subsequently, cells were further diluted and cultured in complete media. CAR+ NK cells were stained with anti-strep-tag II antibody (FITC) and sorted by FACS.
Construction of CAR
The anti-CEACAM5 single-chain variable fragment (scFv) comprises variable heavy (VH) and light (VL) domains derived from the hMN-14 clone. This CAR construct incorporates a Strep-tag II sequence (WSHPQFEK) and a flexible G4S2 linker, positioned between the CD8α hinge and the scFv domains. The introduction of the Strep-tag II sequence enables easy identification of CAR-positive cells in flow cytometry. The CD28 transmembrane domain is used in conjunction with the intracellular signaling domains of both CD28 and CD3ζ for effective signaling. The CEACAM5-specific CAR construct has been derived from the United States Patent Application Publication. No.: US 2003/0148409 A1 (Pub. Date: Aug. 7, 2003).
CRISPR-mediated knockout of NR3C1 in CAR-NK cells
The sgRNAs have been designed to delete exons 2 and 5 of the NR3C1 gene. The sequence of guide RNA for exon 2 is 5’ GGCCAGACUGGCACCAACGG 3’ and the guide RNA for exon 5 is 5’ AACCUCCAACAGUGACACCA 3’. The nucleofection was carried out using the SE kit (nucleofector program CA137). Post nucleofection, the cells were sorted into a 96-well plate and clonally expanded. Only clones with complete knockout efficiency in both exon 2 and exon 5 of the NR3C1 gene were used for downstream experiments. We have confirmed the knock-out efficiency using Sanger sequencing.
Single-cell RNA sequencing, clustering, and visualization
The previously published, publicly available scRNA-seq datasets used in this study were as follows: GSE127465, GSE131907, and single-cell data from 103 patient samples and other datasets (GSE148071, KU_loom, GSE153935, GSE136246, GSE119911, GSE127465). The data were downloaded from NCBI GEO (https://www.ncbi.nlm.nih.gov/geo/) and processed using the standard scRNA-seq integration pipeline in Seurat.63 We also reanalyzed 318 lung cancer patient sample data from the Single-cell Lung Cancer Atlas dataset (https://luca.icbi.at/),24 we took the fibroblast population from this integrated scRNA seq dataset for in-depth analysis. To cluster the cells, we first identified the top 2000 most variable genes using the FindVariableFeatures function in Seurat. For cell visualization, we applied the Uniform Manifold Approximation and Projection (UMAP) algorithm to project the cells’ PCA space representation into two dimensions. Cell clustering in PCA space was performed with the shared nearest neighbor (SNN) algorithm, using Seurat V3’s FindNeighbors and FindClusters functions. We then visualized the resulting clusters in UMAP space with the DimPlot function. The differentially expressed genes in each cluster were identified with the FindAllMarkers function in Seurat. The clusters have been identified either by previous annotation or by the cluster identity predictor (CIPR) program and validated using marker gene expression from PangloDB.64,65 Gene expression levels were visualized using heatmaps, violin plots, and bar plots, created with the pheatmap package (version 1.0.12) (available at https://cran.r-project.org/web/packages/pheatmap) and the dittoSeq R package (version 1.2.4). Data scaling during visualization was performed automatically using the default settings of these packages.66
Cortisol response score, hypoxia response score, NK dysfunctional score, and NK effector score have been calculated using Seurat’s AddModuleScore function, using the cortisol-responsive gene list as the input feature set.
Marker genes used for scRNA-seq cell-type and functional annotation
NK-cell exhaustion markers
NKG2A (KLRC1), KIR2DL3, TIGIT, HAVCR2 (TIM3), PDCD1 (PD-1), LAG3, KLRG1, TIM3
CD8+ T-cell exhaustion markers
PDCD1, CTLA4, LAG3, HAVCR2, TIGIT, BTLA, CD244, CD160, KLRG1, C10orf54 (VISTA), TOX, TOX2, NR4A1, NR4A2, BATF, NFATC1, EOMES, ENTPD1 (CD39), NT5E (CD73), CXCL13, IL10
Hypoxia-response signature genes
HIF1A, DDIT4, PFKFB3, ALDOA, CXCR4, ETS1, ATF3, JUN, HSPA5
NK-cell dysfunction markers
NR4A1, NR4A2, NR4A3, SOCS1, NFATC1, CBLB
NK-cell effector genes
PRF1, GZMB, IFNG, TNF, NKG7, KLRK1, DNAM1, EOMES, STAT5A, STAT5B
TAM subtype markers
Complement-associated TAMs:
C1QA, C1QB, C1QC, C3AR1, C5AR1
Interferon-stimulated TAMs (ISG-TAMs):
ISG15, IFI6, IFIT3, CXCL9, CXCL10, STAT1, IRF7
Lipid-associated macrophages (LAMs):
APOE, APOC1, LPL, TREM2, CTSD, TYROBP
M2-like TAMs:
MRC1 (CD206), CD163, MSR1, IL10, SEPP1, F13A1
CAF subtype markers
iCAF: C3, CXCL12, IL6, PDPN, PTGS2
Epi-CAF: HLA-DRA, CD74
dCAF: PCNA, MCM2, TOP2A, MKI67
myCAF: MMP11, CDH11, POSTN, ACTA2, TAGLN, COL1A1
Cytotoxicity of CAR-NK cells and glucocorticoid-resistant CAR-NK Cells in vitro
To determine the cytotoxicity of CAR-NK and glucocorticoid-resistant CAR-NK cells, a co-culture experiment was performed using a CEACAM5 + BFP+ cell line at different E:T ratios. The confluence of adherent cells was ~80%, and 100 K cells had been seeded for co-culture. After co-culture, the number of dead tumor cells was quantified using live-dead NIR or Propidium iodide staining and flow cytometry. The expression of IFNγ, TNFα, and granzyme B and CD107a expression by CAR-NK and glucocorticoid-resistant CAR-NK cells was determined using flow cytometry.
Mice
In this study, all C57BL/6 J mice were handled and cared for according to the strict guidelines established by the UK Animals in Science Regulation Unit’s Code of Practice for the Housing and Care of Animals Bred, Supplied, or Used for Scientific Purposes and the Animals (Scientific Procedures) Act 1986 Amendment Regulations 2012. Experimental procedures were carried out under the authority of a UK Home Office Project License (PPLs: PP4938782 and P0AB4361E) and were approved by the institute’s Animal Welfare and Ethical Review Body to ensure compliance with ethical and welfare standards. All mice were housed in the Gurdon animal facility under specific pathogen-free conditions, with a 12-hour light and 12-hour dark cycle. The LLC-OVA cell line has been used to develop a subcutaneous tumor in C57BL/6 J mice. 1 million LLC-OVA cells were injected subcutaneously in each mouse; from there, half of the mice were treated with mifepristone (60 mg/kg body weight) every other day, and the other half of the mice were treated with vehicle (olive oil) through oral gavage for 18 days. The mifepristone concentration has been determined based on the previous literature.2 On the 19th day, mice were euthanized, and the tumor was processed to isolate NK cells. We studied the transcriptomics of tumor-infiltrating NK cells.
Western blot antibodies
IκBα – Cell Signaling 4814 P, Phospho-IκBα (Ser 32/36) – Cell Signaling 9246, Akt (pan) (C67E7) Cell Signaling Rabbit mAb 4691, Phospho-Akt (Ser473) Cell Signaling 9271 were used.
Tumor tissue processing
The tumors were mechanically dissociated and were then subjected to enzymatic digestion using a mixture of 1 mg/ml collagenase D (Roche), 1 mg/ml collagenase A (Roche), and 0.4 mg/ml DNase I (Sigma) in IMDM media containing 10% FBS, all incubated at 37 °C for 30–40 minutes. To halt collagenase activity, EDTA (5 mM) was introduced to all samples. The digested tissues were finally strained through 70 μm cell strainers (Falcon) to ensure uniformity in sample preparation. After tissue processing, samples with sufficient viable cells were analyzed by flow cytometry.
In Vivo Testing of CAR-NK and NR3C1-KO CAR-NK cells in NSG mice
NSG-SGM3 mice (NOD.Cg-Prkdcscid Il2rgtm1Wjl Tg(CMV-IL3, CSF2, KITLG)1Eav/MloySzJ) were purchased from The Jackson Laboratory and used to establish breeding colonies, which were housed in individually ventilated cages and maintained in a pathogen-free facility at the Central Biomedical Services, University of Cambridge. All experimental procedures were approved by the United Kingdom Home Office under the Animal (Scientific Procedures) Act 1986 (PPL numbers: PP5753595 and PP1611558). To establish a lung metastasis model, mice were intravenously injected with 1 × 10⁶ firefly luciferase-labeled A549 lung adenocarcinoma cells in 100 μL PBS via the tail vein. After 14 days, tumor colonization was confirmed by bioluminescent imaging (BLI) using the IVIS Spectrum imaging system (PerkinElmer) following intraperitoneal injection of D-luciferin (150 mg/kg). Mice were then randomized into two treatment groups for a blinded experimental setup. The CAR-NK group received 1 × 10⁷ conventional CEACAM5-specific CAR-NK cells, NR3C1-KO CAR-NK group received 1 × 10⁷ NR3C1-deficient CAR-NK cells via intravenous injection on day 15. To mimic the steroid-rich TME and support NK-cell persistence, both groups received dexamethasone (10 mg/kg, intraperitoneally) and recombinant human IL-2 (10,000 U/ mouse) on alternate days for 14 days. Tumor progression was monitored longitudinally using BLI at defined time points (days 14, 23, and 29). At the endpoint, mice were euthanized, and lung, liver, spleen, bone marrow, and peripheral blood were harvested for flow cytometry, histopathology, and immunophenotyping. Flow cytometric analysis was performed using a Cytek Aurora. Lung and liver histology were evaluated on formalin-fixed, paraffin-embedded sections stained with hematoxylin and eosin (H&E).
Cell sorting and RNA extraction
After processing the tumor samples into single-cell suspensions, they were incubated for 1 hour at 4 °C with anti-mouse CD45 (FITC-conjugated), anti-mouse CD3 (APC-conjugated), and anti-mouse NK1.1 (PE-Cy7-conjugated) antibodies, diluted in PBS containing 1% bovine serum albumin (BSA) and 2 mM EDTA. DAPI was added before sorting. The stained samples were then sorted using a BD FACSAria™ II cell sorter. Cells have been collected in serum, and RNA has been extracted using the RNeasy Mini Kit or the RNeasy Micro Kit (QIAGEN) based on the manufacturer’s protocol. In the case of NK cells sorted from a mouse tumor, the RNA was amplified using the SMARTer amplification technique before proceeding to RNA-seq.
Collection of human lung tumor tissue
Human samples used in this research project were obtained from the Imperial College Healthcare Tissue Bank (ICHTB). ICHTB is supported by the National Institute for Health Research (NIHR) Biomedical Research Center based at Imperial College Healthcare NHS Trust and Imperial College London. ICHTB is approved by Wales REC3 to release human material for research (22/WA/0214), and the samples for this project, R24029, were issued from sub-collection reference numbers of each sample given in Supplementary table 1. PBMCs from healthy donors were obtained under a protocol approved by the Human Biology Research Ethics Committee of the University of Cambridge (HBREC2019.15).
PROGENy pathway analysis
Pathway activity scores were inferred using the PROGENy R package (version 1.30). Briefly, differential expression analysis was performed on normalized RNA-seq data, and the resulting gene-level expression matrix was used as input. PROGENy was run with the “top 100” footprint genes per pathway and human model settings to compute weighted pathway activity scores for each sample or condition. All analyses regarding the PI3K AKT pathway and the NF-κB pathway have been performed from the RNA of activated CAR-NKs or cortisol-resistant CAR-NK cells. For activation, CAR-NK or cortisol-resistant CAR NK cells have been co-cultured with CEACAM5-expressing A549 cells. Unless otherwise specified, default parameters were applied. Resulting pathway scores were compared between groups using the Wilcoxon rank-sum test (two-sided), and adjusted P values were reported where applicable.
Mass spectrometric steroid profiling
Steroid levels (cortisol, cortisone, corticosterone, and pregnenolone) were quantified in 34 lung tumor tissues. Comprehensive steroid profiling, including glucocorticoids, mineralocorticoids, androgens, estrogens, and progestogens, was subsequently performed in a subset of 20 lung tumor tissues. Stage-stratified cortisol analysis was performed in 22 tumors. Steroids were measured by liquid chromatography-tandem mass spectrometry (LC-MS/MS) using ultra-performance liquid chromatography (UPLC) coupled to triple-quadrupole mass spectrometry. Samples were enriched with isotopically labeled internal standards and were extracted using supported liquid extraction alongside a calibration curve of multiple steroids. Tissue samples were thawed, homogenized, enriched with isotopically labeled steroids as internal standards, and acetonitrile-extracted prior to LC-MS/MS analysis.67 Sample extracts were separated on a Waters Acquity I-Class system fitted with a Kinetex C18 column (150 × 2.1 mm; 2.6 μm). This was followed by Mass spectrometry analysis on a QTRAP® 6500+ System (AB Sciex, UK) (RRID: SCR_021833) using polarity switching electrospray ionization and multiple reaction monitoring, alongside a multi-steroid calibration curve (0.0025–10 ng) for precise steroid quantification, analyzed using MultiQuant software (AB Sciex, UK).68
Flow cytometry
Flow cytometry was performed on a Cytek Aurora [Spectral Flow Cytometry] Cytometer, with all analysis done on FlowJo software (v10.9.0). Cells were stained for viability with LIVE/DEAD Fixable Near-IR or Live dead Ghost dye and blocked with Human TruStain FcX (Biolegend) or mouse TruStain FcX (Biolegend) before antibody staining. All gating strategies used in the analysis are shown in Supplementary Figs. 10 and 11. For antibody staining, cells were resuspended in FACS buffer (PBS with 2% FBS). Cells were fixed in IC Fixation Buffer (eBioscience) and washed in FACS buffer twice before acquisition. The following antibodies have been used in flow cytometry study in mice tumor tissue CD45 (Buv563), Ghost Dye UV 450, IFNγ (BUV737), CD161(NK1.1)(BUV805), CD3 (Spark Blue 550), TNF (Spark NIR 685), CD49b (APC-Fire 750), PD1 (PE), CD184 (CXCR4) (Brilliant Violet 711™), CD226 (DNAM1) (PE/Dazzle™ 594), KLRG1 (MAFA) (PE cy7), Granzyme B (FITC), Perforin (APC/Fire™ 750), CD152 (CTLA4) (Brilliant Violet 605™), NKG2D (APC). In humans, the antibodies were IFNγ (PerCP-Cy5.5), TNFα (PE-Cy7), CD56 (BV421), PD-1 (FITC), Granzyme B (APC), and CD107a (PE) (BioLegend).
Measurement of liver tissue damage
Semi-quantitative tissue scoring was carried out depending on the visual field inspection of liver tissue sections stained by H and E from each group. Organ morphometrical analysis was carried out by giving a score based on the level of damage seen in each section in each group, according to the severity in the examined tissue: 0 = no lesions; 1 = mild (1 to 25%); 2 = moderate (26 to45%); 3= severe (>45%) as described previously,69,70 and then the scores were added to create a final total score (TLS) ranging from 0 to 18. Liver tissue sections were scored according to alterations in vascular changes, inflammation, Kupffer cell reaction, hepatocellular degeneration, necrosis, and anisokaryosis.71 Morphometry was carried out at the Image Analysis Unit, Department of Pathology and Clinical Pathology, Faculty of Veterinary Medicine, Sohag University.
Statistical analysis
Statistical analyses were performed using unpaired two-tailed Student’s t tests, Wilcoxon rank-sum tests, or two-way ANOVA, as appropriate and as specified in the figure legends. Differentially expressed genes in bulk and single-cell RNA-seq datasets were identified using the statistical frameworks and default P value calculations implemented in the respective R packages. Sample sizes were determined based on power calculations, pilot experiments, or prior experience with variability in similar assays. Samples that failed quality control or experienced technical processing issues were excluded before analysis, and no other data were removed. Statistical significance was defined as P < 0.05 unless stated otherwise. Analyses were performed in GraphPad Prism 10 (GraphPad Software) or R, and schematic illustrations were generated using BioRender.com.