
SQB fabrication
SQB fabrication is detailed in a previous publication, including scaffold and staple sequences52,84. Scaffold p8634 was produced in-house, as previously published85. DNA staple strands were purchased from Integrated DNA Technologies (IDT). Folding concentrations were 5 mM Tris base, 1 mM ethylenediaminetetraacetic acid (EDTA; pH 8.0), 12 mM MgCl2, 20–100 nM scaffold, 5 times excess of the basic staple strands (relative to scaffold concentration), 10 times excess of handle-conjugated staple strands (for attachment of relevant infectious-disease antigens) and 20 times excess CpG-staple strands. An 18 h thermocycler program was used to fabricate SQBs: denaturation at 80 °C for 15 min, then annealing via a temperature ramp from 50 °C to 40 °C decreasing at −0.1 °C every 10 min and 48 s. Most staple strands include ten thymidine residues at the end of the double helices to minimize aggregation. The CpG-containing strands were appended on the flat face of the SQB. The CpG oligonucleotides with nuclease-resistant phosphorothioate backbones (5′–TCCATGACGTTCCTGACGTT–3′, IDT) replaced the corresponding thymine residues in a 3.5 nm nanoscale pattern as determined previously52. CpG was appended to the 5′ ends of designated strands.
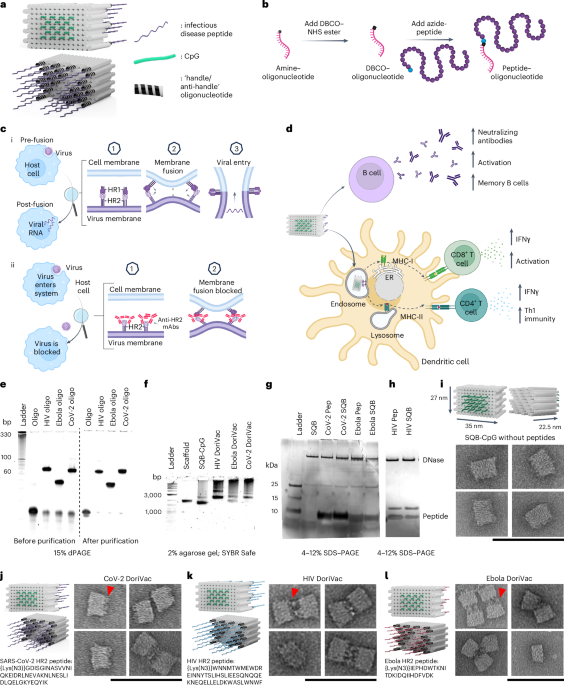
HR2 peptide conjugation with anti-handle oligonucleotide
An anti-handle oligonucleotide, which corresponds to 24 sites of handle oligonucleotide on the extruding face of the SQB, was ordered from IDT with a 5′ amine (aminoC6-TTCTAGGGTTAAAAGGGGACG). HR2 peptides were ordered from GenScript with an azide-modified N-terminal lysine (Fig. 1i–l and Supplementary Table 2) for DBCO-azide copper-free click chemistry reaction between the peptide and oligonucleotide. The oligonucleotide was prepared at 1 mM with phosphate buffer (pH 8.0). The DBCO–NHS ester (Millipore, 761524) (diluted in DMSO to 2 mM) was incubated with the oligonucleotide (diluted in phosphate buffer pH 8.0 to 100 µM) in 1:1 volume ratio and 1:20 oligonucleotides-to-DBCO ratio (with final concentration of DBCO > 1 mM) and incubated overnight at ambient temperature. The oligonucleotide–DBCO was purified via Illustra NAP column (GE Healthcare Life Sciences, 17-0852-02), eluted with sterile water and concentrated via 3K Amicon Ultra Centrifugal Filter Unit (Millipore, UFC500324). DBCO incorporation was confirmed via OD310 peak. Concentration was measured via A260 with the NanoDrop. The azide-modified HR2 peptides, representing SARS-CoV-2, HIV and Ebola, were dissolved in DMSO to 5 mM. The peptide-azide was mixed with the oligonucleotide–DBCO at a ratio of 1.5: 1 and incubated overnight at room temperature in 1× PBS.
Denaturing PAGE verification and purification of peptide-conjugated oligonucleotide
To confirm peptide–oligonucleotide conjugation, 15% denaturing PAGE (dPAGE) was used. dPAGE gel (15%) was prepared using 9 ml urea concentrate (Fisher Scientific, EC-833), 4.5 ml urea dilutant, 1.5 ml urea buffer, 10 µl tetramethylethylenediamine and 150 µl 10 wt% ammonium persulfate in a casette (ThermoFisher Novex, NC2010)52. Then 5 pmol of the sample was mixed in a 1:1 ratio with formamide loading buffer and denatured at 80 °C for 10 min before loading into wells. Electrophoresis was carried out in 0.5× TBE buffer at 250 V for 45 min, followed by staining with SYBR Gold and imaging using the Typhoon Gel Scanner. For purification, the mixture was combined with formamide loading buffer, loaded into an 8% dPAGE gel in a large well formed using a taped comb, and run at 250 V for 50 min. The peptide–oligonucleotide was observed through UV shadowing on a thin-layer chromatography plate, excised, crushed and immersed in 1× TE buffer. After overnight shaking at 25 °C, purification was performed using Freeze ‘N Squeeze DNA Gel Extraction Spin Columns (Bio-Rad, 7326165) and ethanol precipitation. The resulting peptide–oligonucleotide was resuspended in 1× PBS, and its concentration was determined using NanoDrop. Confirmation of purification was achieved via dPAGE.
Protein conjugation with anti-handle oligonucleotide
We generated protein–oligonucleotides by conjugating azide-modified DNA handles to the protein (obtained from Sino Biologic or Advanced ImmunoChemical; Supplementary Table 13) via the amino group present on lysine residues using DBCO-azide click chemistry. The reaction was incubated in phosphate buffer with a pH of 8.0 overnight at 4 °C and was subsequently agitated at 37 °C for 30 min. At higher pH levels (>8.0), NHS reactivity towards the ε-amino groups of lysines is enhanced compared to the α-amino group86. For gel quantification assays, the protein was simultaneously labelled with NHS-Cy3 dye. DTT was also added to the reaction to reduce any disulfide bonds.
For SARS-CoV-2 spike protein conjugations, the purified spike protein (Sino Biological, catalogue number 40589-V08H8, in phosphate buffer pH 8.0) was conjugated to azide-modified oligonucleotides similar to above but agitated longer at 37 °C for 60 min. Conjugation efficiency was assessed by SDS–PAGE and silver staining, and successful SQB attachment was confirmed via agarose gel electrophoresis and TEM.
Silver stain verification and purification of protein-conjugated oligonucleotide
Silver stain confirmed protein–oligonucleotide conjugation. The sample, mixed with 4× NuPAGE LDS sample buffer (ThermoFisher, NP0008), underwent incubation at 95 °C for 2 min before loading onto 4–12% NuPAGE Bis–Tris gels (ThermoFisher, NP0322) and electrophoresis at 150 V for 45 min in 1× MES SDS running buffer (ThermoFisher, NP0002). Gel analysis followed Pierce’s (24612) silver staining protocol using Image Lab 6 on a Gel Doc EZ Imager (Bio-Rad). Purification used a 10K Amicon filter; the reaction sample, supplemented with phosphate buffer, was centrifuged at 14,000 × g for 30 min until the flow-through reached a DNA concentration of less than 1 ng µl−1, indicating removal of all unconjugated DNA. Buffer exchange was carried out to 1× TE 10 mM MgCl2.
Peptide- or protein-conjugated oligonucleotide hybridization with SQB
The peptide–oligonucleotides or protein–oligonucleotides were hybridized to the SQB DNA origami in a 2× excess, maintaining 10 mM MgCl2 and 1× TE by adding stock 10× TE and 100 mM MgCl2. SQBs were added last to ensure a consistent buffer environment. The resulting conjugated SQBs were incubated at 37 °C for 1–2 h with shaking, followed by purification through PEG precipitation. Analysis was performed using agarose gel electrophoresis, TEM and a DNase I degradation assay.
Agarose gel electrophoresis
SQBs were analysed via 2% native agarose gel electrophoresis. Gel was prepared with 0.5× TBE buffer with 11 mM MgCl2 and 0.005% v/v SYBR Safe (ThermoFisher, S33102), run at 70 V for 2 h, and imaged via a Typhoon Gel Scanner.
TEM analysis
TEM was used to assess structural integrity and SQB aggregation using negative-stain techniques. Formvar-coated, carbon-stabilized grids, either self-prepared or obtained from Electron Microscopy Services (FCF200-CU-TA), were plasma-discharged for 30 s for passivation. Subsequently, 4–10 nM SQBs were deposited on the grids for 45 s, followed by blotting with filter paper. Uranyl-formate solution (0.75% w/v in H2O) was applied to the grid and blotted off, and a second application lasted for 2 min before blotting. Imaging of the grids occurred using a JEOL JEM-1400 TEM in brightfield mode at 120 kV.
SQB purification via PEG precipitation
CpG-SQBs or peptide- or protein-conjugated CpG-SQBs were purified via PEG precipitation. Then 1× TE buffer (5 mM Tris base, pH 8.0 and 1 mM EDTA acid) containing 15% w/v PEG-8000 (Fisher Scientific, BP2331) and 510 mM NaCl was added to the SQB sample at 1:1 volume and mixed gently via pipetting. MgCl2 stock was added to the PEG solution to achieve 10 mM MgCl2 final concentration. As described previously, the solution was incubated for 30 min then centrifuged at 16,000 × g for 25 min, and the supernatant was removed52. This procedure purifies and concentrates the sample, as a high concentration is often required for further studies. The concentration was determined via Nanodrop; the sample purity and integrity were confirmed via agarose gel electrophoresis and TEM.
DNase I degradation and silver stain analysis of conjugation efficiency
For analysis of conjugation efficiency, 1 µg of SQBs was incubated with 1.0 U µl−1 DNase I (NEB) with 10× DNase I buffer diluted in water (New England Biolabs, M0303S). Samples were incubated in the thermocycler for 30 min at 37 °C. Silver staining was performed as described above. ImageJ (v1.54g) was used to quantify band intensities and determine peptide or protein loading efficiencies.
K10-PEG5k coating of SQBs
Before administration, PEG-purified peptide- or protein-conjugated SQBs were mixed with oligolysine-PEG5k (K10-PEG5k; methoxy-poly(ethylene glycol)-block-poly(L-lysine hydrochloride); n = 113, x = 10; Alamanda Polymers (mPEG20K-b-PLKC10)) based on the calculated number of phosphates in the SQB sequence. An appropriate quantity of K10-PEG5k was added to match the number of nitrogens in its amines with the SQB phosphates, following a previously published method87. The mixture underwent incubation at 37 °C for at least 30 min, and concentration was determined based on dilution.
Animal model and treatment
C57BL/6 mice (6–8 weeks old) were obtained from Jackson Laboratory and housed at the Harvard Medical School animal facility. Eight groups of eight mice each underwent the following treatments: (1) SARS-CoV-2-HR2 DoriVac, (2) SARS-CoV-2 HR2 bolus, (3) HIV-HR2 DoriVac, (4) HIV-HR2 bolus, (5) Ebola-HR2 DoriVac, (6) Ebola-HR2 bolus, (7) SQB-CpG + free HIV-HR2 peptide and (8) untreated. The bolus contained an equivalent dose of CpG and HR2 peptide in PBS. Following 1 week acclimation, mice received the first treatment dose (100 µl of DoriVac containing 0.36 nmol of CpG and 0.48 nmol of HR2 peptide) subcutaneously on days 0 and 20. Blood was drawn via submandibular vein puncture 4 h after dosing and also on days 14, 20 and 28. On days 21 and 35, four mice from each group were killed; heart blood, LNs, spleens and femurs were collected. All procedures were approved by the Harvard Medical School Institutional Animal Care and Use Committee. mRNA–LNP vaccines (mRNA-1273.222 and BNT162b2-Omi.BA.4/BA.5) were diluted in sterile DPBS to the indicated doses before administration. Subcutaneous or intramuscular (right hind leg; quadriceps femoris) injections were performed using fresh preparations to maintain vaccine integrity.
Lymph-node-on-a-chip and tonsil organoid vaccination
For the fabrication of the lymph-node-on-a-chip, primary human lymphocytes were isolated from peripheral blood by density gradient centrifugation. T cells, B cells and monocytes were purified using StemCell isolation kits and combined at a ratio of 49:49:2. These cells were resuspended at a density of 2 million cells per 15 µl of 3D hydrogel and seeded into a microfluidic Emulate Chip S-1, which allows continuous superfusion with complete RPMI-based medium to recreate the three-dimensional and fluidic microenvironment of lymphoid tissue. Cells were cultured under flow conditions, during which they reaggregated and self-assembled into lymphoid follicle-like structures. Physiological perfusion was maintained using the Emulate Zoe-CM1 module63. Cryopreserved human tonsil single-cell suspensions were washed, counted and resuspended at high density in complete RPMI-based medium. For organoid formation, 2 million cells were plated onto permeable membrane supports in 24-well Transwell inserts and cultured at 37 °C with 5% CO2 (ref. 67). Both lymph-node-on-a-chip and tonsil organoid cultures were treated with 1 nM of vaccine. Human patient-derived apheresis collars and tonsils were obtained from the Crimson Biomaterials Collection Core Facility under Harvard University Institutional Review Board approval, with all samples de-identified and donors providing informed consent in accordance with ethical guidelines. In LN chip experiments, RPMI medium supplemented with 10% FBS, 1% antibiotics, IL-2 and IL-4 was circulated for 14 days. Medium was recirculated every 2–3 days. Four and 9 days after the start of perfusion, 50% of the perfusion medium was replaced with fresh medium containing IL-2 and IL-4. Culture outflows at day 14 were collected to assess antibody responses against SARS-CoV-2 spike variants. Tonsil organoid cultures received fresh medium in a 1:1 ratio on day 4. At study conclusion, cells were collected by blocking one basal channel port and manually pipetting Cell Recovery Medium (Corning, 354253; 200 µl per chip) through the other to extract extracellular matrix and cells, which were then depolymerized, centrifuged and resuspended for further analysis.
Processing blood cells
Blood was collected either via heart extraction or through a submandibular cheek draw into heparin-coated tubes. Plasma and blood cells were separated via centrifugation at 800 × g and 4 °C for 5 min. The collected plasma was stored at −80 °C until analysis, while the blood cells underwent treatment with red blood cell lysis buffer (10×) from BioLegend (420301) three times, following the manufacturer’s protocol. PBMCs were subsequently analysed using ELISpot and/or flow cytometry (Cytoflex LX).
Luminex multiplex ELISA analysis
The customized Bio-Plex Pro Mouse Cytokine Standard 23-plex kit from Bio-Rad included the following cytokines: IL-1α, IL-1β, IL-2, IL-3, IL-4, IL-5, IL-6, IL-9, IL-10, IL-12p40, IL-12p70, IL-13, IL-17A, Eotaxin, G-CSF, GM-CSF, IFNγ, MCP-1, MIP-1α, MIP-1β, RANTES, TNF, following the manufacturer’s protocol. Data collection was performed using the Bio-Plex 3D Suspension Array System (Bio-Rad).
Processing LNs
Following euthanasia, the upper axillary and superficial cervical LNs from the mouse were collected and stored in cold PBS, as previously outlined52. These LNs were processed into single-cell suspensions for flow cytometry analysis (Cytoflex LX) by gently mashing them through a 40 µm cell strainer using a sterile syringe plunger into a petri dish. Cells were collected into 1.5 ml Eppendorf tubes, centrifuged at 400 g for 5 min at 4 °C, and the supernatant was discarded. The cell pellet was resuspended in 700 µl of PBS and distributed into 96-well plates for flow cytometry analysis.
Processing spleens
Following euthanasia, mouse spleens were collected, washed with PBS, and mashed through a 40 µm cell strainer into a 60 mm petri dish using a sterile syringe plunger. The resulting single-cell suspension was washed with complete RPMI-1640 media (containing 10% fetal bovine serum and 1% penicillin-streptomycin), collected into a Falcon tube, and subjected to two treatments with red blood cell lysis buffer (BioLegend, 420301) following the manufacturer’s protocol. The cell pellet was resuspended in 2 ml of complete RPMI media, and the cell count was determined. These splenocytes were used for flow cytometry or ELISpot assays.
Processing bone marrow
Following euthanasia, femurs were repeatedly washed with PBS. Muscle fibres and connective tissues were extracted using forceps. Marrow extraction involved flushing the bone with a syringe into a PBS-filled dish. The collected marrow clot was pipetted, filtered through a 40 µm cell strainer, and gathered into a Falcon tube. The resulting single-cell suspension underwent centrifugation at 300 × g for 5 min. After discarding the supernatant, the pellet was treated with red blood cell lysis buffer (BioLegend, 420301) following the manufacturer’s instructions. The suspension was centrifuged at 300 × g for 5 min and subsequently resuspended in culture media for flow cytometry (Cytoflex LX).
Flow cytometry
Single-cell suspensions of LNs, PBMCs, spleens and bone marrow were obtained. The suspensions were washed with PBS, stained with Zombie UV (BioLegend, 423108) or ViaKrome 808 (Beckman Coulter, C36628) viability dye and washed with cell staining buffer (BioLegend, 420201). The cells were stained with fluorophore-conjugated cell surface antibodies (Supplementary Tables 4–6, 11, 12 and 18). Intracellular staining was performed using permeabilization and fixation reagents (BioLegend, 424401). Antibodies were arranged into appropriate panels, compensations were set up to minimize fluorescent emission overlap, and the cells were analysed on a Cytoflex LX flow cytometer. Storage events were gated on the population of interest, based on protocols published previously52, and according to the gating in Supplementary Figs. 2, 5, 9, 11, 12, 16, 18 and 19. Flow data were analysed using FlowJo V10.
CD8 and CD4 enrichment of splenocytes
Splenocytes were depleted for CD4+ or CD8+ T cells using CD8 Dynabeads (Thermofisher, 11145D) or CD4 Microbeads (Miltenyi Biotec, 130-117-043), according to manufacturer’s instructions. The remaining sample was enriched for CD4+ T cells (via CD8+ T cell depletion) or enriched for CD8+ T cells (via CD4+ T cell depletion). Splenocytes were maintained in 4 °C for 36 h before processing for CD8+ T cell enrichment. For CD8 depletion, the Dynabeads were washed in isolation buffer and placed in the magnet. At the same time, cells were prepared at a concentration of 1 × 10⁷ cells per ml in isolation buffer. The prewashed beads were added, and the solution was incubated for 30 min at 4 °C with gentle tilting. Afterwards, the tubes were placed in the magnet for 2 min, and the supernatant was transferred to a new tube for further analysis. The beads and associated cells were discarded. Regarding CD4 depletion via microbeads, the cells were incubated with the microbeads for 10 min at 4 °C and then processed through an LD column (Miltenyi Biotec), yielding the CD8-enriched (CD4-depleted) population in the flow-through for subsequent analysis.
IFNγ ELISpot
Samples were processed into single-cell suspensions, followed by plating PBMCs or splenocytes into a 96-well round-bottom plate, each containing cells from an individual mouse in 200 μl of media. The cell quantities used were the following: two and a half million cells for splenocytes on day 21, three million cells for splenocytes on day 35, two million cells for PBMCs, eight and a half million cells for CD4 and CD8 enriched samples and two hundred thousand cells for full-length SARS-CoV-2 Spike DoriVac and mRNA–LNP assays. Each well was stimulated with 2 μg ml−1 of HR2 peptide or 1.67 μg ml−1 SARS-CoV-2 peptide pools (Miltenyl Biotec, 130-127-951, 130-132-051). For HR2 peptide experiments, after 48 h of incubation, cells were collected, resuspended in 100 μl of sterile media and plated onto an ELISpot plate (RND systems, Mouse IFNγ ELISpot kit, 505841) to incubate for 36 h at 37 °C. Cells from full-length SARS-CoV-2 Spike DoriVac and mRNA–LNP animal experiments were directly plated with stimulating peptides on an ELISpot plate and incubated for 20 h at 37 °C. The plate was then processed as per the manufacturer’s guidelines and analysed using an ELISpot plate reader at Dana Farber Cancer Institute’s Center for Immuno-oncology Translational Immunogenics Laboratory.
ELISA
Plasma IgG from vaccinated mice was quantified using an ELISA method. Nunc Maxisorp ELISA plates (ThermoFisher, 44-2404-21) were coated with HR2 peptide at a concentration of 2–20 µg ml−1 in 100 µl of coating buffer (100 mM bicarbonate/carbonate buffer, pH 9.5) and incubated overnight at 4 °C. After washing three times with washing buffer (PBS containing 0.05% Tween 20), 150 µl of blocking buffer (2% bovine serum albumin (Sigma, 9048-46-8) in washing buffer) was applied for 1 h at 37 °C. After removing the blocking buffer, 100 µl of plasma samples diluted in blocking buffer (1:100, 1:200, 1:400 dilutions) was added and incubated for 1 h at 37 °C. After washing three times with washing buffer, 150 µl of blocking buffer was applied for 1 h at 37 °C. After removing the blocking buffer, 100 µl of HRP-conjugated anti-mouse IgG antibody (Cell Signaling Technology, 7076) diluted in blocking buffer was applied for 1 h at 37 °C. After washing five times with washing buffer, 50 µl of 3,3′,5,5′-tetramethyl benzidine substrate (Sigma, 54827-17-7) for detection was added, and the reaction was stopped after 15 min by the addition of 50 µl of 1 M H2SO4. Absorbance at 450 nm was measured using an automated plate reader (BioTek).
Pseudovirus assay
Plasma was isolated by collecting the clear supernatant after centrifugation. Samples were diluted in culture media at varying ratios and cultured with the corresponding pseudovirus and ACE2-293 T cells. Relative pseudovirus infection level was assessed as the ratio of infected cells in each group to those in the bolus or the control group, which was assigned a relative infection level of 1.0.
SiMoA
Multiplexed SiMoA assays were used to measure anti-SARS-CoV-2 IgG antibodies against the S1 subunit of the spike protein, the full spike protein and nucleocapsid protein (control), as previously described70. The collected mouse serum samples were diluted 4,000-fold and analysed using an automated three-step assay format onboard an HD-X analyser (Quanterix). In the first step, the diluted serum samples are incubated with SARS-CoV-2 antigen-conjugated fluorescent beads. Then the beads are washed and incubated in a solution of 1 ng ml−1 biotinylated anti-mouse IgG antibody (Abcam, ab6788) in the second step. The beads are washed again and incubated in a solution of 30 pM of streptavidin-β-galactosidase in the third step. Afterwards, the beads are resuspended in a solution of resorufin β-d-galactopyranoside and loaded into a microwell array for analysis. Average enzyme per bead (AEB) values were calculated by the HD-X analyser and normalized between runs using a control solution of a neutralizing anti-spike mouse monoclonal antibody (Sino Biological, 40591-MM43) at a concentration of 5 pg ml−1.
Assay for anti-dsDNA and anti-PEG IgG
Anti-dsDNA and anti-PEG IgG levels were measured using the Mouse Anti-dsDNA IgG ELISA Kit (catalogue number 5120, Alpha Diagnostic International) and the Mouse Anti-PEG IgG ELISA Kit (catalogue number PEG-030, Alpha Diagnostic International), respectively. Both assays were performed according to the manufacturers’ protocols. Briefly, all kit-provided calibrators, samples and positive controls were assayed in duplicate. Serum samples were diluted 1:100 in the supplied sample diluent, consistent with the recommended dilution of ≥1:100. After appropriate incubations and washes, the bound IgGs were detected with an anti-mouse IgG–HRP conjugate followed by TMB substrate development and measurement of optical density at 450 nm with normalization at 630 nm. Data analysis was carried out according to the manufacturers’ guidelines for each kit.
SARS-CoV-2 spike-specific immunoglobulin quantitation in LN chip outflows
Anti-SARS-CoV-2 IgG concentrations were determined in day 14 LN chip outflows via the 10-PLEX MSD V-PLEX SARS-CoV-2 Spike Panel 27 (IgG) Kit (K15606U). Assays were performed according to the manufacturer’s specifications. Briefly, LN chip outflows were tested in duplicate at 1:10, 1:70 and 1:490 dilutions, with samples incubated on plates pre-coated with spike antigens from multiple SARS-CoV-2 variants (n = 10); antibody binding was detected with SULFO-Tag-labelled anti-human IgG antibody. Data were acquired with an MSD Meso Sector S 600MM plate reader and analysed with MSD Discovery Workbench 4.0 software. Sample antibody concentrations (arbitrary units per millilitre (a.u. ml−1)) were calculated against the kit-provided standard (using four-parameter logistic regression), reporting data from the dilution nearest to the midpoint of the curve. Concentrations are reported for Wuhan and BA.5 spike variants in Fig. 6f, with data from additional variants reported in Supplementary Fig. 13, including B.1.351 (beta variant), B.1.617.2; AY.4 Alt Seq 2 (delta variant), BA.2, BA.2.12.1, BA.2 + L452M, BA.2 + L452R, BA.3 and BA.4 (Omicron sublineage variants). Three positive controls, containing known levels of SARS-CoV-2-specific IgG, were included in the kit and tested to confirm assay performance. CH65 IgG human monoclonal antibody88, specific to influenza receptor binding site haemagglutinin glycoprotein, served as a negative control.
Statistical analyses
One-way or two-way analysis of variance (ANOVA) or unpaired t-test(s) with appropriate corrections for multiple comparisons as detailed in the figure captions was applied to determine the statistical significance of all flow, ELISpot and ELISA data in Figs. 2–7. GraphPad Prism 10 was used to make graphs, analyse statistics and calculate P values. P ≤ 0.05 was considered statistically significant; *P ≤ 0.05; **P ≤ 0.01; ***P ≤ 0.001; ****P ≤ 0.0001. Error bars represent standard deviation (s.d.).
Reporting summary
Further information on research design is available in the Nature Portfolio Reporting Summary linked to this article.