
Endotoxemia is associated with an increase in proinflammatory ATMs in old mice
Older individuals exhibit increased lethality, cytokine storm and impaired metabolic responses to sepsis and endotoxemia, partly mediated by immune cell crosstalk within VAT5,28. To address whether the increase in inflammation is associated with a change in macrophage phenotype, we investigated the phenotype of ATMs at 4 h after administering phosphate-buffered saline (PBS) or 0.1 mg kg−1 lipopolysaccharide (LPS) via intraperitoneal (i.p.) injection to young or old wild-type (WT) mice5 (Fig. 1a, left). Consistent with previous studies5, old mice failed to maintain core body temperature (BT) with this low-dose LPS challenge (Extended Data Fig. 1a, right). CD11c was initially used as a representative marker for inflammatory phenotypes. Post LPS injection, CD11c+ ATMs (%) expanded in old mice, whereas it remained unchanged in young mice (Fig. 1b and Extended Data Fig. 1a,b). To further characterize CD11c+ ATMs, we analyzed multiple markers generally used to define macrophage phenotypes: CD11c, CD9, MHCII and CD206. The t-distributed stochastic neighbor embedding (tSNE) plot shows that ATMs are a heterogeneous population with varying combinations of markers (Fig. 1c). Notably, CD11c+ and CD206+ ATMs, commonly categorized as proinflammatory and anti-inflammatory ATMs, represent distinct populations. MHCII and CD9 were expressed on CD11c+ ATMs, further supporting CD11c as a marker for inflammatory ATMs29. These data collectively indicate that low-dose LPS exacerbates the imbalance of heterogeneous inflammatory CD11c+ ATMs in an age-dependent manner. To further investigate the phenotype of VAT immune cells, we utilized a single-cell RNA sequencing (scRNA-seq) dataset (GSE274935) containing VAT CD45+ immune cells sorted from young and old mice that were challenged with low-dose LPS. Young and old VAT immune cells were analyzed together, and a total of 23 clusters were identified, including 4 clusters of ATMs (Fig. 1d and Extended Data Fig. 2a). The proportions of each ATM cluster were altered during aging. Whereas ATM2 and ATM3 clusters expanded with age, the ATM1 cluster declined (Fig. 1e). The expanding ATM clusters exhibited higher expressions of Itgax (CD11c), Cd9 and MHCII-associated gene (H2-Ab1), while showing a lower expression of Mrc1 (CD206) and Lyve1 (Fig. 1f and Extended Data Fig. 2b). These characteristics are comparable to those of inflammatory CD11c+ ATMs identified by flow cytometry (Fig. 1c). These clusters also exhibit higher expression of Gdf3 compared with other ATM clusters, suggesting that inflammatory ATMs are the primary source of Gdf3. Notably, Gdf3 expression was particularly enriched in the Itgaxlow ATM3 cluster rather than in Itgaxhigh ATM2, supporting the notion of heterogeneity among CD11c+ ATMs.

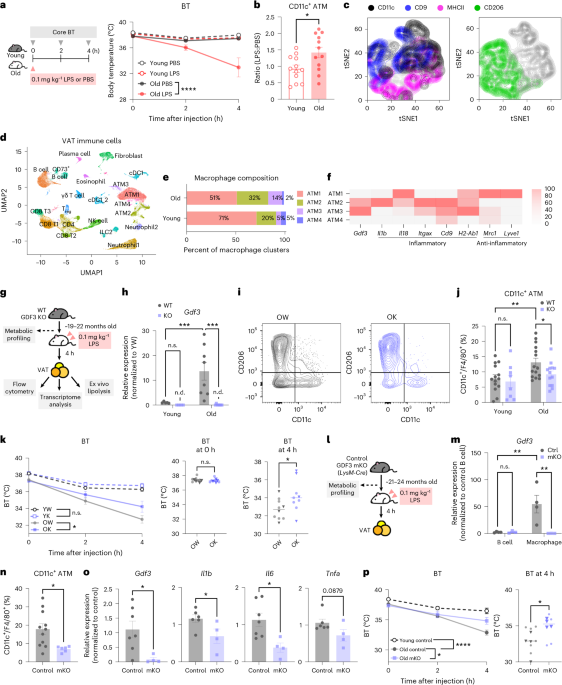
a, Left: a schematic of the experimental design. Right: the core BT of young (3-month-old) or old (22-month-old) female WT mice after i.p. injection of 0.1 mg kg−1 LPS or PBS. n = 3 per group. b, The ratio of CD11c+ ATMs (% of CD11c+ ATMs from the LPS-injected group normalized to the PBS-injected group, all female mice). c, The tSNE plot of compiled F4/80+ ATMs in VAT from 24-month-old female WT mice (n = 5) injected with 0.1 mg kg−1 LPS; 1,000 iterations, 30 perplexities. The left axis shows tSNE2, and the bottom axes show tSNE1. d, The UMAP of VAT immune cells (CD45+ cells) from young (3-month-old, n = 2) or old (21-month-old, n = 3) female WT mice injected with 0.1 mg kg−1 LPS showing 23 clusters. e, The proportion of each ATM cluster (% of all young or old ATMs). f, The expressions of genes associated with macrophage phenotype to compare ATM clusters (ATM1, ATM2, ATM3, ATM4), normalized across all ATM clusters. g–k, Young (3–4-month-old) or old (19–22-month-old) female WT or GDF3 KO mice injected with 0.1 mg kg−1 LPS: a schematic of the experimental design (g); the gene expression of Gdf3 in VAT (h); young WT (YW), n = 5; young KO (YK), n = 5; old WT (OW), n = 8; old KO (OK), n = 8; the representative gating strategy for CD11c+ and CD206+ ATMs in VAT from OW (left) or OK (right) mouse (i); the frequency of CD11c+ ATMs (j); YW, n = 14; YK, n = 8; OW, n = 15; OK, n = 14; and mean core BT after LPS injection (k); YW, n = 14; YK, n = 8; OW, n = 8; OK, n = 8. The circle and triangle symbols represent the two independent experiments. For i, the left axis shows CD206, and the bottom axes show CD11c. l, A schematic of the experimental design. m, The gene expression of Gdf3 in positively selected B cells from spleen and peritoneal macrophages, all female mice. Control, n = 4; mKO, n = 3. n–p, Young (4-month-old) or old (21- to 24-month-old) female control or mKO mice were injected with 0.1 mg kg−1 LPS: the frequency of CD11c+ ATMs in VAT from old control (n = 11) or mKO mice (n = 6) (n); the inflammatory cytokine gene expression in VAT from old control (n = 6) or mKO mice (n = 4) (o); and the mean core BT after LPS injection (p), young control, n = 8; old control, n = 11, old mKO, n = 8. The circle and triangle symbols represent the two independent experiments. All data are presented as means ± s.e.m. *P < 0.05, **P < 0.01, ***P < 0.001, ****P < 0.0001. All in vivo experiments were repeated independently at least twice. See Extended Data Figs. 1–3 for more details. NK, natural killer; n.s., not significant; n.d., nondetected; Treg, regualtory T cell;.
Source data
Old Gdf3-deficient mice are protected from endotoxemia-induced inflammation
GDF3 is implicated in age-related adipose tissue inflammation and affects the severity or risk for multiple diseases9,10,12,14,15,21,30. We next asked whether the lifelong deficiency of Gdf3 would alter the endotoxemia-related inflammatory state of ATMs from old mice (Fig. 1g). To address this question, we generated mice with a whole-body deletion of Gdf3. We first validated the deletion of Gdf3 in VAT from young (3–4-month-old) or old (19–22-month-old) WT or Gdf3 whole-body knockout (KO) mice. A significant age-related increase in Gdf3 expression was ablated in old KO mice (Fig. 1h). To investigate the impact of lifelong Gdf3 deletion on metabolic function before endotoxic shock, we monitored various metabolic parameters, including body weights, body composition, insulin sensitivity and glucose sensitivity. However, we only observed an age effect without a genotype effect (Extended Data Fig. 1c–f). Genes related to fatty acid oxidation or synthesis also showed no differences in adipocytes isolated from VAT (Extended Data Fig. 1g). Taken together, lifelong Gdf3 deficiency has no impact on metabolic dysfunction.
Next, we assessed the impact of lifelong Gdf3 deficiency on the VAT immune cell activation and ATMs’ phenotype during endotoxemia. T cells, B cells and myeloid cells, including ATMs, exhibited the expected age-related changes in frequency (Extended Data Fig. 1h). However, no genotype effect was observed in this overall immune composition (Extended Data Fig. 1h). Next, we examined the inflammatory profile of ATMs (Fig. 1i). Notably, the deletion of Gdf3 resulted in a decreased frequency of CD11c+ ATMs, whereas CD206+ ATMs remained unaffected (Fig. 1j and Extended Data Fig. 1i). In the spleen, no differences in immune composition were observed between old WT and KO mice, indicating that the effect of Gdf3 is primarily within VAT (Extended Data Fig. 1j).
The impaired lipolysis upon aging leads to dysregulated immune response5. As GDF3 can regulate adipocyte lipolysis, we measured the free fatty acids released from VAT explants9,12,16,22. VAT explants from old KO mice exhibited improved stimulated-lipolytic capacity compared with their old WT counterparts (Extended Data Fig. 1k). Next, we assessed the severity of endotoxemia by monitoring the core BT at 0, 2 and 4 h post LPS injection. Although there were no differences in core BT in young WT and KO mice, old WT mice exhibited a greater reduction in BT compared with old KO mice (Fig. 1k). Taken together, these results suggest that GDF3 mediates endotoxemia-induced inflammation in old mice by regulating the inflammatory phenotype of ATMs, lipolysis and hypothermia.
To address how GDF3 induces the expansion of CD11c+ macrophages, we investigated whether this increase occurs via proliferation or infiltration. As GDF3 promotes the proliferation of various cell types10,20, we first hypothesized that the expansion of CD11c+ ATMs was dependent on GDF3-regulated proliferation. To perform an in vivo cell proliferation study, young (4-month-old) and old (24-month-old) WT mice were i.p. injected with 5-ethynyl-2′-deoxyuridine (EdU, 25 mg kg−1) for four consecutive days, followed by PBS or 0.1 mg kg−1 LPS injection31 (Extended Data Fig. 1l). The cell proliferation was assessed by quantifying incorporation of EdU into DNA by flow cytometry (Extended Data Fig. 1m). The frequency of EdU+CD11c+ ATMs was elevated 1.7 fold with LPS injection in old mice, whereas it remained unchanged in young mice (Extended Data Fig. 1n). Next, WT and KO mice were injected with EdU (Extended Data Fig. 1o, left). Although EdU+CD11c+ ATMs were elevated with aging, no differences between old WT and KO mice were observed (Extended Data Fig. 1o, right). Monocytes can infiltrate into VAT and differentiate into inflammatory macrophages32. To investigate whether GDF3 influences the infiltration of monocytes, we used the CCR2 as a marker for infiltrating monocytes33. Although the frequency of CCR2+ ATMs increased with age, we found no differences between old WT and KO mice (Extended Data Fig. 1p). Collectively, our data demonstrate that GDF3 induces the inflammatory phenotype of ATMs independently of proliferation or infiltration, despite both being crucial for maintaining CD11c+ ATMs during endotoxemia in old mice.
Gdf3 is not required for LPS-induced lethality in young mice
We next asked whether the protective function of Gdf3 is exclusive to old mice. Young WT and KO mice (aged 4–6 months old) were injected with a lethal dose of LPS34 (18 mg kg−1) and monitored for 6 h post LPS administration (Extended Data Fig. 3a). The core BT, immune cell composition, lymphocyte activation and inflammatory gene expression remained unaltered in young mice regardless of the presence of Gdf3, indicating that Gdf3 does not play a role in severe inflammatory responses in young mice (Extended Data Fig. 3b–e). Following a previously established GDF3 treatment regimen, the young mice were administered with recombinant GDF314 (rGDF3, 10 µg kg−1) before the lethal dose of LPS (Extended Data Fig. 3f). However, rGDF3 did not protect mice against hypothermia and VAT inflammation (Extended Data Fig. 3f). These findings suggest that the beneficial effect from Gdf3 deletion against severe inflammatory responses is specific to old mice.
To broadly address the age-related alterations in expression of Gdf3 and its family members, we first compared the gene expression of selected Tgfb-associated genes. In line with our observations (Fig. 1h), Gdf3 increased with age in VAT. Consistent with previous reports, Gdf15 was elevated but not statistically significant. There were no differences detected in other genes from the TGFβ family (Extended Data Fig. 3g). Moreover, Gdf3 expression was elevated in multiple organs of old mice, with the highest expression observed in the VAT, liver and thymus (Extended Data Fig. 3h). Lifelong B cell deficiency improves the aged VAT microenvironment by reducing inflammatory ATMs5,35. Notably, old Bnull mice exhibited reduced Gdf3 and Tgfb1 but not Gdf15 expression compared with old WT mice (Extended Data Fig. 3i). These findings suggest that Gdf3 is highly expressed in VAT and increases in a B cell-dependent manner during aging.
Myeloid-driven Gdf3 is required for endotoxemia-induced cytokine storm, inflammatory macrophages and hypothermia
As Gdf3 may be expressed in multiple cell types, we investigated its myeloid-driven function by generating and validating Gdf3 myeloid-specific KO (mKO) mice. Macrophages from the peritoneum exhibited a reduction of Gdf3 expression in mKO group. By contrast, B cells showed comparable levels of Gdf3 expression between control and mKO mice, confirming the myeloid-specific deletion of Gdf3 (Fig. 1l,m). Although old mKO mice showed no differences in body weights, they showed improved glucose sensitivity when compared with control mice (Extended Data Fig. 3j–m).
Next, we predicted that myeloid-driven Gdf3 is required for the inflammatory phenotype of macrophages during endotoxemia. At 21–24 months of age, control and mKO mice were given 0.1 mg kg−1 LPS (Fig. 1l). ATMs from the old mKO group showed a significant reduction in the frequency of CD11c+ ATMs (Fig. 1n). There was also a significant decrease in CD9+ ATMs, a slight increase in CD206+ and no change in CCR2+ ATMs (Extended Data Fig. 3n–p). The decreased frequency in CD11c+ macrophages was also seen in the subcutaneous adipose tissue, indicating the conserved function of Gdf3 across the white adipose depots (Extended Data Fig. 3q). The Gdf3 expression was significantly reduced in mKO VAT, indicating that myeloid cells are the main contributors of Gdf3 to the tissue (Fig. 1o). The inflammatory cytokine gene expression (Il1b, Il6, Tnfa) also decreased in the VAT from old mKO mice (Fig. 1o). Moreover, the stimulated-lipolytic capacity of VAT explants was improved with the myeloid-specific deletion of Gdf3 (Extended Data Fig. 3r).
In aged VAT, B cells regulate adipose tissue homeostasis. They contribute to elevated inflammation by modulating other immune cells, including ATMs, and by inhibiting stimulated lipolysis5,36. We asked if altered ATMs would affect B cells. To characterize B cells, we used IgD, IgM, programmed cell death ligand 1 (PDL1) and CD73 as phenotypic markers for dysfunctional B cells in aged VAT (Extended Data Fig. 3t). Markedly, both IgM+CD73+ and PDL1+ B cells, representing memory B cells and regulatory B cells, respectively5,37, were decreased in old mKO mice (Extended Data Figs. 3u,v). Collectively, this suggests that Gdf3 can modulate dysfunctional B cells in aging VAT.
During endotoxemia, old control mice developed hypothermia with 13% BT loss, whereas old mKO mice had significantly increased BT at 4 h post endotoxemia, showing 7% BT loss (Fig. 1p). This was also observed in male mKO mice that displayed improved glucose sensitivity and fewer CD11c+ ATMs during endotoxemia, demonstrating a conserved function of Gdf3 across sexes (Extended Data Fig. 3l,m,s,w). Taken together, our findings suggest that the lifelong myeloid-specific deletion of Gdf3 results in improved glucose sensitivity, reduced CD11c+ ATMs, improved lipolytic capacity, decreased inflammatory gene expression and protection from BT loss post LPS challenge.
BRD4-controlled Gdf3 regulates endotoxemia-induced inflammation
Next, we wanted to examine if the acute depletion of Gdf3 could alleviate inflammation. Bromodomain and extra terminal domain 4 (BRD4), a transcriptional and epigenetic regulator, binds to the promoter and enhancer regions of Gdf3 and facilitates the transcription of Gdf3 in obesity38. To first assess whether the expression of Gdf3 is regulated by BRD4 in older organisms, we utilized JQ1, a small molecular inhibitor of BRD439. At 23–24 months of age, the mice were intraperitoneally injected with JQ1 (12.5 mg kg−1) or vehicle for six consecutive days, followed by a 0.1 mg kg−1 LPS injection (Fig. 2a). The acute administration of JQ1 reduced VAT Gdf3 levels without affecting body weights (Fig. 2b and Extended Data Fig. 4a). We next tested whether the acute depletion of Gdf3 would have similar effects on macrophage phenotypes to those observed with a lifelong deletion of Gdf3. Although the composition and cellularity of overall immune cells in VAT were not affected by JQ1 (Extended Data Figs. 4b,c), the composition of ATMs was altered. Specifically, the frequency of CD11c+ ATMs decreased, whereas the frequency of CD206+ ATMs trended toward an increase (Fig. 2c). The frequency of CCR2+ ATMs remained unaffected (Fig. 2d). The inflammation-associated genes were reduced in VAT (Fig. 2e and Extended Data Fig. 4d). In line with the observed changes in B cell phenotypes resulting from lifelong myeloid-specific Gdf3 deficiency, PDL1+ B cells decreased following the JQ1 injection (Extended Data Fig. 4e). However, the frequency of CD73+ B cells was not affected (Extended Data Fig. 4f). At a systemic level, the JQ1-injected old mice were protected from hypothermia compared with controls (Fig. 2f).

a–f, Old (23–24-month-old) female WT mice were intraperitoneally injected with JQ1 (12.5 mg kg−1) or vehicle and LPS (0.1 mg kg−1): vehicle-injected, n = 10; JQ1-injected, n = 11; a schematic of the experimental design (a); the Gdf3 expression in VAT (b); the frequency of CD11c+, CD206+ (c) and CCR2+ (d) ATMs in VAT; the inflammatory gene expression in VAT (e); and the mean core BT after LPS injection (f). g,h, The BMDMs isolated from old (24-month) female WT mice were treated with LPS (1 µg ml−1) 4 h before vehicle or JQ1 (1 µM) treatment: a schematic of the experimental design (g) and the Gdf3 and Il1b expression in BMDMs (h). i, The pSMAD2/3, total SMAD2/3 (tSMAD2/3) and β-actin by western blot of whole VAT from young (3-month-old) or old (24-month-old) female WT and GDF3 KO mice injected with 0.1 mg kg−1 LPS. The pSMAD2/3, tSMAD2/3 and β-actin were run on separate gels. j, The fibrotic gene expression in VAT from old control (n = 5) and old mKO (n = 5) male mice injected with 0.1 mg kg−1 LPS. The dotted line represents the young control. k, The quantification of pSMAD2/3 normalized to Ponceau S staining of SVF or adipocytes from young (3-month-old) and old (22-month-old) female WT mice injected with 0.1 mg kg−1 LPS (Extended Data Fig. 5a). l, The MFI of pSMAD2/3 in T cells, B cells and ATMs in VAT from old (24-month-old) female WT mice (n = 3). m, The pSMAD2/3 MFI in CD11c+ or CD11c− ATMs from young (4-month-old) and old (23-month-old) female WT mice. Young, n = 3; old, n = 8. n–p, The positively selected ATMs from VAT of old (24-month-old, n = 6) female WT mice were treated with vehicle or rGDF3 (20 ng ml−1) in vitro: a schematic of the experimental design (n), pSMAD2/3 MFI in CD11c+ or CD206+ ATMs (o) and the frequency of CD11c+ ATMs (p). All the data are presented as means ± s.e.m. *P < 0.05, **P < 0.01, ***P < 0.001, ****P < 0.0001. See Extended Data Figs. 4 and 5 for more details. n.s., not significant.
Source data
To directly test the impact of JQ1 on macrophages, we utilized bone marrow-derived macrophages (BMDMs). BMDMs generated from marrow of old mice were pretreated with LPS (1 µg ml−1) 4 h before the vehicle or JQ1 (1 µM) treatment (Fig. 2g). Consistent with in vivo results, JQ1 reduced Gdf3 and Il1b expression in vitro (Fig. 2h). A similar phenotype was observed in BMDMs without LPS (Extended Data Figs. 4h,i). Collectively, these data indicate that the acute depletion of Gdf3 via BRD4 inhibition phenocopies the lifelong deletion of Gdf3 in old mice.
GDF3 induces phosphorylation of SMAD2/3 to promote inflammatory phenotype of ATMs during aging
Previous studies have demonstrated that GDF3 can activate SMAD2/3 signaling via phosphorylation20,38. We wanted to test if the age-related increase in phospho-SMAD2/3 (pSMAD2/3) requires GDF3. pSMAD2/3 levels were similar in in VAT from young WT and KO mice but were reduced in old KO mice compared with old WT mice (Fig. 2i). The SMAD2/3 signaling promotes fibrosis in multiple tissues including AT35. However, the expression levels of SMAD2/3 downstream fibrotic genes (Fn1, Col1a1, Mmp2, Serpine1) showed no differences between old control and mKO VAT (Fig. 2j). Considering the cellular heterogeneity of VAT, we sought to identify which cell types express pSMAD2/3. The whole VAT from young and old WT mice was separated into adipocyte fraction and stromal vascular fraction (SVF), which includes the immune cells. Interestingly, both the adipocyte fraction and SVF showed increase in pSMAD2/3 and GDF3 with age (Fig. 2k and Extended Data Fig. 5a–c). Next, phospho-flow cytometry was used to identify the immune cells with elevated pSMAD2/3 expression. The pSMAD2/3 expression, represented by the mean fluorescence intensity (MFI), was highest in ATMs compared with B cells and T cells from aged VAT (Fig. 2l). Moreover, we observed an age-dependent elevation in pSMAD2/3 levels specifically within CD11c+ ATMs, whereas CD11c− ATMs showed no significant changes (Fig. 2m).
To directly examine if GDF3 can induce phosphorylation of SMAD2/3 in macrophages, we used an in vitro system with BMDMs and ATMs (Fig. 2n and Extended Data Fig. 5d–k). First, young and old BMDMs were treated with vehicle or rGDF3 (20 ng ml−1). At baseline, pSMAD2/3 was higher in old BMDMs compared with young BMDMs (Extended Data Fig. 5e). The rGDF3 treatment increased pSMAD2/3 in old BMDMs, but not young, and decreased the frequency of CD206+ BMDMs (Extended Data Fig. 5d–f). In LPS-pretreated old BMDMs, rGDF3 increased the frequency of CD11c+ BMDMs without affecting CD206 frequencies (Extended Data Fig. 5g–i). For a more physiologically relevant in vitro model, we positively selected ATMs from young and old SVF (Fig. 2n). Consistent with BMDMs, only old ATMs showed an increased pSMAD2/3 in response to rGDF3 (Extended Data Fig. 5j–l). Similar to the increase that is induced by natural aging, CD11c+ ATMs from old mice exhibited a higher basal level of pSMAD2/3 than CD206+ ATMs in vitro (Fig. 2o). Both the CD206+ and CD11c+ ATMs showed increased pSMAD2/3 following rGDF3 treatment, but CD11c+ ATMs exhibited a more robust response with higher pSMAD2/3 MFI (Fig. 2o). In addition, rGDF3 treatment increased the frequency of CD11c+ ATMs (Fig. 2p). Taken together, our data demonstrate that GDF3 increases pSMAD2/3 and promotes the inflammatory phenotype of macrophages from old mice.
Inhibition of SMAD3 results in reduced inflammatory macrophages and hypothermia during endotoxemia
We next hypothesized that SMAD2/3 is required for inflammatory responses with age. To test this, young (4-month-old) and old (23-month-old) WT mice were injected with a specific inhibitor for SMAD3 (SIS3, three times a week, 10 mg kg−1) for 4 weeks and challenged with 0.1 mg kg−1 LPS40 (Fig. 3a). SIS3 effectively dampened pSMAD2/3 MFI and pSMAD2/3+ myeloid cells and ATMs from old mice (Fig. 3b–d). However, SIS3 had no effect on lymphocytes (gated based on size), which exhibited a lower frequency of pSMAD2/3+ cells than myeloid cells (Fig. 3b). Canonical SMAD2/3 target genes (Fn1, Serpine1) were downregulated in SIS3-injected young mice compared with vehicle controls. Interestingly, this effect was absent in old mice, suggesting that SMAD2/3 may regulate a different set of genes during aging (Fig. 3e,f).

A, A schematic of the experimental design. b,c, The frequency of pSMAD2/3+ cells (b) and pSMAD2/3+ ATMs (c) in VAT from old mice. Old vehicle (OV), n = 5; old SIS3 (OS), n = 7. d, The pSMAD2/3 MFI of ATMs from old mice. OV, n = 5; OS, n = 7. e,f, The fibrotic gene expression (Fn1 (e), Serpine1 (f)) in VAT (young vehicle (YV), n = 5; young SIS3 (YS), n = 6; OV, n = 6; OS, n = 7). g–i, The body weights (g), glucose sensitivity (h) and insulin sensitivity (i) of vehicle- and SIS3-injected old mice. j–l, The frequency of immune cells (j), CD11c+ ATMs, CD206+ ATMs (k) and CD9+ ATMs (l) in old VAT. m, The VAT gene expression involved in inflammation. YV, n = 6; YS, n = 6; OV, n = 5; OS, n = 5. n, The frequency of PDL1+ B cells in VAT. YV, n = 7; YS, n = 7; OV, n = 11; OS, n = 11. o, The mean core BT of old mice 4 h post LPS injection. OV, n = 11; OS, n = 11. In a–o, young (4-month-old) and old (23-month-old) female WT mice were intraperitoneally injected with SIS3 (10 mg kg−1, three times a week) or vehicle and LPS (0.1 mg kg−1) 4 h before the end point. YV, n = 7; YS, n = 7; OV, n = 11; OS, n = 11. p–r, Old (20-month-old) female WT mice were injected with SIS3 or vehicle as shown above and 3 mg kg−1 LPS: a schematic of the experimental design (p), the body weight loss (normalized to the 0 h time point) after the LPS injection (q) and the survival rate after LPS injection (r). s, The correlation between human VAT GDF3 level and age. t, The correlation between human VAT pSMAD2/3 level and inflammatory cytokine gene expression. All data are presented as means ± s.e.m. *P < 0.05, **P < 0.01, ***P < 0.001, ****P < 0.0001. All in vivo experiments were repeated independently twice. n.s., not significant. See Extended Data Fig. 6 for more details.
The acute blockade of SMAD3 signaling was shown to protect mice from diabetes and obesity with improved insulin or glucose sensitivity26. We asked if SIS3 could reverse age-related metabolic dysfunction. However, a month-long blockade of SMAD3 had no effect on body weight, glucose sensitivity and insulin sensitivity in old mice (Fig. 3g–i). We next investigated whether SIS3 could reduce inflammatory responses in old mice, akin to phenotypes observed in Gdf3-deleted or JQ1-injected old mice. Although the overall immune composition remained unchanged, SIS3 treatment reduced CD11c+ and CD9+ ATMs and trended toward increased CD206+ ATMs in old mice (Fig. 3j–l). SMAD3 inhibition also reduced inflammatory cytokine gene expression (Tnfa, Il1b) only in old mice (Fig. 3m). Consistent with the effects of Gdf3 genetic deletion, the PDL1+ B cells were reduced in SIS3-injected old mice (Fig. 3n). Systemically, SMAD3 inhibition protected old mice from significant core BT loss observed 4 h post LPS injection (Fig. 3o). Taken together, SMAD2/3 promotes hyperinflammatory responses in an age-specific manner during endotoxemia. Next, we tested whether SMAD3 blockade could reduce mortality in lethal LPS-induced endotoxemia34 (3 mg kg−1; Fig. 3p). Body weight loss, a noninvasive indicator of disease severity, was partially prevented in SIS3-treated old mice compared with vehicle controls (Fig. 3q). The SMAD3 blockade also improved survival, although not statistically significantly, in response to lethal endotoxemia (Fig. 3r).
A reduced SMAD3 expression has been associated with longevity in humans41. Consistent with our observations in mouse models, GDF3 expression positively correlated with age in human VAT biopsies from bariatric surgeries (body mass index (BMI) >30; Fig. 3s). Moreover, pSMAD2/3 positively correlated with IL1B but not TNF expression particularly in individuals aged over 60 years (Fig. 3t). We also utilized the data from the atherosclerosis risk in communities (ARIC) study42 to investigate the correlation between GDF3 and age-associated inflammation at a systemic level. The ARIC cohort includes 15,792 middle-aged participants (45–64 years old) who were followed longitudinally and took part in multiple clinic visits42. Notably, higher serum GDF3 levels were significantly associated with elevated level of C-reactive protein (CRP), a marker of systemic inflammation, at both visits 2 (midlife, median age 57 years, N = 11,084) and 5 (late-life, median age 76 years, N = 4,985. Extended Data Fig. 6a). After adjusting for demographics, education level and BMI, participants in the highest GDF3 quintile had 15% (β (95% confidence intervals (CI)): 1.15 (1.09–1.22)) higher CRP levels compared with those in the lowest GDF3 quintile at midlife (Extended Data Fig. 6b). This association was more pronounced at late-life, where the highest GDF3 quintile group exhibited 39% (β (95% CI): 1.39 (1.27–1.53)) higher CRP levels (Extended Data Fig. 6b). These findings underscore the link between GDF3 and age-associated inflammation in humans and support the therapeutic potential of targeting the GDF3–SMAD2/3 axis.
Gdf3 regulates chromatin accessibility and enriches SMAD4-regulated transcription
SMAD2/3 TFs have low DNA binding affinity for a specific consensus sequence, allowing them to elicit anti- or proinflammatory responses depending on the cellular context24,25,26. Genes associated with proinflammatory processes in immune cells, including myeloid cells, exhibit increased chromatin accessibility with age43. Moreover, SMAD2/3 can regulate chromatin accessibility through recruitment of chromatin/epigenetic modifiers27. We thus hypothesized that GDF3–SMAD2/3 axis could regulate chromatin accessibility and promote inflammation in ATMs with age. To assess chromatin accessibility, ATMs isolated via fluorescence-activated cell sorting (FACS) from young control, old control and old mKO mice were profiled using assay for transposase-accessible chromatin with sequencing (ATAC-seq; Fig. 4a and Extended Data Fig. 7a,b). The data quality was validated by the enrichment of ATAC-seq reads around transcription start sites (TSS) and the genomic distribution pattern of identified peaks (Extended Data Fig. 7c,d). A differential peak analysis between young and old control ATMs identified 4,680 peaks with increased accessibility and 1,011 peaks with decreased accessibility, revealing an age-specific chromatin landscape marked by widespread chromatin opening (Fig. 4b and Supplementary Table 1). Hierarchy clustering analysis further demonstrated distinct open and closed chromatin patterns between young and old ATMs (Fig. 4c). We next compared old ATMs with or without Gdf3. Interestingly, the majority of peaks were closing (n = 3,247) in old ATMs without Gdf3 (Fig. 4d). A clustering analysis also revealed distinct patterns (Fig. 4e). Out of 3,247 closing peaks with Gdf3 deletion, 50% (n = 1627) overlapped with opening peaks with aging (Extended Data Fig. 7e). A pathway enrichment analysis using the Kyoto Encyclopedia of Genes and Genomes (KEGG) and gene ontology (GO) identified several pathways associated with differentially accessible peaks across age or genotype. Age-related opening peaks were enriched in extracellular matrix (ECM)–receptor interaction, Th17 cell differentiation, AGE–RAGE signaling complication, Rap1 signaling, PI3K–Akt signaling, cytokine–cytokine receptor interaction and calcium signaling pathways (KEGG; Fig. 4f). Remarkably, several age-enriched pathways overlapped with those associated with decreased accessibility in mKO ATMs (Fig. 4g). These included the ECM–receptor interaction and Rap1 signaling pathway, previously implicated to be enriched with aging44,45.

a, A schematic of the experimental design. b,c, The differentially accessible peaks between old and young control ATMs represented by a log2 fold change (log2FC) plot (b) and hierarchy clustering heat map (c). For the log2FC plot, differentially opening and closing peaks are shown in red and blue, respectively. d,e, The differentially accessible peaks between old mKO and old control ATMs represented by a log2FC plot (d) and hierarchy clustering heat map (e). f,g, The KEGG pathway analysis of opening peaks with age (f) (old versus young control) and closing peaks with Gdf3 deletion (g) (old mKO versus old control). h,i, The prediction of TF-binding motifs enriched in the promoters of opening peaks with age (h) and closing peaks with Gdf3 deletion (i). TFs of interests are underlined. j, The IGV genome browser tracks that show chromatin accessibility of Il1r1 (left) and Il18r1 (right) in ATMs. In a–j, young (4-month-old, n = 3) or old (21–24-month-old) female control (n = 3) or mKO (n = 3) mice were injected with 0.1 mg kg−1 LPS. The TSS are highlighted with boxes. See Extended Data Fig. 7 for more details.
Next, a footprinting analysis was utilized to predict the potential TFs bound to accessible chromatin. An analysis of all identified ATAC-peaks revealed CTCF, PU.1 and JUN as the most prevalent TFs across all groups, irrespective of age or genotype (Extended Data Fig. 7h), indicating that the core TFs in ATMs remain largely unchanged. To investigate further, we predicted TFs associated with differentially accessible peaks using ShinyGO, a publicly available graphical gene set enrichment tool46. A predictive analysis highlighted SMAD4 as the TF most enriched at opening peaks upon aging and, similarly, at closing peaks upon Gdf3 deletion in old ATMs (Figs. 4h,i). Importantly, SMAD4 is required for SMAD2/3 to translocate into nucleus and initiate transcription, indicating a specific link between GDF3 and SMAD signaling in chromatin remodeling47. We observed an increased chromatin accessibility around the TSS of inflammatory cytokine receptors, Il1r1 and Il18r1, in old ATMs (Fig. 4j). Conversely, these regions became less accessible in old ATMs without Gdf3. A chromatin immunoprecipitation-enrichment analysis48 indicates that Il1r1 and Il18r1 are SMAD4-transcribed genes, suggesting a direct link between GDF3–SMAD chromatin remodeling and inflammation-associated transcriptional changes in ATMs.
The SMAD complex can regulate transcription through interactions with epigenetic cofactors27. Among the TFs enriched in both the age-dependent opening peaks and Gdf3-depedent closing peaks, SUZ12 was identified (Figs. 4h,i). SUZ12 is a key component of polycomb repressive complex 2 (PRC2), which represses gene transcription by methylating histone H3 at lysine 27 (H3K27me3). Taken together, these findings suggest that the GDF3–SMAD axis, possibly in conjunction with PRC2-mediated H3K27me3 levels, regulates chromatin remodeling and transcriptional changes in aged ATMs.
Lifelong Gdf3 deficiency reduces inflammatory ATMs by promoting chromatin remodeling and methylation signature
The loss of repressive histone mark H3K27me3 increases chromatin accessibility and promotes the transcription of inflammatory genes49. To assess age- or endotoxemia-related changes, we quantified H3K27me3 levels in VAT immune cells using flow cytometry. H3K27me3 levels in total ATMs and CD11c+ ATMs significantly decreased with age but remained unchanged following LPS treatment (Fig. 5a and Extended Data Fig. 8a), suggesting that age-dependent chromatin remodeling in ATMs occurs independently of acute inflammatory stimuli. SMAD2/3 can integrate epigenetic processes into transcription regulation by recruiting histone demethylase that counteracts the PRC2-mediated gene repression via H3K27me327,50. We therefore hypothesized that aging and GDF3 affect chromatin remodeling through the loss of H3K27me3. To determine if GDF3 influences H3K27me3 levels under basal conditions, we measured H3K27me3 in ATMs from unchallenged old (21–23-month-old) WT and GDF3 KO mice. Notably, H3K27me3 levels increased in both total ATMs and CD11c+ ATMs from KO mice (Fig. 5b), despite only a trend toward a reduction in CD11c+ ATMs (Fig. 5c). The Il1b expression in VAT was significantly reduced in KO mice (Fig. 5d), consistent with decreased chromatin accessibility and reduced inflammatory potential without Gdf3 (Fig. 4d).

a, The H3K27me3 MFI of CD11c+ ATMs from young (4-month-old) and old (22-month-old) female WT mice (n = 4, each group) injected with PBS or 0.1 mg kg−1 LPS for 4 h. b, The H3K27me3 MFI of ATMs and CD11c+ ATMs from unchallenged old (22–24-month-old) female WT (n = 6) and KO (n = 4) mice. c, The frequency of CD11c+ ATMs from unchallenged old (20–24-month-old) female WT (n = 9) and KO (n = 6) mice. d, The VAT Il1b expression from unchallenged old (20–24-month-old) female WT (n = 9) and KO (n = 6) mice. e, The UMAP of VAT immune cells (CD45+ cells) from unchallenged old (21–23-month-old) female WT (n = 3) and KO (n = 3) showing 24 clusters. f, The expressions of genes associated with GDF3–SMAD2/3 signaling, normalized across all identified clusters. g, The proportion of each ATM cluster (% of all each cluster). h, The expression of genes representing ATM phenotype, normalized across ATM clusters. i, The number of DEGs in ATM clusters (adjusted P value, Padj <0.05). j, The GSEA analysis using reactome chromatin modifying enzymes (top) and methylation-dependent heterochromatin formation (bottom) of KO versus WT ATM1 clusters. k, A volcano plot of DEGs between KO versus WT merged ATM. The inflammatory genes are highlighted in red and the chromatin remodeling-associated genes in yellow. Among chromatin remodeling-associated genes, PRC2 complex-related genes are marked with blue. All data are presented as means ± s.e.m. See Extended Data Figs. 8 and 9 for more details. NK, natural killer; Treg, regulatory T cell.
To investigate whether Gdf3-mediated chromatin remodeling alters ATM transcriptional profiles, FACS-sorted VAT immune cells from unchallenged old WT and KO mice were analyzed using scRNA-seq (n = 3 each group). WT and KO cells were analyzed together, identifying 24 clusters of cells, including three ATM clusters (Fig. 5e and Extended Data Fig. 8b–d). Consistent with Fig. 1f, ATM3, characterized with the highest Itgax (CD11c) expression, was the primary source of Gdf3 (Fig. 5f and Extended Data Fig. 8b,e–g). All three ATM clusters exhibited relatively higher expression of genes associated with the GDF3–SMAD2/3 axis compared with other VAT immune cells, including type I and type II activin receptors and signaling components (Fig. 5f). We then compared ATM frequencies within each cluster between WT and KO. Markedly, the ATM1 cluster was mainly composed of WT ATMs (Fig. 5g). ATM1 was characterized by a distinct set of inflammatory genes (S100a8/9) and inflammatory cytokine receptors (Il1r1, Il1r18), expressing low levels of both Mrc1 (CD206) or Itgax (CD11c; Fig. 5h). The flow cytometry supported this finding, showing a trend toward reduced CD206mid CD11cmid ATMs in old KO mice (Extended Data Fig. 8h). ATM2 and ATM3 represented CD206+ anti-inflammatory ATMs (Mrc1, Folr2, Lyve1, Mertk) and CD11c+ inflammatory/lipid associated ATMs (Itgax, Fabp4, Cd9, H2-Ab1, Il18), respectively (Fig. 5h). In summary, Gdf3, predominantly expressed in ATM3, is required for maintaining inflammatory ATM1 cluster during aging, indicating the local paracrine effects of Gdf3.
The number of differentially expressed genes (DEGs) revealed that ATM1 exhibited the most significant changes with lifelong Gdf3 deficiency (Fig. 5i). Gene set enrichment analysis (GSEA) on ATM1 DEGs showed enrichment in chromatin-modifying enzymes, chromatin remodeling and methylation-dependent heterochromatin formation without Gdf3 (Fig. 5j and Extended Data Fig. 9a). The adipose tissue myeloid cell aging gene signature was also reduced in KO ATM1 (Extended Data Fig. 9a). Next, the GO analysis on downregulated DEGs in KO ATM clusters identified suppressed biological processes in KO. The KO ATM1 cluster was enriched for oxidative phosphorylation pathways, whereas ATM2 and ATM3 were enriched for immune response-regulating signaling pathways (Extended Data Fig. 9b–d). To assess the overall impact of Gdf3 on all ATMs, merged ATM clusters were analyzed (Supplementary Table 2). In line with ATAC-seq results (Fig. 4 and Extended Data Fig. 7) and decreased ATM1 proportions (Fig. 5g), S100a8/9, Il18r1 and Il1r1 were significantly reduced in KO ATMs (Fig. 5k). Merged KO ATMs also showed the enrichment of gene sets related to chromatin-modifying enzymes and methylation-dependent heterochromatin formation (Extended Data Fig. 9e). Moreover, the expression of PRC2 components (Suz12, Eed, Ezh2, Jarid2) and additional repressive chromatin modifiers (Dnmt3a, Setbd2, Kmt5a) increased in KO ATMs (Fig. 5k). Out of 3,247 closing peaks in Gdf3-deficient ATMs (ATAC-seq; Fig. 4d), 1,497 peaks overlapped with downregulated genes in KO ATMs (scRNA-seq; Extended Data Fig. 9f and Supplementary Table 2). These findings demonstrate that Gdf3 regulates chromatin accessibility by counteracting histone methylation, promoting open chromatin formation that regulates transcription in ATMs during aging (Extended Data Fig. 9g).