
Enhanced ACE2 receptor binding and reduced thermostability of JN.1 and KP.2 S proteins compared to WT SARS-CoV-2 S protein
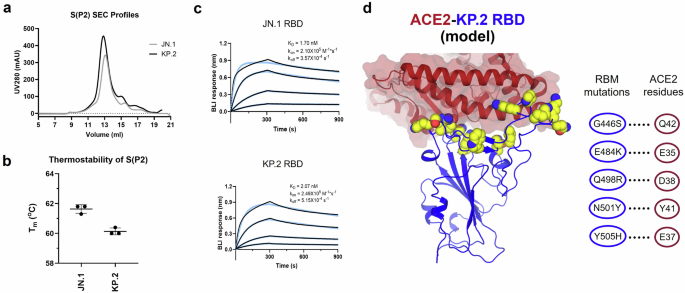
Full-length prefusion-stabilized S(P2) proteins of Wuhan-Hu-1 (WT), Omicron JN.1, and KP.2 were expressed from DNA corresponding to the adapted BNT162b2 RNA coding sequences using similar methods as previously reported29. All S(P2) proteins were expressed on the cell surface following in vitro transfection of Expi293F cells and showed similar binding to human angiotensin-converting enzyme 2 (ACE2) (Supplementary Fig. 1A). Analysis of membrane-extracted and affinity-purified full-length S(P2) showed a single peak by size exclusion chromatography (SEC), with S predominantly cleaved into S1 and S2 subunits, as indicated by SDS-PAGE (Fig. 1A and Supplementary Fig. 1B). Thermal shift assay (TSA) analyses showed that the melting temperature (Tm) of JN.1 (61.6 ± 0.24 °C) and KP.2 (60.1 ± 0.19 °C) were similar to one another (Fig. 1B) and ~5–7 °C lower than WT S(P2) (67.1 ± 0.17 °C)29. Biolayer interferometry (BLI) analysis of purified RBDs only, which contain the receptor binding motif (RBM) critical for ACE2 binding, showed significantly increased binding of soluble JN.1 and KP.2 RBDs to fixed human ACE2 peptidase domain (ACE2-PD) (KD 1.70 nM and 2.07 nM, respectively) compared to the WT RBD (KD 31.3 nM)29 (Fig. 1C). The RBDs of JN.1 and KP.2 inherited several RBM amino acid substitutions shared with XBB.1.5 that enhance receptor binding, such as G446S, Q498R, N501Y, Y505H, and E484K. These amino acid residue changes are highlighted in Fig. 1D alongside the crystal structure of the ACE2-PD aligned to the KP.2 1-up RBD.

a SEC profiles of the S(P2) proteins of JN.1 and KP.2. The S(P2) proteins were purified in DDM (n-dodecyl-β-D-maltopyranoside, see Supplementary Information). SDS-PAGE fractions from 12 mL to 15 mL of each FL S construct are shown in Supplementary Fig. 1B. b Melting temperature (Tm) of purified S(P2) proteins determined by the inflection point of the first derivatives of protein fluorescence signals collected at 330 nm over that of 350 nm. Experiments were conducted by Tycho NT.6 and run in triplicates (n = 3). c Biolayer interferometry (BLI) sensorgrams of RBD binding to immobilized human angiotensin converting enzyme-2 peptidase domain (ACE2-PD). The binding curves (black) were globally fit to a 1:1 Langmuir binding model (light blue). Calculated apparent KD, kon, koff values are listed in the figure. d Crystal structure of ACE2-PD/RBD complex (PDB: 6M0J) is aligned to the KP.2 1-up RBD. Only ACE2-PD and KP.2 RBD are shown for clarity. ACE2-PD is shown in maroon ribbon with surface representation. KP.2 RBD is shown in blue cartoon with amino acid residue changes in the receptor binding motif (RBM) from WT to KP.2 shown in yellow spheres. Coordinate alignment and presentation were made in PyMoL75. RBM residue changes (blue circle) that enhance receptor binding via putative specific interactions (dotted lines) to ACE2 residues (maroon circle) are shown in the interaction scheme on the right. Source data are provided as a Source Data file.
Acquisition of glycosylation sites within the JN.1 and KP.2 S proteins
The purified S(P2) proteins of JN.1 and KP.2 were analyzed by liquid chromatography mass spectrometry (LC-MS) to identify N-linked glycosylation sites. Glycosylation mapping confirmed that JN.1 and KP.2 have conserved glycosylation sites on the S protein, despite undergoing extensive mutations compared to WT S. This is consistent with previous studies of earlier lineages, suggesting a correlation between viral fitness and glycosylation30. Compared to XBB.1.5, we discovered two glycosylation sites (Table 1) in the RBD and N-terminal domain (NTD) of JN.1 and KP.2 S, respectively. This RBD glycosylation site is located on N354, which is gained by the K356T substitution, whereas the NTD glycosylation site is a result of the H245N substitution within the peptide ALN245RSYLT. Analysis of the glycosylation heterogeneity confirmed that both sites are fully modified by glycans with a major composition being HexNAc(2)Hex(5) (Supplementary Table 2).
JN.1 and KP.2 S(P2) cryo-EM structure
Structures of JN.1 and KP.2 full-length, prefusion stabilized SARS-CoV-2 S proteins were solved by cryo-EM to validate the conformation of the encoded antigen of both vaccines and to evaluate the structural consequences of the lineages’ hallmark mutations in the context of S(P2). Both JN.1 and KP.2 S(P2) proteins exhibited prefusion conformations, as anticipated. The cryo-EM processing employed herein sought to identify all RBD (up/down) configurations (Supplementary Figs. 2 and 3) within the S trimer. Unlike the WT S(P2) protein, which was predominantly (~80%) found in the 3-down conformation31, the prefusion-stabilized JN.1 S protein was observed in the 3-down (65%) conformation, and at a lower frequency in a 1-up (35%) conformations, while KP.2 S was more evenly observed in 3-down (41%) and 1-up (48%) conformations, with a small fraction in a 2-up (11%) conformation, indicating KP.2 exhibits a greater tendency than earlier variants for adopting the RBD-up conformations (Fig. 2A).

a Local resolution-filtered maps of the final 3D reconstructions are shown for each of the resolved RBD conformational states and colored by protomer. Local resolution estimations for maps shown in panels A though D are found in Supplementary Fig. 4. The first up RBD is colored green in both the JN.1 and KP.2 maps and the second up RBD in the KP.2 is colored blue. Proportions of particles derived from reference-based classification are expressed as a percentage below each map. b Magnified view of the 630-helix and fusion peptide proximal region (FPPR) from the KP.2 1-RBD-up map overlaid with the model shows the quality of the EM density in this region. c Magnified view of the stem from the JN.1 3-RBD-down map overlaid with the model shows the two partially occupied conformations of this helix beginning at the P1143L mutation. d Top view of the KP.2 1-RBD-up conformation structure shows the location of the N354 glycan due to the K356T substitution and a putative interprotomer hydrophobic interaction with P384 due to the F456L substitution. e Broad monoclonal antibodies (mAbs) G32R7 (PDB: 7N65) and P4J15 (PDB: 8PQ2), which bind early omicron lineages, are aligned to the KP.2 1-RBD-up. The proximity of these epitopes and the K356T and F456L substitution-induced surface alterations implicate these changes with evasion of early immunity.
In both JN.1 and KP.2 S, the C3-symmetric, 3-down conformation of the RBD core is resolved at ~4 Å, whereas the receptor binding motif (RBM), comprising residues 450-490, were absent at high resolution. In the 1-up conformations, the RBM was best resolved for the down-RBD adjacent to the up-RBD (Supplementary Fig. 4). The RBM of the down-RBD, adjacent to the up-RBD, was poorly resolved, though it contained high-resolution features for the core. In contrast, very little of the second up-RBD was seen in the 2-RBD-up KP.2 structure (Supplementary Fig. 4).
Structural changes for both lineages were likely caused by two amino acid substitutions shared by JN.1 and KP.2—P621S and P1143L—that differentiate them from XBB.1.5. The P621 residue is in a region of the S subdomain 2 called the 630 loop that is unstructured in full-length, 2P-stabilized XBB.1.5 and Wuhan S protein cryo-EM densities. Despite being situated in this unstructured region, the P621S substitution leads to a well-resolved alpha helix (Fig. 2B). The structured region is found in every protomer of the five solved structures of the JN.1 and KP.2 S proteins. In the context of the 1-up RBD structures of JN.1 and KP.2, a region adjacent to the 630 helix—residues 829–848 or the fusion peptide proximal region (FPPR) of the adjacent protomer—is also well-resolved (Fig. 2B, Supplementary Fig. 4). Though lower in resolution, there is a clear density, including a disulfide bond between C836 and C847. As a result, the structured FPPR interacts with the 630-helix from the adjacent protomer, contributing to an enhanced interprotomer stability which may reduce S1/S2 shedding in the context of the RBD-up conformation. The P1143 residue is located near the N-terminus of the stem helix. The cryo-EM density revealed two discrete conformations of the stem for both JN.1 and KP.2 S. The alternative poses were best resolved in the JN.1 3-down, C3-symmetry reconstruction (Fig. 2C, Supplementary Fig. 4) and diverge near the mutated proline residue.
Two additional mutations, H245N and K356T, differentiate JN.1 and KP.2 from XBB.1.5 and earlier lineages, and are shared with the parental BA.2.86 lineage. These mutations have yielded glycosylation sites that were fully glycosylated in the resolved structures (Fig. 2D, Table 1 and Supplementary Table 2). However, H245N within the NTD is located in a low-resolution region of the EM densities of the two JN.1 and three KP.2 structures. As a result, the possible glycosylation modification of H245N is absent from the cryo-EM map reconstruction. The K356T mutation led to glycosylation at N354 in JN.1, KP.2 and previous variants harboring the mutation32,33. This glycan is located near the interface of the RBD and the NTD of an adjacent protomer (Fig. 2D).
Overall, JN.1 and KP.2 S proteins differ by three residues: R346T and F456L in the RBD and V1104L in the S2 domain. R346T has been observed in several earlier lineages and may impact antibodies recognizing the RBD class 3 epitope34. The V1104L mutant residue exhibited density consistent with the additional methylene group and no discernable structural changes. F456L is located in the RBM within the P4J15 epitope (Fig. 2E) and in a relatively low-resolution region of the map. Of note, the RBD is best resolved in the down conformation adjacent to the up conformation and the mutant L456 is located at the protomer interface (Fig. 2D, Supplementary Fig. 4).
BNT162b2 JN.1- and KP.2-adapted vaccines neutralizing responses to JN.1 sublineages in a vaccine-experienced mouse model
BNT162b2 JN.1- and KP.2-adapted vaccines were evaluated in two mouse studies that examined immunogenicity in a BNT162b2-experienced immune setting. To approximate the immune background of a vaccinated human population, a vaccine-experienced animal model was generated by vaccinating mice with all licensed BNT162b2 vaccines sequentially spanning 2021 to the present [Original (2-doses), Bivalent Original+BA.4/5 (1-dose), XBB.1.5 (1-dose)]. BNT162b2 XBB.1.5, JN.1, or KP.2-adapted vaccines were administered as a 5th dose to female BALB/c mice 27 days following the XBB.1.5 vaccination (4th dose) (Supplementary Fig. 5A). Sera were collected prior to and 1 month following administration of the 5th dose for assessment of pseudovirus neutralization against Wuhan, BA.4/5, and XBB.1.5 lineages, as well as JN.1 lineages (JN.1, JN.1.16.1, KP.2, KP.2.3, KP.3, KP.3.1.1, LB.1, and XEC).
As a 5th dose, JN.1- and KP.2-adapted vaccines elicited much higher 50% geometric mean neutralizing titers (GMTs) against JN.1 and all JN.1 sublineages tested, as compared to the XBB.1.5 vaccine (Fig. 3A). The JN.1 and KP.2 vaccine responses were 3-to-4 times and 7-to-10 times higher, respectively, compared to the XBB.1.5 vaccine group, including against the globally prevalent KP.3.1.1 sublineage and the rapidly rising XEC sublineage (Fig. 3B). In XBB.1.5 vaccinated animals, neutralizing responses against the antigenically distant JN.1 lineage were ~20-fold lower than against the vaccine-matched lineage, XBB.1.5 (Fig. 3A). In contrast, sera from JN.1- and KP.2-vaccinated mice neutralized all JN.1 sublineages with similar potency, indicating a broadly robust and cross-protective immune response. Pre-5th dose, the highest neutralization titers were observed against the BA.4/5 strain for all three vaccine groups (Supplementary Fig. 6A). From pre- to post-5th dose, the JN.1-adapted vaccine boosted neutralizing responses (GMT fold rise [GMFR]) against JN.1 and KP.2 by 3.5- and 3.9-fold, respectively (Supplementary Fig. 6B). The KP.2-adapted vaccine increased neutralizing responses by 5.9-fold and 7.4-fold against the JN.1 and KP.2 lineages, respectively, as compared to the XBB.1.5 vaccine (Supplementary Fig. 6B). The XBB.1.5-adapted vaccine elicited the lowest GMFRs against JN.1 and KP.2 (0.9 and 1.8, respectively). Neutralizing titers elicited by control mice administered saline were negligible, at or near the lower limit of detection (Supplementary Fig. 7A).

Female mice (n = 10/group) were immunized i.m. on Days 0 and 21 with the BNT162b2 Wuhan (WT), on Day 49 with the bivalent BNT162b2 (WT + BA.4/5), on Day 84 with BNT162b2 XBB.1.5, and on Day 111 with the BNT162b2 XBB.1.5, JN.1, or KP.2 vaccine. One month post-5th dose, sera were collected from the terminal bleed and neutralizing antibody responses were measured against a panel of 11 pseudoviruses that included the Wuhan (WT) reference strain and Omicron lineages BA.4/5, XBB.1.5, JN.1, JN.16.1, KP.2, KP.2.3, KP.3, KP.3.1.1, LB.1, and XEC. a The number above each bar indicates the 50% neutralizing geometric mean titer (GMT) with 95% CI of 10 mice per vaccine group. b The geometric mean ratio (GMR) is shown as the ratio of the BNT162b2 KP.2 or JN.1 vaccine GMT to the BNT162b2 XBB.1.5 vaccine GMT of the corresponding pseudovirus. The number above each bar indicates the GMR with 95% CI. The limit of detection (LOD) is the lowest serum dilution, 1:20. Each point represents one animal. Asterisks indicate statistical significance of pseudovirus GMR relative to the corresponding pseudovirus in the monovalent XBB.1.5 vaccine group as determined by a two-sided ANOVA using a Dunnett’s multiple comparisons test. ****p < 0.0001, ***p < 0.001, **p < 0.01, *p < 0.05. Source data are provided as a Source Data file.
In a separate study, BNT162b2 XBB.1.5, JN.1, or KP.2 vaccines were administered as a 4th dose to female BALB/c mice 2 weeks after the 3rd dose (BNT162b2 bivalent WT + BA.4/5) (Supplementary Fig. 5B). Sera from JN.1- and KP.2-vaccinated mice neutralized a broad panel of JN.1 sublineages with similar potency (Supplementary Fig. 8A) and neutralizing responses elicited by control mice were, again, negligible (Supplementary Fig. 7B), similar to the 5th dose study. Here again, the JN.1- and KP.2-adapted vaccines elicited significantly (p < 0.05) higher neutralizing responses against JN.1 sublineages, on the order of 2-to-4-fold and 3-to-7-fold, respectively, than the XBB.1.5 vaccine (Supplementary Fig. 8B). These fold rises in titer were less than or comparable to the magnitude of rise observed when the vaccines were given as a 5th dose (Fig. 3B). Despite the variations in prior vaccination regimens, the JN.1 and KP.2-adapted vaccines elicited consistent neutralization trends and significantly improved immunogenicity against contemporary JN.1 lineage pseudoviruses, including against the more recently dominant sublineages (i.e., KP.3.1.1 and XEC), as compared to the XBB.1.5 vaccine.
BNT162b2 JN.1 and KP.2-adapted vaccines neutralizing responses to JN.1 sublineages in naïve mice
The Omicron XBB.1.5, JN.1 and KP.2 vaccines were administered on Days 0 and 21 to naïve female BALB/c mice as a primary series (Supplementary Fig. 5C). Sera were collected 1 month after the 2nd dose and tested against the pseudovirus panel used in the vaccine experienced studies described above. Although the BNT162b2 XBB.1.5 vaccine induced robust neutralizing responses against the XBB.1.5 lineage, it failed to elicit similar neutralizing titers against the antigenically distant JN.1 lineage and sublineages (Fig. 4A). Overall, the JN.1 and KP.2-adapted vaccines elicited significantly higher neutralizing responses against JN.1 and other relevant JN.1 sublineages, compared to the XBB.1.5-adapted vaccine (Fig. 4A), by an order of magnitude greater than the differences observed in the vaccine-experienced models (Fig. 3A and Supplementary Fig. 8A). Neutralizing GMTs in the JN.1 and KP.2 vaccine groups were 10-to-24-fold and 15-to-39-fold higher against JN.1 and JN.1 sublineages, respectively, as compared to the XBB.1.5 vaccine group (Fig. 4B). Although KP.2-adapted vaccine-elicited GMTs trended 2-to-3-fold higher than JN.1 vaccine-elicited GMTs, these differences were not statistically significant (Fig. 4A). Neutralizing titers elicited by control mice were negligible (Supplementary Fig. 7C), as observed in the vaccine-experienced models.

Female mice (n = 10/group) were immunized i.m. on Days 0 and 21 with the BNT162b2 XBB.1.5, JN.1, or KP.2-adapted vaccine. Sera were collected from the terminal bleed (Day 49) and neutralizing antibody responses were measured against a panel of 11 pseudoviruses that included the Wuhan (WT) reference strain and Omicron lineages BA.4/5, XBB.1.5, JN.1, JN.16.1, KP.2, KP.2.3, KP.3, KP.3.1.1, LB.1, and XEC. a The number above each bar indicates the 50% neutralizing geometric mean titer (GMT) with 95% CI of 10 mice per vaccine group. GMTs for the eight JN.1 lineage pseudoviruses were compared between JN.1 and KP.2 vaccine groups using ANOVA with Bonferroni test for multiple comparisons and showed no statistically significant ratios. b The geometric mean ratio (GMR) is shown as the ratio of the BNT162b2 KP.2 or JN.1 vaccine GMT to the BNT162b2 XBB.1.5 vaccine GMT of the analogous pseudovirus. The number above each bar indicates the GMR with 95% CI. The limit of detection (LOD) is the lowest serum dilution, 1:20. Each point represents one animal. Asterisks indicate statistical significance of pseudovirus GMR relative to the analogous pseudovirus in the monovalent XBB.1.5 vaccine group as determined by a two-sided ANOVA using a Dunnett’s multiple comparisons test. ****p < 0.0001, ***p < 0.001, **p < 0.01, *p < 0.05. N/A = Not available as both values to calculate GMR are at limit of detection. Source data are provided as a Source Data file.
Mapping of neutralizing antibody responses reveals antigenic shifts and drifts of SARS-CoV-2 Omicron lineages
To investigate the relative antigenic differences among lineages, as reflected in variant-adapted vaccine humoral immunogenicity, serum neutralizing titers from XBB.1.5-, JN.1- and KP.2-adapted BNT162b2 vaccinated mice (vaccine-experienced and naïve) described above, were used to generate antigenic maps of SARS-CoV-2 lineages, relative to one another and to the ancestral Wuhan-Hu-1 (WT) strain (Fig. 5). In the map of vaccine-elicited sera from naïve mice, JN.1 and all JN.1-derived sublineages lie within 2 antigenic units (1 unit equals 2-fold change in neutralization titer) from each other, suggesting a high antigenic similarity and indicative of limited antigenic drift within the JN.1 cluster thus far (Fig. 5A). In contrast, JN.1 and JN.1-derived sublineages were found to lie more than 4 antigenic units away from the original WT strain, and previously dominant lineages BA.4/5 and Omicron XBB.1.5, indicating a major antigenic shift from earlier SARS-CoV-2 lineages. Sera from vaccine-experienced mice yielded similar spatially represented antigenic relationships (Fig. 5B); however, these data are likely confounded by the influence of cross-reactive antibodies recognizing conserved epitopes. Antigenic maps generated in a naïve background more accurately reflect the true antigenic differences between virus strains or species. The cartographies of both backgrounds, however, clearly demonstrate that evolution toward JN.1 lineages marks a major antigenic shift from prior dominant lineages, such as those belonging to the XBB cluster. The distance of JN.1 lineages from XBB.1.5 is even greater than the latter is from its epidemiologically dominant predecessor, BA.4/5. However, the JN.1 lineages, particularly the parental JN.1 and its derivative KP.2, occupy proximal or overlapping coordinates of the antigenic maps, which is consistent with the similarity in neutralizing activity elicited by both vaccines against the entire panel of JN.1 sublineages.

Antigenic map visualizes cross-reactivity among a panel of 11 SARS-CoV-2 lineages showing (a) three groups of post-vaccination sera from naïve mice (n = 10/group) and (b) three groups of post-vaccination sera from vaccine-experienced mice (n = 10/group). SARS-CoV-2 lineages are shown as circles and sera are indicated as squares. Each square corresponds to sera of one individual mouse and is colored by the vaccine that mouse received (BNT162b2 XBB.1.5, JN.1, or KP.2). Antigenic distance is represented in both horizontal and vertical axes. Each square in the matrix represents 1 antigenic unit, which reflects a two-fold difference in neutralization titer. The points that are more closely together reflect higher cross-neutralization and are therefore antigenically more similar. Source data are provided as a Source Data file.
BNT162b2 JN.1- and KP.2-adapted vaccines induce comparable S-specific CD4+ and CD8+ T cell responses in BNT162b2-experienced and naïve mice
In both vaccine-experienced and naïve mice, spleens collected 1-month following final vaccination were interrogated for S-specific T cell cytokine responses using a flow cytometry-based intracellular cytokine staining (ICS) assay (Supplementary Fig. 9). Peptide pools representing the full-length S protein from the Wuhan (WT) virus, BA.4/5, XBB.1.5, JN.1 and KP.2 variants were used to assess lineage-specific CD4+ and CD8+ T cell responses ex vivo.
In vaccine-experienced mice, the XBB.1.5, JN.1 and KP.2 vaccines induced detectable frequencies of S-specific CD4+ (0.07-0.43%) and CD8+ T cells (0.55–12.4%) to all five variants, as compared to the saline control (0-0.05%) (Fig. 6). Mice administered the 5th dose of XBB.1.5, KP.2 and JN.1 vaccine elicited median frequencies of cytokine-expressing CD4+ T cells that were within <1% of total CD4+ T cells for IFN-γ+, TNF+, and IL-2+ cells (Fig. 6A–C). The median frequencies of cytokine-expressing CD8+ T cells in XBB.1.5, KP.2, and JN.1-vaccinated mice were also similar between vaccine groups. Frequencies ranges among individual mice were the highest for IFN-γ+ cells (2.59–24.90%) with smaller ranges for TNF+ cells (1.06–13.80%) and IL-2+ cells (0.20–3.08%) (Fig. 6D–F). Within each vaccine group, the median frequencies of cytokine-expressing CD4+ and CD8+ T cells were similar across all lineages tested, indicating that the T cell responses were cross-reactive. The same was true for polyfunctional (IFN-γ+ TNF+ IL-2+) CD4+ (Supplementary Fig. 10A) and CD8+ T cell responses (Supplementary Fig. 10B).

One-month after the 5th dose of BNT162b2 variant-adapted vaccine (XBB.1.5, JN.1, or KP.2), S-specific splenocytes (n = 5/group) were characterized by a flow cytometry-based intracellular cytokine staining (ICS) assay. All samples were stimulated ex vivo with S peptide pools from the WT reference strain and Omicron BA.4/5, XBB.1.5, JN.1, and KP.2 sublineages. Graphs show the frequency of CD4+ T cells expressing a IFN-γ, b TNF, and c IL-2, and the frequency of CD8+ T cells expressing d IFN-γ, e TNF, f IL-2 in response to stimulation with each peptide pool across vaccine groups. Bars depict median frequency + interquartile range. Results are background (media-DMSO) subtracted and shown as percentage of cytokine-expressing CD4+ T cells and CD8+ T cells. Each point represents one animal. Source data are provided as a Source Data file.
In naïve mice, the magnitude of S-specific CD4+ and CD8+ T cell responses was lower than the ones observed in vaccine-experienced mice (Fig. 7). However, the trends elicited by the XBB.1.5, JN.1 and KP.2 vaccines, were generally consistent with those observed in the vaccine-experienced study. Mice administered the XBB.1.5, KP.2, and JN.1 vaccine elicited frequencies of cytokine-expressing CD4+ T cells that were within <1% of total CD4+ T cells for IFN-γ+, TNF+, and IL-2+ cells (Fig. 7A–C). The median frequencies of cytokine-expressing CD8+ T cells in XBB.1.5, KP.2, and JN.1-vaccinated mice were also similar between vaccine groups; frequencies among individual mice were within <3%, <2%, and <1% of total CD8+ T cells for IFN-γ+, TNF+, and IL-2+ cells, respectively (Fig. 7D–F). Similar to the vaccine-experienced study, within each vaccine group, the median frequencies of cytokine-expressing CD4+ and CD8+ T cells, as well as polyfunctional CD4+ (Supplementary Fig. 11A) and CD8+ T cells (Supplementary Fig. 11B), were similar across all lineages tested.

At 1-month post-second dose of BNT162b2 variant-adapted vaccine (XBB.1.5, JN.1, or KP.2) (completion of primary series), S-specific splenocytes (n = 5/group) were measured by intracellular cytokine staining (ICS) assay. All samples were stimulated ex vivo with S peptide pools from the WT reference strain and Omicron BA.4/5, XBB.1.5, JN.1, and KP.2 sublineages. Graphs show the frequency of CD4+ T cells expressing a IFN-γ, b TNF, and c IL-2, and the frequency of CD8+ T cells expressing d IFN-γ, e TNF, f IL-2 in response to stimulation with each peptide pool across vaccine groups. Bars depict median frequency + interquartile range. Results are background (media-DMSO) subtracted and shown as percentage of cytokine-expressing CD4+ T cells and CD8+ T cells. Each point represents one animal. Source data are provided as a Source Data file.