
Delayed booster vaccination with rVSV∆G-ZEBOV-GP at 18 months promotes durable EBOV-neutralizing antibodies
Longitudinal antibody repertoire profiling was performed on pre- and postvaccination serum samples collected at multiple time points for up to 3 years from healthy adults vaccinated with a 20 million-p.f.u. dose of rVSV∆G-ZEBOV-GP27 (Fig. 1a and Extended Data Table 1). Serologic analyses were performed on 22 individuals who received a prime vaccination at month 0, followed by a booster vaccination at 18 months (Prime–Boost group), whereas 34 individuals only received a single vaccine dose at month 0 (No Boost group). Samples were tested for EBOV-neutralizing antibodies by plaque reduction neutralization testing (PRNT), polyclonal antibody epitope repertoire of post-vaccination sera by EBOV-GP GFPDLs, GP-binding antibodies, cross-reactivity to Makona GP, anti-GP antibody affinity maturation and antibody isotypes by SPR, EBOV-GP-specific FcγR antibody interaction by bead assay and functional assay, and EBOV-GP-specific B cell responses by multiparameter spectral flow cytometry.

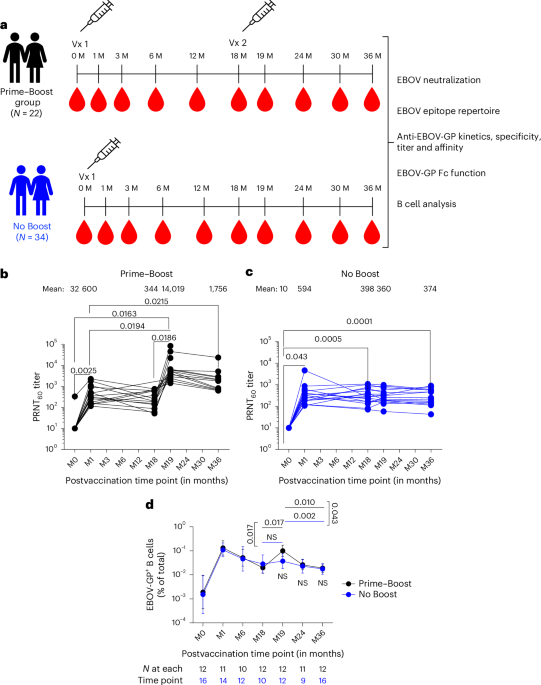
a, Overview of the cohort with longitudinal serum samples collected from 22 vaccinees in the Prime–Boost group and 34 adults in the prime-only No Boost cohort. Comprehensive antibody profiling of serum samples from both cohorts was performed via assessing EBOV-neutralizing antibodies using PRNT, determining the EBOV-GP antibody epitope repertoire by GFPDLs, characterizing EBOV Kikwit and Makona strain GP binding antibody kinetics using SPR, assessing IgG–FcγR interactions using a Luminex and functional assay, and performing B cell analyses using flow cytometry; M, month. b,c, Neutralizing antibody titer (PRNT60) data for VSV∆G-ZEBOV-GP Kikwit strain are shown for the Prime–Boost group (b; n = 15) and No Boost group (c; n = 16). d, Frequencies of EBOV-GP+ B cells are shown as geometric mean with 95% confidence interval for Prime–Boost and No Boost groups. The number of individuals tested is shown below each time point. Differences between time points within each group or between groups were examined for statistical significance by two-sided paired or unpaired t-tests, respectively, and statistically significant values (P < 0.05) are shown; NS, not significant.
Source data
The samples were tested for neutralizing antibodies against rVSV∆G-ZEBOV-GP vaccine virus by PRNT to determine the serum titer to reduce 60% of plaques (60% neutralization titer; PRNT60)30. Very low neutralizing antibodies (PRNT60 ≤ 1:20) to rVSV∆G-ZEBOV-GP vaccine virus were observed in prevaccination samples of all but one individual that were near the limit of detection for the PRNT (Fig. 1b,c). Primary rVSV∆G-ZEBOV-GP vaccination induced significantly higher neutralization titers (mean PRNT60 of 600) that peaked at 1 month after vaccination than prevaccination titers across both groups. There was no significant difference between the groups. Neutralizing antibodies declined over time to reach mean PRNT60 titers of 344–398 at 18 months after primary vaccination across study cohorts. A booster rVSV∆G-ZEBOV-GP vaccination given at 18 months after the primary vaccination generated 23-fold higher neutralizing antibody titers (mean PRNT60 titer of 14,019) than those induced at 1 month after primary vaccination (Fig. 1b). Moreover, postbooster neutralizing antibodies were 5.1-fold higher (mean PRNT60 of 1,756) at 18 months after second vaccination (36-month time point) than neutralization titers at 18 months after the first vaccination (PRNT60 of 344) in the Prime–Boost group. PRNT60 titers showed similar kinetics and magnitudes in both men and women after the first and second vaccinations (Extended Data Fig. 1).
EBOV-GP-specific B cell responses were evaluated in the limited number of individuals from whom peripheral blood mononuclear cells (PBMCs) were collected, stored and available for analysis (Fig. 1d). The analyses were performed by flow cytometry using tetramers of EBOV-GP conjugated to two different fluorochromes after verification of specificity (Extended Data Fig. 2a). Although frequencies of EBOV-GP+ B cells rose from a mean of 0.005% at baseline (month 0) to 0.19% at 1 month after primary vaccination for both groups combined, there was a moderate effect of the booster vaccine between the two groups. This was despite a significant increase in frequency for the boosted individuals between month 18 and month 19 time points (Fig. 1d) and a significant effect of the booster vaccine on anti-EBOV-GP IgG titers, consistent with data reported for the entire cohort27 (Extended Data Fig. 2b). The slopes of increase at the month 18-to-month 19 time interval and decrease at the month 19-to-month 36 time interval, respectively, were significant for the Prime–Boost group compared to the No Boost group. Collectively, these data show that although a single dose of the rVSV∆G-ZEBOV-GP vaccine led to equally robust antibody and B cell responses, the booster dose at month 18 induced strong and sustained neutralizing antibodies, yet B cell responses were more modest and short lived in systemic circulation.
Diverse antibody epitope repertoire following first and second vaccination with rVSV∆G-ZEBOV-GP
The polyclonal antibody epitope repertoire of pre- and postvaccination serum samples following rVSV∆G-ZEBOV-GP vaccination were elucidated using EBOV-GP GFPDLs containing a random distribution of sequences and fragment sizes ranging from 50 to 1,000 bp in length of the gene encoding GP from EBOV Kikwit strain with >107 unique phage clones, expected to display all possible linear and conformational epitopes, as described before23,31. Previous studies for epitope mapping of monoclonal antibodies (mAbs) and adsorption studies using postvaccination polyclonal sera provided support for using the EBOV-GP GFPDLs to define polyclonal antibody repertoires in human sera23,31. Serum samples within each group were pooled from each individual that underwent collection before vaccination (month 0), at 1 month after the first vaccination, at 19 months (1 month after the second vaccination in the boost group) and at month 36 (18 months after the second vaccination in the boost group) to determine overall antibody epitope repertoires (Fig. 2).

Schematic alignment of the peptide sequences recognized by sera before (prevaccination (month 0)) or at different time points (1 month, 19 months and 36 months) following rVSV∆G-ZEBOV-GP vaccination in the Prime–Boost group (a) or No Boost group (b), identified by selection with EBOV-GP GFPDLs. The amino acid designation is based on the complete EBOV Kikwit GP sequence, and GP1 and GP2 subdomains are shown. The GP RBR is depicted as yellow, and the mucin-like domain (MLD) is shown in light green. Other GP domains such as signal peptide (SP), glycan cap (GC), fusion peptide (FP), heptad repeat 1 (HR1), heptad repeat 2 (HR2), transmembrane (TM) and cytoplasmic tail (CT) are depicted. Bars indicate identified inserts in the GP sequence. A graphical distribution of representative clones with a frequency of ≥2, obtained after affinity selection, is shown. The horizontal position and the length of the bars indicate the peptide sequence displayed on the selected phage clone to its homologous sequence in the EBOV-GP sequence on alignment. The thickness of each bar represents the frequency of repetitively isolated phage, with the scale shown below the alignment.
Prevaccination serum bound very few phages (<100) that mapped to the C-terminal domain of GP2 in both groups (Fig. 2a,b). At 1 month following primary rVSV∆G-ZEBOV-GP vaccination, the number of bound phages was higher in both groups (1.04 × 10⁶ and 1.17 × 10⁶ phages, respectively). Sequencing of GP fragments expressed by phages bound with sera following the first vaccination in both cohorts showed high frequency of bound phages displaying both small and large fragments mapping across the entire GP1 head domain and the C terminus of the EBOV GP2 domain. Within the GP1 domain, post-first vaccination antibodies recognized several small and large immunodominant epitopes in the N-terminal half of EBOV-GP mapping to the receptor binding region (RBR), the region between the RBR and the glycan cap domain, and the glycan cap and mucin domain. In GP2, the selected phage clones mapped primarily to the heptad repeat domain 2.
In the No Boost group, at 19 months after the first vaccination, the bound phage titers declined appreciably such that only 783 phage clones were recognized that mapped to the RBR, glycan cap and mucin domain in GP1 and the C-terminal domain of GP2 (Fig. 2b). By 36 months, only 262 clones were identified that primarily mapped to the C terminus of GP2 and some interspersed sites in GP1.
Importantly, a second rVSV∆G-ZEBOV-GP vaccination given at 18 months after the first vaccination boosted the number of EBOV-GFPDL-bound phages (3.95 × 10⁶ phages) by 3.7-fold relative to the first vaccination (Fig. 2a). The antibody epitope profiles were diverse, with a prominent increase in antibodies specific to the RBR and glycan cap and antibodies recognizing large sequences in the mucin-like domain of GP1. Interestingly, even after 18 months following the second vaccination, the antibody repertoire diversity across GP1 and GP2 persisted, and phage titers (1.98 × 10⁶ phages) only declined twofold by 36 months compared to month 19.
Antibody binding to EBOV Kikwit and Makona GP
As the EBOV-GP GFPDL analyses were performed on pooled serum samples from each group, we performed quantitative analyses of sera from each individual at all time points with the recombinant GP derived from the vaccine-homologous Kikwit strain as well as the 2014-Makona strain responsible for the largest EBOV outbreak to date (Fig. 3a–d). The SPR-based assay measures the total EBOV-GP binding antibody titer independent of a secondary antibody and determines the total combined antibody binding of all isotypes (IgM + IgG + IgA) in the polyclonal sample to EBOV-GP captured on a sensor chip as resonance units (RU).
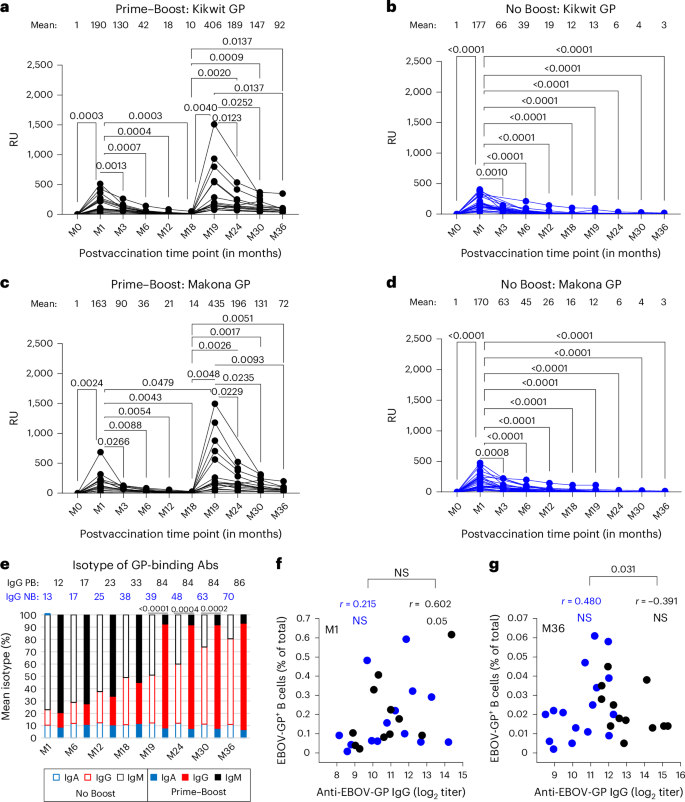
a–d, Serum samples collected at different time points from adults vaccinated before and at different time points after rVSV∆G-ZEBOV-GP vaccination (in months) were analyzed for total antibody binding to purified mature GP from EBOV Kikwit (a and b) and EBOV-Makona (c and d) strains for the ‘Prime–Boost’ group (a and c; n = 15) and ‘No Boost’ group (b and d; n = 24) by SPR. Individuals were vaccinated intramuscularly on day 0 in both groups and boosted at 18 months in the Prime–Boost group (a and c). Total EBOV-GP-binding antibodies are represented in SPR RU for each individual at all time points. Mean RU is shown for each time point above the graph. Differences between time points within each group were examined for statistical significance by two-sided paired t-test, and statistically significant values (P < 0.05) are shown. e, Isotyping of human serum antibodies bound to GP of the EBOV Kikwit strain at different time points following rVSV∆G-ZEBOV-GP vaccination as measured by SPR. The RU for anti-GP-bound IgM/IgG/IgA was divided by the total RU for total bound IgM + IgG + IgA combined for each serum sample and is represented as a percentage. Mean percent IgG is shown at different time points for each cohort: No Boost (NB) and Prime–Boost (PB). f,g, Correlations between mean anti-EBOV-GP IgG titers and frequencies of EBOV-GP+ B cells determined using two-sided Pearson’s method for each vaccine group at month 1 (f) and month 36 (g) time points. A Fisher’s z transformation was used to compare the correlation coefficients (r) between the two groups, and numbers shown represent values that were statistically significant (P < 0.05).
Source data
Prevaccination sera (month 0) did not show antibody binding to GP on either the 1995-Kikwit (Fig. 3a,b) or 2014-Makona strain (Fig. 3c,d) in either of the cohorts. At 1 month after first rVSV∆G-ZEBOV-GP vaccination, all samples from both groups reacted with GP from Kikwit and Makona strains, with mean titers ranging between 163 and 190 RU, and no significant difference among either of the two vaccine groups or between the two GPs was observed. Subsequently, the total antibody reactivity after the first vaccination decreased over time, with a steeper decline in the first 6 months, such that most of the vaccinated individuals (>80%) at the 6-month time point showed very low anti-GP binding levels to both Kikwit and Makona GPs.
Surprisingly, the second rVSV∆G-ZEBOV-GP vaccination given at 18 months boosted 2.1-fold higher anti-Kikwit GP and 2.6-fold higher antibody titers to Makona GP than anti-GP binding titers at peak (month 1) after the first vaccination (Fig. 3a,c). This contrasts with the previous study where a second vaccination given only 28 days after first vaccination did not improve the anti-GP antibody response23. Over time, anti-GP antibody titers also declined after the second vaccination; however, these antibody titers at 18 months after second vaccination (month 36; mean RU of 72–92) were still at least fivefold higher than those observed at 18 months after first vaccination (month 18; mean RU of 10–14) against the GPs of both Kikwit and Makona strains.
Isotype analysis of the antibodies binding to GP revealed that most of the GP-binding antibodies at 1 month after primary vaccination were of the IgM isotype (mean of 77–79%), with a smaller representation of IgG (mean of 12–13%) and IgA (mean of 9–10%) in the two cohorts (Extended Data Fig. 3). Over time, these antibodies binding to GP declined such that at 18 months after first vaccination, the anti-GP present consisted of 50–55% IgM, 33–38% IgG and 11–12% IgA in the two groups. At later time points (months 24–36) after the first vaccination, the residual antibodies binding to GP remaining in the sera were IgG, suggesting that most of the antibodies to GP generated early following single rVSV∆G-ZEBOV-GP vaccination were IgM, which are short lived and do not provide long-lasting systemic anti-GP humoral immunity. Notably, a booster vaccination given at 18 months changed the distribution of antibodies binding to GP, with IgG frequency in the serum increasing to 84%, followed by 8% IgA and 7% IgM at 1 month (month 19) after second vaccination (Fig. 3e). This delayed booster-induced anti-GP IgG response was durable up to at least 18 months after second vaccination (month 36), with a mean IgG frequency of 86%.
The analysis revealed that most of the anti-GP antibody response generated early following first vaccination was of the IgM isotype and were short lived, whereas delayed booster vaccination with replicating rVSV∆G-ZEBOV-GP given at 18 months generated a strong long-lasting systemic cross-reactive anti-GP IgG response to different Ebola Zaire (renamed O. zairense) strains.
B cell responses following rVSV∆G-ZEBOV-GP vaccination
Titers of anti-EBOV-GP IgG and frequencies of EBOV-GP+ B cells were directly correlated for both groups at month 1 yet were significantly divergent by month 36, whereby the direction continued to be positive for the No Boost group while turning negative after month 19 for the Prime–Boost group (Fig. 3f,g and Extended Data Fig. 2c). High-dimensional analyses of the flow cytometric data were performed to gain further insight into changes in EBOV-GP-specific B cell responses following vaccination. Unsupervised clustering and dimensionality reduction of total B cells from all time points and individuals combined generated 30 distinct clusters and areas on uniform manifold and approximation projection (UMAP) that were defined by immunoglobulin isotype distribution and dominated by naive B cells (Extended Data Fig. 4a,b and Extended Data Table 2). By contrast, the EBOV-GP-specific response was dominated by activated and memory populations that transitioned from predominantly IgM to IgG clusters over time (Extended Data Fig. 4c). This transition was highly significant and accelerated by the booster dose, as reflected by comparing isotypes after primary (month 1) and secondary (month 19) doses within the Prime–Boost group and at month 19 between the two groups (Fig. 4a).

a, Medians of EBOV-GP+ counts within each cluster calculated as a percentage of total CD19+ B cells and color coded by immunoglobulin are shown by vaccination group and time point. The color tones are darkest for activated and lightest for quiescent clusters. b–d, Mean ± s.e.m. and individual EBOV-GP+ frequencies for IgM (b), IgG activated (c) and resting memory (d) clusters are shown at the indicated time points by vaccine group and within the Prime–Boost group (n = 11), respectively. The number of individuals tested at each time point (b–d) is shown in Fig. 1d. Differences at specified or all time points (multiple time points in b–d) between the two groups or within the Prime–Boost group were examined for statistical significance by two-sided Welch’s or paired two-sample t-test, respectively. Numbers or NS shown represent values that were statistically significant (P < 0.05) or not, respectively, whereas only significant values are shown in graphs with multiple time points.
Source data
Within IgM clusters, activated cluster 4 (C4) and resting memory C1 cells drove the primary EBOV-GP-specific response (Fig. 4a). The contribution of these two clusters, along with other minor IgM clusters, to the total EBOV-GP-specific response was significantly higher after the priming vaccine (month 1) than after the booster vaccine (month 19), although C1 also contributed to the booster response (Fig. 4b and Extended Data Fig. 5). Within IgG clusters, activated C8 (CD21loCXCR3+CD95+) and the more quiescent relative cells in C13 contributed to the EBOV-GP-specific response after both vaccine doses, whereas activated C7 (CD38+CD71+CD95+) cells only contributed to the primary vaccine dose (Fig. 4c,d). Finally, the main IgG resting memory cluster, C18, and its CD27lo counterpart C21 (Extended Data Fig. 4a) were more strongly induced by the booster dose (month 19) than the primary dose (month 1); however, differences between the two vaccine groups did not reach significance at any of the postbooster vaccine time points (Fig. 4d and Extended Data Fig. 5). Collectively, although these observations are consistent with the antibody data showing a transition from an IgM to an IgG response, the delayed booster vaccine did not induce a strong durable IgG B cell response that is typically driven by activated CD71+ phenotypes32,33.
Anti-GP IgG–Fc receptor interactions following rVSV∆G-ZEBOV-GP vaccination
Neutralization by antibodies is often the main mechanism to prevent or reduce viral infection. However, other antibody effector functions mediated by Fc and Fc-domain sensors on adaptive and innate immune cells can act either independently or in combination with neutralization to reduce viral disease or infection. Antibody-dependent cellular phagocytosis (ADCP), antibody-dependent cellular cytotoxicity (ADCC) and the complement system contribute to clearance of viral particles or virus-infected cells through interaction with FcγRI/FcγRIIA, FcγRIIIA and C1q, respectively. Because each FcγR is associated with a specific effector function, determining the FcγR interaction with GP-specific antibody binding induced by rVSV∆G-ZEBOV-GP vaccination can be a good surrogate marker for a potential role of antibody Fc-mediated protection against EBOV.
To determine if anti-GP serum IgG generated following rVSV∆G-ZEBOV-GP vaccination has the capacity to mediate various Fc effector functions through engagement with FcRs, polyclonal IgG bound to vaccine-homologous Kikwit GP was evaluated for binding to various FcγRs and C1q by bead-based Luminex assay following vaccination (Fig. 5a–d). At 1 month after first vaccination, anti-GP IgG demonstrated low binding to FcγRI and FcγRIIIA that was boosted 8- to 15-fold by the second vaccination at 1 month (month 19), respectively (Fig. 5a,c). Post-second vaccination-induced FcγRI and FcγRIIIA reactivity remained elevated by five- to sevenfold higher at 18 months (month 36) after second vaccination than peak response (month 1) after first vaccination. Minimal or no binding was observed for FcγRIIA, FcγRIIB, FcγRIIIB and C1q to post-first vaccination anti-GP IgG in either study group (Extended Data Fig. 6). However, second vaccination induced moderate but significantly higher reactivity with FcγRIIA, FcγRIIB and C1q and low reactivity with FcγRIIIB.

a–d, Quantification of FcγRI (a and b) and FcγRIIIA (c and d) interaction with serum antibodies bound to EBOV Kikwit GP-coupled beads either before (month 0) or at different time points after vaccination as assessed by bead-based assay. Each sample from the ‘Prime–Boost’ group (a and c; n = 15) and ‘No Boost’ group (b and d; n = 23) was run in duplicate, and each symbol represents average fluorescence intensity (FI) of duplicate values. The variation for each sample in duplicate runs was <6%. Mean fluorescence intensity is shown for each time point above the graph. e–h, Comparison of ADCC and ADCP responses between Prime–Boost and No Boost groups. Panels show mean relative light unit (RLU) values at baseline (month 0), 1 month (month 1) and 19 months (month 19) postvaccination time points above the graph. Differences between time points within each group were examined for statistical significance by two-sided paired Student’s t-test, and statistically significant values (P < 0.05) are shown.
Source data
Functional analysis revealed that in the Prime–Boost group, ADCC activity increased significantly from a baseline (month 0) mean of 0.1 to 2,529 at month 1 and from month 1 to a peak mean of 7,748 at month 19 (Fig. 5e,f). By contrast, there was no increase in the No Boost group between month 1 and month 19. A similar pattern was observed for ADCP, albeit with different kinetics and magnitude. In the Prime–Boost group, ADCP activity increased significantly from a baseline (month 0) mean of 0.1 to 193 at month 1 and further to 950 at month 19 (Fig. 5g,h). The No Boost group showed ADCP activity increasing significantly from a baseline (month 0) mean of 0.1 to 113 at month 1 and 224 at month 19. Although both groups achieved statistical significance from baseline, the Prime–Boost group had 5.5-fold higher peak ADCC and 4-fold higher peak ADCP activities than the No Boost group. This suggests that a Prime–Boost regimen induces a superior antibody effector function, which may contribute to vaccine efficacy. Correlations between FcγR binding and functional responses were performed and revealed distinct patterns relative to ADCC and ADCP activities (Extended Data Fig. 7). For the Prime–Boost group, ADCC activity showed moderate significant correlation with FcγRIIA and FcγRIIIA binding. For ADCP activity, moderate correlation with FcγRIIA binding was observed and minimal with FcγRIA and FcγRIIIA binding, suggesting minimal association between FcγRIA and FcγRIIIA binding and phagocytic activity.
Delayed booster rVSV∆G-ZEBOV-GP vaccination promotes antibody affinity maturation
As noted above, a previous study showed that prime–boost rVSV∆G-ZEBOV-GP vaccination given at 28 days apart did not improve antibody affinity to EBOV-GP23. To further investigate the impact of a delayed prime–boost rVSV∆G-ZEBOV-GP vaccination given at 18 months on anti-GP affinity maturation, we determined the dissociation rates (off-rate constants) of postvaccination serum antibody–antigen complexes using SPR, which is independent of antibody concentration and provides a measure of overall avidity of polyclonal antibody binding as previously described34. One month following primary vaccination, the off-rates for polyclonal serum antibodies bound to GP were fast (6 × 10⁻² per s) against GP of both vaccine-homologous Kikwit and Makona strains, indicating weak antibody affinity (Fig. 6). These anti-GP affinities matured over time to peak at ~4 × 10⁻³ per s at 6 months after first vaccination and then plateaued thereafter.

Antibody affinity of postvaccination serum samples was determined by measuring dissociation kinetics (off-rates) of polyclonal serum antibodies from all individuals against vaccine-homologous EBOV Kikwit GP (a and b) and Makona GP (c and d) using SPR. Antibody off-rate constants that describe the fraction of antibody–antigen complexes decaying per second were determined directly for each serum sample from the ‘Prime–Boost’ group (a and c; n = 15) and ‘No Boost’ group (b and d; n = 24) using SPR. Each symbol represents the average of duplicate values. The variation for each sample in duplicate runs was <6%. The mean off-rate for each time point postvaccination is shown above the graph. Differences between time points were examined for statistical significance by two-sided paired Student’s t-test, and statistically significant values (P < 0.05) are shown.
Source data
Surprisingly, the delayed second vaccination promoted a faster and significantly stronger antibody affinity maturation with an approximately tenfold higher GP-specific antibody affinity (mean off-rate of 3 × 10⁻⁴ per s) than those induced after first vaccination that peaked within 1 month following booster vaccination to GP of both strains (Fig. 6a,c). Importantly, these high-affinity antibodies to GP were long lasting and were maintained up to at least 18 months after second vaccination in these prime-boosted vaccinated individuals.
Together, our study demonstrates that delayed rVSV∆G-ZEBOV-GP vaccination promotes a highly diverse, strong, durable, predominantly IgG, highly affinity-matured antibody response to GP.