
Soluble factors in the plasma of MF patients induce exacerbated MK proliferation
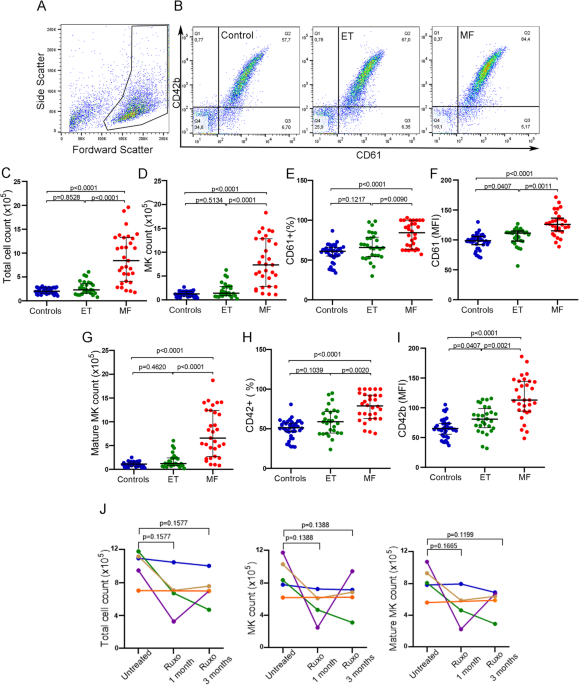
To evaluate the effect of soluble factors present in the plasma of MPN patients on megakaryopoiesis, plasma samples from untreated MF or ET patients were incubated with normal cord blood-derived CD34 + progenitors and cultured during 12 days under MK differentiation conditions. Total cell number was counted and the number of MK and mature MK (MMK) were calculated using the percentage of CD61+ (MK marker) and CD42+ (maturation marker) events obtained by flow cytometry. An example of MK selection strategy is shown (Fig. 1A, B). Plasma from MF patients induced an increase in total cell, MK and MMK number compared to control plasma. This increase was not observed with plasma from ET patients, which behaved similarly to the control group (Kruskal–Wallis followed by Dunn’s multiple comparisons test; Fig. 1C–I). Moreover, expression levels of CD61 and CD42b were also increased following incubation with MF compared to ET and control plasma, as evidenced by higher mean fluoresce intensity (Figs. 1F, I). We then analyzed the size and complexity of MKs incubated with plasma using the forward and side scatter data of the CD61 + population obtained by flow cytometry. CD34 + progenitors incubated with MF plasma exhibited normal size (FSC), but higher complexity (SSC) compared to MK incubated with control and ET samples (Fig. S1). Overall, these results indicate that soluble factors present in MF but not ET plasma lead to enhanced MK output and maturation.

Effect of myeloproliferative neoplasm plasma on CD34 + progenitors. Umbilical CD34 + progenitor cells were cultured in the presence of 10% plasma from normal controls (C, n = 40), essential thrombocythemia (ET, n = 28) or myelofibrosis (MF, n = 30) patients and TPO during 12 days to evaluate megakaryopoiesis. Cells were labeled with CD61-FITC and CD42b-PE antibodies and evaluated by flow cytometry. Cells were selected by forward scatter (FSC) versus side scatter (SSC) and analyzed by CD61-FITC and CD42b-PE expression to determine megakaryocyte (MK) percentage and maturation, respectively. (A) An example of selected gate for MK analysis is shown. (B) Representative analysis of MK output in cultures incubated with Control, ET and MF plasma analyzed by CD61 and CD42b staining is shown. (C) Total cell number (Neubauer chamber), (D) MK (CD61 + events), (E) Percentage of CD61 + events, (F) CD61 median florescence intensity, (G) Mature MK (CD61/CD42b + events) number, (H) Percentage of CD61/CD42 + events and (I) CD42b median florescence intensity were plotted. Kruskal–Wallis followed by Dunn’s multiple comparisons test. Bars and error bars indicate the median with interquartile range. (J) Effect of Ruxolitinib on MF plasma-induced megakaryopoiesis. Megakaryopoiesis was evaluated on CD34 + progenitors in the presence of sequential plasma samples obtained from MF patients without treatment and during treatment with ruxolitinib (at 1 and 3 months) (n = 5). Total cell, MK and mature MK count are shown. Friedman followed by Dunn’s multiple comparisons test. Bars and error bars indicate median with interquartile range. All experiments were carried out in triplicate in three independent umbilical cord blood samples.
Plasma from ruxolitinib-treated MF patients decrease MK numbers
Treatment with ruxolitinib leads to clinical improvement in MF patients, at least in part by reducing the levels of circulating inflammatory cytokines. As an approach to evaluate whether the effect of plasma factors on megakaryopoiesis could be due to elevated inflammatory cytokines present in MF circulation, we evaluated serial samples from 5 MF patients before treatment and at 1 and 3 months after starting treatment with ruxolitinib, using the above described system. Three patients showed a decrease in the total number of cells, MK and MMK at 1 and 3 months of treatment, compared to pre-treatment samples from the same patients, although without reaching statistical significance (Friedman followed by Dunn’s multiple comparisons test), in accordance with improvement of constitutional symptoms (Fig. 1J). These data suggest that the inflammatory cytokines present in patient plasma could be responsible, at least in part, for enhanced MK output induced by MF samples. On the other hand, MK numbers induced by incubation with the remaining two patient samples was not ameliorated during ruxolitinib treatment. Interestingly, these two samples belonged to patients whose clinical response to ruxolitinib was suboptimal or absent (orange and blue lines, Fig. 1J).
Influence of patient clinical and molecular features on abnormal megakaryopoiesis induced by MF plasma
To analyze the influence of driver mutations on soluble factors present in samples that stimulated megakaryopoiesis, MF patients were divided according to their mutational status into JAK2V617F– and JAK2V617F+. A trend towards increased total cell, MK and MMK number was induced by plasma from MF patients carrying the JAK2V617F mutation (Student-t test with Welch´s correction; Fig. 2A), suggesting a relationship among the presence of the JAK2V617F mutation, plasma factors and the increase in cell number.

Relationship between clinical features and altered megakaryopoiesis induced by MF plasma. Myelofibrosis (MF) patients were grouped by mutational status in (A) JAK2V617F+ (n = 14)/JAK2V617F- (n = 16), including CALR1 (n = 10, red), CALR2 (n = 2, green), MPL (n = 2, violet) and triple-negative (n = 2, blue) patients or (B) by high-molecular risk (HMR) mutations positive (n = 9) including ASXL1 (n = 8), U2AF1 (n = 1), SRSF2 (n = 1, coexisting with ASLX1) or negative (n = 21). Total cell, megakaryocyte (MK, CD61+) and mature MK (CD61/CD42+) count are shown. Student-t test with Welch´s correction, bars and error bars indicate mean and standard deviation (SD). (C) MF patients stratified into low (n = 5), intermediate (n = 17), and high (n = 8) risk groups according to MIPSS70 score. Total cell, MK (CD61+) and mature MK (CD61/CD42+) count are shown. One-way ANOVA followed by Tukey´s multiple comparison test. Bars and error bars indicate the mean and SD. Correlation between C-reactive protein (CRP) levels and (D) MK or (E) mature MK number are shown in JAK2V617F+ (n = 13)/JAK2V617F- (n = 14), including CALR1 (n = 9, red), CALR2 (n = 1, green), MPL (n = 2, violet) and triple-negative (n = 2, blue) patients, Pearson correlation.
Plasma from patients harboring HMR mutations, including ASXL1, SRSF2 and U2AF1, induced significantly higher total cell, MK and MMK count (Student-t test with Welch´s correction; Fig. 2B). Megakaryopoiesis was also influenced by the degree of disease progression, as patients in higher risk groups, as stratified according to the Mutation-Enhanced International Prognostic Score System (MIPSS70), displayed higher MK output than those classified into lower risk groups (One-way ANOVA followed by Tukey´s multiple comparison test; Fig. 2C).
C-Reactive Protein (CRP), an inflammatory marker, was elevated in this cohort (data not shown), as reported20. Correlation between CRP and both MK and MMK numbers was found (Pearson correlation, Fig. 2D–E), mirroring the effect of MF plasma on megakaryopoiesis and suggesting a direct relationship between the inflammatory state and MK output.
Plasma from MF induces its effect on MK precursors
To assess whether the stimulatory effect of soluble factors occurs at the level of CD34 + progenitors or is exerted on immature MK, CD34 + cells were cultured during 12 days and patient plasma was added since day 1, as described in the previous assays, or at day 6 of culture when progenitors were more differentiated under MK culture conditions. Addition of MF plasma at day 6 of culture yielded an increase in total cell, MK and MMK number, to a similar extent as that observed when samples were added since day 1 (p = ns, Wilcoxon test; Figure S2). These results suggest that the stimulating effect of MF plasma factors can be exerted on cells already committed to the MK lineage, and imply that at least some of the cytokines implicated in this process are directly involved in the regulation of megakaryopoiesis. Of note, an increase in MK count was evident when addition of plasma from healthy subjects was delayed until day 6 of culture (Wilcoxon test), suggesting that steady-state plasma factors may have an inhibitory effect on MK differentiation. In contrast to MF, plasma from ET patients behaved similarly to control plasma, increasing total cell count when plasma was added at day 6 compared to day 1 (Fig. S2).
Plasma from MF upregulate Cyclin D1 expression
To study the mechanisms involved in MK stimulation, expression levels of MK transcription factors RUNX1, GATA-1 and FLI-1, main genes involved in megakaryocytic differentiation, were assessed by qPCR. To this end, CD34 + progenitors were incubated in the presence of MF or control plasma during 9 days followed by mRNA extraction. No significant increase was found respect to control, indicating that exacerbated megakaryopoiesis is not due to deregulation of these transcription factors (Mann-Whitney test; Fig. 3A). Then, we investigated the possible role of cell cycle alterations by focusing on cyclin D1, which participates in G1 to S phase transition, and showed increased expression levels of this cell cycle regulator, suggesting it could be involved on this process (Mann-Whitney test; Fig. 3A).

Mechanisms involved in the regulation of megakaryocyte proliferation by myelofibrosis plasma. (A) RNA expression of transcription factors involved in megakaryopoiesis. CD34 + progenitor cells were cultured in the presence of 10% plasma of myelofibrosis (MF) patients during 9 days, and after that, RNA was obtained (n = 6). Expression levels of RUNX1, GATA-1, FLI-1 and Cyclin D1 were quantified using GAPDH as housekeeping gene by qPCR. Fold-change with respect to the control (C) was plotted, Mann-Whitney test. Bars and error bars indicate the median with interquartile range. (B–D) Inhibition of inflammatory signaling pathways. CD34 + progenitors were cultured in StemSpan supplemented with TPO during 6 days. At day 6 of culture, megakaryocyte (MK) were treated with (B) RO106 (NF-κΒ inhibitor), (C) UO126 (MAPK inhibitor) or (D) Ruxolitinib (JAK1/2 inhibitor) during 1 h, then 10% MF plasma was added (C = 3; MF = 3). Cells were counted at day 12 of culture. Repeated-measures one-way ANOVA followed by Tukey´s multiple comparison test. Bars and error bars indicate the mean and SD.
NF-κΒ and MAPK pathways are involved in MK stimulation induced by MF plasma
Previous data indicate that cyclin D1 could be regulated through stimulation of the MAPK and NF-kB pathway by inflammatory cytokines21,22,23. To deepen into the mechanisms underlying enhanced MK number triggered by MF plasma, we focused on inflammatory signaling networks. In addition to the JAK2 pathway, NF-κΒ and MAPK have been shown hyperactivated in MF patients15,16. To this end, inhibitors of the NF-κΒ (RO106), MAPK (UO126) and JAK1/2 (ruxolitinib) pathways were added to cell culture at day 6. After 90 min, MF plasma was added to the culture system and cells were counted at day 12. Addition of each of these inhibitors was able to revert the increase in cell counts triggered by MF plasma, indicating that exacerbated cell proliferation induced by MF plasma is dependent on all of these signaling pathways (MF plasma with inhibitors vs. control plasma, p = ns, One-way ANOVA followed by Tukey´s multiple comparison test; Fig. 3B–D). As expected, all three inhibitors decreased MK proliferation in cells incubated with control plasma (Fig. S3).
IL-1β and IL-6 participate in MF plasma-induced MK stimulation
NF-κB and MAPK are important mediators in the inflammatory pathways which are activated mainly by proinflammatory cytokines, including IL-1β and IL-6, respectively16,17,18. Considering their important role in the development of the megakaryocytic lineage, plasma levels of IL-1β and IL-6 were measured in patients with MF and ET. Circulating IL-1β and IL-6 were elevated in our MF cohort, while levels in ET were similar to the control group (Kruskal–Wallis followed by Dunn’s multiple comparisons test; Fig. 4A, E). Indeed, a close association was found between plasma levels of these cytokines and MF plasma-induced MK output (Spearman Correlation; Fig. 4C, G), suggesting their role in this observation. Of interest, levels of both cytokines were higher in patients stratified into higher MIPSS70 scores (Kruskal–Wallis followed by Dunn’s multiple comparisons or Mann Whitney test for IL1β, low + intermediate vs. high risk group; Fig. 4B, F), in accordance with the increased MK output induced in vitro by plasma samples from patients belonging to this risk group. To determine the contribution of these cytokines, specific blocking anti-IL-1β or anti-IL-6 antibodies were added to the culture system prior to incubating MK with MF plasma. A representative dose-response curve of both blocking antibodies is shown (Fig. S4) and further experiments were carried out using 50 µg/ml of each antibody. Inhibition of MK output was observed with both blocking antibodies, further reinforcing the participation of IL-1β and IL-6 in this phenotype (Wilcoxon test; Fig. 4D, H).

Relationship between IL-1β and IL-6 and megakaryocyte output. Plasma levels of (A) IL-1β and (E) IL-6 in myelofibrosis (MF, n = 30), essential thrombocythemia (ET, n = 16) and control (n = 10) samples quantified by ELISA, were plotted. Kruskal–Wallis followed by Dunn’s multiple comparisons test. Bars and error bars indicate the median and interquartile range. MF patients were grouped according to the MIPSS70 score and levels of plasma (B) IL-1β and (F) IL-6 were plotted. Kruskal–Wallis followed by Dunn’s multiple comparisons or Mann Whitney test (IL1β, low + intermediate vs. high risk group). Bars and error bars indicate the median with interquartile range. Spearman correlation between (C) IL-1β or (G) IL-6 and megakaryocyte (MK) count. Inhibition of megakaryopoiesis in MF plasma samples. IL-1β and IL-6 were blocked in plasma using specific antibodies prior to the addition of MF plasma samples to day 6 MK culture. At day 12, cells were counted in a Neubauer chamber. MF samples (n = 7) were incubated with blocking (D) IL-1β or (H) IL-6 (50 µg, +) antibodies and compared to the same plasma samples without previous incubation with the corresponding antibody (-). Wilcoxon test.
Soluble factors present in ET plasma induce exacerbated PPF from normal MK
To study the effect of soluble mediators from MF and ET patients on thrombopoiesis, we assessed the ability of plasma to induce PPF from MMK. To this end, CD34 + progenitors were cultured during 12 days in MK differentiation conditions, in the absence of plasma. Then, 10% of MF and ET patient plasma was added to the culture and incubated until day 15. Representative examples of MK forming proplatelets are shown (Fig. 5A). A significant increase in PPF was induced by ET patient plasma compared to control group (Kruskal–Wallis followed by Dunn’s multiple comparisons test; Fig. 5B), without differences between JAK2V617F-positive and negative patients (Mann-Whitney test; Fig. 5C). Although no significant increase in PPF was found in the presence of plasma from the overall MF cohort (Fig. 5B), samples from 11 (37%) of 30 MF patients induced exacerbated PPF (higher than mean plus 2SD of control). Of the 11 samples with increased PPF, two are post-ET MF and 9 primary MF. Interestingly, the ability of MPN plasma to induce PPF correlated with platelet counts in patient peripheral blood (Spearman Correlation; Fig. 5D). To analyze proplatelet morphology, the number of swellings and tips contained in each proplatelet were counted. Proplatelet processes displayed an increased number of swellings and tips when MK were incubated in the presence of ET samples respect to control and MF group (Kruskal–Wallis followed by Dunn’s multiple comparisons test; Fig. 5E). A representative example of control, ET and MF proplatelet-bearing MK is shown (Fig. 5F).

Proplatelet formation in the presence of plasma from myeloproliferative neoplasms patients. Cord blood-derived day 12 megakaryocyte (MK) were incubated with 10% plasma during 72 hs. (A) Example of a MK producing proplatelets (inverted microscope) in the presence of control, essential thrombocythemia (ET) and myelofibrosis (MF) samples. The arrows indicate MK producing proplatelets. (B) Proplatelet processes were counted in an inverted microscope and proplatelets-bearing MK (PPF) number was calculated and referred to total cell count (Neubauer chamber). Results are expressed as percentage of PPF (Control, n = 40; ET, n = 28; MF, n = 30). Red empty circles represent post-ET MF, pink empty circles represent post-PV MF, red filled circles represent primary MF. Kruskal–Wallis followed by Dunn’s multiple comparisons test. Bars and error bars indicate the median with interquartile range. The experiments were carried out in triplicate in independent umbilical cord blood samples. (C) Percentage of plasma-induced PPF, according to the JAK2V617F mutational status of the myeloproliferative neoplasms (MPN) patients (p = ns, Mann-Whitney test). (D) Correlation between plasma-induced PPF in culture and peripheral platelet count in MPN patients (Spearman correlation). (E) Proplatelet morphology in the presence of plasma samples. MK were seeded in fibrinogen-coated glass during 72 hs, incubated in the presence of control (n = 6), ET (n = 6) or MF (n = 6) plasma. Then, cells were labeled with Hoechst (nucleus, blue) and CD61-FITC antibody (green). Number of swelling and tips per proplatelet process were counted in at least 50 MK. Kruskal–Wallis followed by Dunn’s multiple comparisons test. Bars and error bars indicate the median with interquartile range. (F) Representative example of proplatelet-bearing MK incubated with control, ET and MF samples. Swelling and tip are pointed out. Scale bars, 20 μm.
RANTES and NFE2 are involved thrombopoiesis stimulation induced by ET plasma
Although there is limited information about the extracellular factors that regulate PPF, RANTES (CCL5) has been recently shown to be involved in this process3. To identify possible factors underlying the increase in PPF induced by ET plasma, we measured circulating levels of RANTES and found it elevated in ET patients compared to control (Kruskal–Wallis followed by Dunn’s multiple comparisons test; Fig. 6A). Indeed, RANTES levels displayed a close relationship with ET plasma-induced PPF in vitro (Spearman Correlation; Fig. 6B). Patients with MF showed variable levels of plasma RANTES, ranging from normal to elevated, which also directly correlated with PPF in culture (Spearman Correlation; Fig. 6C). Overall, the association between RANTES levels and PPF in both ET and MF suggests that RANTES is implicated in the alteration in PPF observed, independently of the specific MPN subtype. Of note, circulating RANTES levels also correlated with peripheral blood platelet count in MPN patients (Spearman Correlation; Fig. 6D).

Regulation of thrombopoiesis by essential thrombocythemia plasma. (A) Plasma RANTES was quantified in controls (n = 24), essential thrombocythemia (ET, n = 28) and myelofibrosis (MF, n = 20) patients by ELISA. Kruskal–Wallis followed by Dunn’s multiple comparisons test. Bars and error bars indicate the median with interquartile range. Correlation between RANTES levels and (B) ET or (C) MF plasma-induced proplatelet formation (PPF) (Spearman correlation). (D) Correlation between plasma RANTES and peripheral platelet count in myeloproliferative neoplasms patients (Spearman correlation). (E) Umbilical CD34 + progenitor cells cultured in StemSpan, and TPO (10 ng/ml) were treated on day 12 during 1 h with Maraviroc (100 nM) and incubated with 10% ET plasma (n = 3) during 72 h. PPF were counted in an inverted microscope and the percentage was calculated relative to total cell count (Neubauer chamber). Percentage of PPF was plotted. Dotted line represent mean control plasma value. Paired t-test. Bars and error bars indicate mean and SD values. (F) mRNA expression of transcription factors involved in thrombopoiesis. Mature megakaryocytes were cultured in the presence of 10% plasma of ET patients during 48hs and then, mRNA was obtained (n = 6). RANTES, Bcl-xL, NFE2a, NFE2f and RUNX1 gene expression levels were assessed by qPCR using GAPDH as housekeeping gene. Mann-Whitney test. Bars and error bars indicate the median with interquartile range.
To corroborate the effect of RANTES in ET plasma-induced enhanced PPF, MMK were pretreated with Maraviroc, a specific antagonist of RANTES receptor (CCR5), prior to the addition of ET plasma. Maraviroc was able to revert the increase in ET plasma-induced PPF, further reinforcing the participation of RANTES in this phenotype (Paired t-test; Fig. 6E). An inhibition in PPF was also observed when MMK were treated with Maraviroc and control plasma (Fig. S5).
To assess whether patient plasma induce RANTES deregulation in MMKs, we evaluated its expression in these cells incubated with ET samples. Interestingly, RANTES expression was upregulated in normal MK incubated with ET plasma, raising the possibility that circulating factors present in ET could stimulate RANTES MK synthesis in vivo, potentially contributing to elevated levels of RANTES in patient circulation (Mann-Whitney test; Fig. 6F).
Considering that RANTES was shown to regulate platelet production by apoptosis inhibition, we assessed the expression of Bcl-xL, an antiapoptotic factor known to play an essential role in thrombopoiesis3,24. Interestingly, we found increased Bcl-xL expression in MK incubated with ET plasma samples that induced an increase in PPF in culture (Mann-Whitney test; Fig. 6F), raising the possibility that higher RANTES levels present in patient plasma could contribute to Bcl-xL upregulation.
NFE2 is the main transcription factor involved in PPF. An increase of NFE2 expression was found in MK incubated with these ET samples, whereas RUNX1 expression, which also regulates PPF, was normal, suggesting that NFE2 but not RUNX1 could be involved in the increase in thrombopoiesis (Mann-Whitney test, Fig. 6F).