
Ethical and legal aspects
The study was conducted in accordance with the standards of Good Clinical Practice, the Declaration of Helsinki, and local legal and regulatory requirements, and was registered in the EU Clinical Trial Information System under EU CT number 2023-509178-44-00 on 19 April 2024. The study protocol was authorized by the Finnish Medicines Agency (Fimea) and can be found in the Supplementary Information. Written informed consent to participate was obtained from all participants before sampling. Participation in the study was voluntary and uncompensated.
Study population and sampling
This observational study was conducted in Finland by the Finnish Institute for Health and Welfare in collaboration with the Finnish Food Authority, HUS Diagnostic Center and University of Turku within the well-being services counties of Helsinki, Uusimaa, Kymenlaakso, southern Carelia, and southern, central and northern Ostrobothnia and Kainuu48.
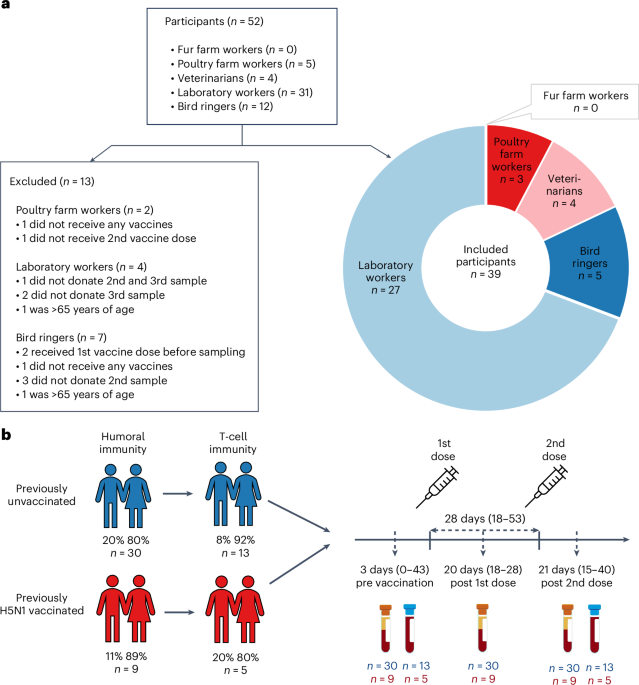
We invited individuals to whom the zoonotic influenza vaccine was recommended to participate in the study. Vaccination with the MF59-adjuvanted A(H5N8) influenza vaccine (clade 2.3.4.4b A/Astrakhan/3212/2020, Seqirus)16 was recommended to those at risk through direct or indirect exposure to infected animals including fur and poultry farm workers, veterinarians, bird ringers and laboratory personnel handling the avian influenza virus or samples that may contain the virus. The national vaccination campaign started in Finland in June 2024. Vaccines were offered in accordance with the national recommendations given by the Finnish Institute for Health and Welfare49 as a two-dose regimen with a minimum dose interval of 3 weeks. The vaccines were administered through routine healthcare services12.
The inclusion criteria for the study were: (1) age of 18–65 years, (2) belonging to the target group of the avian influenza vaccine, (3) intention to accept at least one dose of the avian influenza vaccine, (4) a native speaker of Finnish, Swedish or English, (5) home address in Finland, (6) ability to give samples 3 weeks after each dose, (7) preferably the ability to also participate in the follow-up samplings and (8) a written informed consent. The exclusion criteria were any medical contraindications to influenza vaccination and a history of anaphylactic reaction to any of the constituents or trace residues of the vaccine.
We invited all registered fur and poultry farmers in the well-being services counties of southern, central and northern Ostrobothnia and Kainuu by mail. Farmers were asked to forward invitation letters to their employees. We approached public sector veterinarians, bird ringers and laboratory workers at the Finnish Food Authority, Finnish Institute for Health and Welfare, Helsinki University Hospital and Diagnostic Center, Turku University Hospital and University of Turku, by sending an information letter about the study, and subsequently an invitation letter to those who expressed their interest to participate in the study. Participants were asked to donate a blood sample at their local laboratory center of the well-being services county during three study visits: baseline (within 14 days before the first vaccine dose) and 18–24 days after the first and second vaccine doses. We included two cohorts in the study: (1) participants belonging to the target groups for whom the avian influenza vaccine is recommended (targeted sample size 300) with no previous influenza (A)H5 vaccination history and (2) participants from cohort 1 who have previously received H5 influenza vaccines in 2009, 2011–2012 and/or 2018 (Fig. 1b and Extended Data Table 1).
The targeted sample size of 300 for the study cohort 1 was determined using the sample size formula:
$$n=\frac{{Z}^{2}\,\times \,p(1-p)}{{E}^{2}}$$
(1)
The calculation was based on a desired 95% confidence level (Z), an assumed seroprotection rate (SPR) of 75% (p) and a 5% margin of error (E). The result indicated a minimum sample size of 288 participants required to accurately estimate the proportion of participants achieving seroprotection. With this sample size, the lower limit of the 95% CI is ≥70%. The number of participants recruited to the study in 2024 remained significantly lower, which introduces uncertainty into the seroprotection assessment in this study.
We retrieved contact information of fur and poultry farmers from the Central Database for Animal Keepers and Establishments maintained by the Finnish Food Authority. Information on avian influenza vaccinations given during the study was retrieved from the Register of Primary Health Care Visits. Participants were additionally asked to submit information on previous avian influenza vaccinations, which had been previously recommended for a limited target group of laboratory workers and veterinarians in Finland. The vaccines used in 2009, 2011–2012 and 2018 were the pre-pandemic A(H5N1), inactivated, AS03-adjuvanted A/Indonesia/5/2005 (clade 2.1.3.2)-like split virion vaccine (3.75 µg HA, GlaxoSmithKline); A(H5N1), inactivated, adjuvant-free A/Vietnam/1203/2004 (clade 1)-like whole virus vaccine, (7.5 µg HA, Baxter) and A(H5N1), inactivated, MF59-adjuvanted A/turkey/Turkey/1/2005 (clade 2.2.1)-like strain (NIBRG-23) vaccine (7.5 µg HA, Novartis), respectively.
Serum samples were collected at baseline and after each vaccine dose from all participants. Blood for isolation of PBMCs was additionally collected from laboratory workers and veterinarians in Helsinki and Turku at baseline and after the second vaccine dose. All participants gave written informed consent before the collection of the first study sample.
The study was classified as a low-intervention clinical trial, as the only intervention was the collection of blood samples. No randomization was applied; all samples that met the predefined inclusion criteria were included in the analysis. Investigators were blinded to the identity of participants during all immunological analyses. For FMIA and HI assays, investigators were also blinded to the timing of sample collection with respect to vaccination. For microneutralization and cellular immunity assays, samples from different time points of the same individual were analysed in parallel within the same run to ensure comparability; therefore, the timing of these samples (pre vs post vaccination) was known to the investigators.
Cell culture
Cells for microneutralization (MN) assay
Madin–Darby canine kidney (MDCK) cells (ATCC-CCL-34, 1805449) were maintained in Eagle’s minimal essential medium with L-glutamine (L-Glu) and Earle’s balanced salt solution (EMEM, Gibco 6110087), containing 10% fetal bovine serum (FBS, Sigma-Aldrich), 1× non-essential amino acids (NEAA, Sigma-Aldrich), 1.1 g l−1 sodium hydrogen carbonate (CHNaCO3, Merck), 100 IU ml−1 penicillin (Pen, Sigma-Aldrich) and 100 mg ml−1 streptomycin (Strep, Sigma-Aldrich). Cells were tested to be mycoplasma negative, maintained at 37 °C at 5% CO2 and passaged twice per week.
Cells for HI assay
MDCK cells (ATCC-CRL-2935) were maintained in EMEM (Capricorn Scientific) with Earle’s balanced salt solution, containing 10% FBS, 1× NEAA (Capricorn Scientific), 1.5 mg ml−1 sodium bicarbonate (NaHCO3, Gibco), 10 mM 4-(2-hydroxyethyl)piperazine-1-ethane-sulfonic acid (HEPES, Capricorn Scientific), 100 IU ml−1 Pen (Capricorn Scientific), 100 mg ml−1 Strep (Capricorn Scientific) and 2 mM L-Glu (Capricorn Scientific). Human epithelial 293T cells (ATCC-CRL-3216) were maintained in Dulbecco modified Eagle’s medium, high glucose 4.5 g l−1 (DMEM, Capricorn Scientific) comprising 10% FBS, 1× NEAA, 1 mM sodium pyruvate (Gibco) supplemented with 2 mM L-Glu, 100 IU ml−1 Pen and 100 mg ml−1 Strep. Cells were tested to be mycoplasma negative, maintained at 37 °C at 5% CO2 and passaged twice per week (MDCK cells when confluent and 293T cells when sub-confluent). For 293T cells, 500 mg ml−1 geneticin (Gibco) was added to the medium during basal cell culture.
Viruses and antigens
Avian influenza virus strains used in MN and HI assays, and HA antigen used for FMIA are listed with background information in Extended Data Table 2. Antigens used as stimulants in the AIM assays are described below.
Virus propagation for MN
The A(H5N8) A/Astrakhan/3212/2020 candidate vaccine virus (CVV) with a modified protease cleavage site consistent with a low pathogenic phenotype (IDCDC-RG71A) was received by the Crick Worldwide Influenza Centre, London. The A(H5N1) A/blue fox/UH/004/2023 virus was isolated from a blue fox nasal sample during an outbreak in fur animals in Finland in 202350.
Virus strains used in MN assay were further propagated in MDCK cells and collected at the time of cytopathic effect between 50 and 75%. A tissue culture infectious dose of 50% (TCID50) was determined and calculated using the Reed–Muench method for each virus stock separately51 employing the same modified protocol as in the MN assay described below.
Generation of plasmids and recombinant viruses for the HI assay
Plasmids
The A(H5N1) A/Texas/37/2024 virus was isolated from a dairy farm worker in the USA during the cattle outbreak in 202452. The HA segment of A(H5N8) A/Astrakhan/3212/2020 was synthesized by Proteogenix. The HA genes were cloned into a reverse genetics plasmid (modified version of pHW2000) using the GeneArt Seamless Cloning kit (Thermo Fisher)53.
Recombinant virus production and sequencing
Recombinant viruses were produced using the eight-plasmid rescue system53. For the HI assay, recombinant viruses carrying seven gene segments of PR/8 high yield (HY)54 and the A(H5) HA segment of interest, without the multibasic cleavage site, were generated under biosafety level 2 (BSL2) conditions. Following virus rescue, virus production was evaluated using an HA assay with 1% turkey red blood cells (tRBCs) in phosphate buffered saline (PBS). Virus stocks were propagated in MDCK cells twice and HA gene sequences were verified by Sanger sequencing using the 3500xL Genetic Analyzer (Applied Biosystems). Accession numbers can be found in Extended Data Table 2.
MN assay
An enzyme-linked immunosorbent assay (ELISA)-based MN assay26,29,51 was further optimized for the conjugate and substrate steps in this study. Duplicate (technical replicate) heat-inactivated (56 °C, 30 min) serum samples were 2-fold serially diluted starting at 1:10 dilution in MN medium comprising OptiPro SFM medium (Gibco), supplemented with 0.2% bovine serumalbumin (BSA), 1× NEAA, Pen and Strep in a total volume of 50 μl. An equal volume of pre-titrated virus was added to obtain 100× TCID50 per well, following incubation for 1 h at 37 °C at 5% CO2. MDCK cells were detached, counted and added in a total volume of 100 μl (2.5 × 10⁴ cells per well), and the 96-well flat-base tissue culture plates (Sarstedt) were incubated at 37 °C at 5% CO2 for 18–20 h. Wells were washed once with PBS and fixed with ice-cold 80% acetone for 10 min.
The presence of influenza A virus in infected cells was detected by ELISA. Fixed plates were washed twice with washing buffer consisting of PBS containing 0.05% Tween 20 (Sigma-Aldrich). A horseradish peroxidase-labelled (HRP Conjugation Kit – Lightning-Link, Abcam) influenza A nucleoprotein-specific antibody (A7307, Medix Biochemica) was diluted 1:10,000 in PBS containing 5% milk and incubated (80 μl per well) at room temperature for 1 h. After washing six times with the washing buffer, 100 μl of substrate (1-Step TMB ELISA Substrate Solutions, Thermo Scientific) was added into each well and incubated at room temperature for 20 min in the dark. The reaction was stopped with 100 μl 2 N sulfuric acid. Absorbances were measured within 30 min at 450 nm and 620 nm.
The neutralizing endpoint was determined for each individual plate using the following equation51:
$$\begin{array}{rcl}\begin{array}{l}\times =({\rm{average}}\,{{\rm{OD}}}_{450}\,{\rm{of}}\,{\rm{virus}}\,{\rm{control}}\,{\rm{wells}})\\ \displaystyle \frac{+({\rm{average}}\,{{\rm{OD}}}_{450}\,{\rm{of}}\,{\rm{cell}}\,{\rm{control}}\,{\rm{wells}})}{2}\end{array}\end{array}$$
(2)
Results were expressed as titres corresponding to the reciprocal of the serum dilution that inhibited 50% of influenza infection. MN titre ≥10 was considered positive, and negative when it was <10. If the titre was <10, a titre of 5 was assigned for statistical calculations.
HI assay
Recombinant avian influenza viruses in the PR/8 HY background were tested using horse red blood cells (hRBCs) obtained from Cerba Research, Rotterdam, the Netherlands. hRBCs were used instead of the more commonly utilized tRBCs, due to their nearly exclusive expression of α2,3-sialic acid receptors on their surface, which are preferentially bound by avian influenza viruses21.
After collection, horse blood in citrate buffer was stored at 4 °C for up to 1 month. Before use, hRBCs were washed three times with PBS for 10 min at room temperature, followed by centrifugation at 754 × g. Final concentrations of 2% and 10% hRBCs were made in PBS.
Serum samples were absorbed with an equal volume of 10% hRBCs at 4 °C for 1 h, with mixing every 20 min to prevent non-specific agglutination. Subsequently, non-specific inhibition was avoided by incubating sera with in-house manufactured Vibrio cholerae filtrate comprising receptor destroying enzyme (RDE) at a 1:6 ratio (v/v) overnight at 37 °C following RDE inactivation at 56 °C for 1 h.
Post RDE inactivation, 2-fold serial dilutions of sera in 0.5% BSA (Sigma-Aldrich) in PBS (0.5% BSA–PBS) were prepared in 96-well V-bottom microtitre plates (Greiner) starting at a 1:20 dilution in a total volume of 50 μl. Viruses were adjusted to 4 haemagglutinating units (HAU) in 25 μl in PBS and added to each well. Plates were mixed and incubated at 37 °C for 30 min. Following this, 25 μl of 2% hRBCs was transferred to each well, plates were tapped individually, and HI titres were determined after a 1.5-h incubation at 4 °C. In case there was agglutination in the serum control well(s), the HI assay with the corresponding sera was repeated. Six serum samples were absorbed twice instead of once to remove non-specific agglutination. The HI titres were defined as the reciprocal of the last serum dilution in which hRBC agglutination was partially or completely inhibited. The detection limit entailed an HI titre of 10, which was assigned to those serum samples that revealed partial agglutination in the first well. If the titre was <10, a titre of 5 was assigned as the result. Data are presented on the basis of a single experiment.
Binding antibodies measured with FMIA
The binding of serum IgG to A(H5) was measured with FMIA adapted from an assay used in detection of SARS-CoV-2 antibodies55. Purified, commercially available A(H5N1) A/Michigan/90/2024 HA (REC32116, Native Antigen Company) at a concentration of 100 µg ml−1 was conjugated onto MagPlex-C superparamagnetic carboxylated beads (Luminex). Subsequently, 25 µl of beads diluted in PBS (pH 7.2) were added to black 96-well flat-base plates (Costar 3915, Corning) with 25 µl of serum diluted in PBS (pH 7.2 with 1% BSA, 0.8% polyvinylpyrrolidone, 0.5% poly(vinyl alcohol) and 0.1% Tween-20). The plates were incubated for 1 h. This and all subsequent incubations were performed at room temperature in the dark with shaking at 600 r.p.m. After washing with a magnetic plate washer (405TSRS, BioTek), 50 µl of 1:100 diluted IgG detection antibody (R-phycoerythrin-conjugated AffiniPure goat anti-human IgG Fcγ fragment-specific detection antibody, Jackson ImmunoResearch) was added and plates were incubated for 30 min. Following washing, 80 µl of PBS (pH 7.2) was added and plates were incubated for 5 min. Fluorescence was measured with a MAGPIX System (Luminex). Median fluorescence intensity was converted into FMIA U ml−1 by interpolation from 5-parameter logistic curves (xPONENT v.4.2, Luminex) created from a serially diluted (1:400–1:1,638,400) in-house reference pooled from the serum specimens of the present study. All plates were run in duplicates of in-house reference, blank and two control samples. All samples were analysed in 1:400 and 1:1,600 dilutions in duplicate, and results were calculated as the average of four wells. Samples with fluorescence exceeding the reference serum’s linear area were reanalysed using further dilutions.
Isolation and storage of PBMCs
Peripheral whole blood was collected using BD Vacutainer CPT mononuclear cell preparation tubes containing buffered sodium citrate (BD 362761). A total of 48 ml of whole blood was collected from each participant. PBMCs were isolated according to manufacturer instructions and washed two times with Ficoll salt solution. After isolation, PBMCs were counted with a Scepter 3.0 handheld automated cell counter using a 40-µm sensor. The average number of isolated PBMCs was 38 million. Isolated PBMCs were suspended to a concentration of 106 cells per ml in CryoStor CS10 medium (STEMCELL Technologies) and gradually cooled to −80 °C using a Corning CoolCell Freezing Container before being transferred to liquid nitrogen until further use.
AIM assay and flow cytometry
Avian influenza H1N1 and H5N8 HA, H5N8 NA and PR/8 NP-specific T cells were detected from peptide pool-stimulated PBMCs using an AIM assay as previously described56. In addition, the methodology for analysing the proportions of activated antigen-specific follicular T helper cells and memory T cell subtypes (naïve, Tem, Tef, Temra) has also been previously described57. PBMCs stored in −150 °C were rapidly thawed in a +37 °C water bath and transferred to 5 ml of culture medium (RPMI-1640, Lonza) supplemented with 10% heat-inactivated human AB serum (Sigma), 2 mM L-Glu (Gibco) and penicillin–streptomycin. PBMCs were washed by centrifuging the cells twice at 600 g for 10 min at +20 °C with fresh culture media. After washing, the viability of the thawed cells was assessed with a TC20 cell counter (Biorad). Cells were plated on a 96-well plate at 106 cells per well in 200 μl of media. Cells were stimulated with DMSO (equimolar, Sigma-Aldrich), tetanus toxoid (20 µg ml−1, AJ vaccines), SARS-CoV-2 JN.1 spike protein (1 µg ml−1, Pepmix, JPT peptides), H1 HA (2 µg ml−1), H5 HA (2 µg ml−1), N8 NA (2 µg ml−1) or PR/8 NP (2 µg ml−1; Pepmix, JPT peptides), peptide pools covering the whole proteins, after which the cells were incubated at 5% CO2, +37 °C for 72 h. Before choosing the optimal incubation, time and peptide concentrations pretesting was done with H5N8-vaccinated individuals. An equimolar amount of DMSO was used as a negative control stimulus. SARS-CoV-2 JN.1 and PR/8 NP peptide pools were 15-mers with 11-mer overlaps, and H1, H5 and N8 peptide pools were 15-mers with 10-mer overlaps synthetized by TC peptide Lab as crude material. The peptides were then pooled and sequentially lyophilised with the MegaPool approach58 and resuspended at a stock concentration of 1 mg ml−1.
After stimulation, cells were centrifuged at 600 g for 10 min at +20 °C and washed with FACS 1 buffer (PBS; 0.01% NaN3), followed by staining the cells with a cell viability dye (Zombie Green, BioLegend) diluted with FACS 1 buffer. After incubating the cells for 15 min in the dark at room temperature, fluorochrome-conjugated antibodies diluted in FACS 2 buffer (PBS, 2% FCS; 0.01% NaN3) were added (Extended Data Table 3). After incubating the cells for 30 min at +4 °C, cells were washed for 10 min at +20 °C with FACS 2 and FACS 1 buffers, followed by centrifugation at 600 g after each wash. After washing, the cells were fixed for 20 min with 4% formaldehyde in PBS. Finally, cells were washed and suspended with FACS 1 buffer, followed by acquisition with a BD LSRFortessa flow cytometer (BD Biosciences), and results were analysed with FlowJo 10.10.0. The AIM test stimulation index (SI) was calculated by dividing the percentage of peptide pool-stimulated CD4+/CD69+/CD134+ or CD8+/CD69+/CD137+ T cells by the DMSO-stimulated CD4+/CD69+/CD134+ or CD8+/CD69+/CD137+ T cells. Samples with less than 10,000 CD3+ cells were excluded from all analyses, and samples with less than 500 circulating T follicular helper (cTfh) CD4+ cells were excluded from cTfh cell analysis.
The assay was optimized by incubating PBMCs acquired from two vaccinated individuals pre and post vaccination for 48 and 72 h after stimulating with DMSO (equimolar), TET (20 µg ml−1), SARS-CoV-2 XBB.1.5 spike PepMix™ (0.5 µg ml−1; 1 µg ml−1; 2 µg ml−1 ; JPT peptides), H5 (1 µg ml−1; 2 µg ml−1, 4 µg ml−1, 8 µg ml−1) and H1 (1 µg ml−1; 2 µg ml−1, 4 µg ml−1, 8 µg ml−1), as described above.
IFNγ detection in PBMC supernatants using Luminex
The concentration of IFNγ secreted into the supernatants during the 72-h stimulation of the cell cultures was measured using a 96-well plate assay with the MILLIPLEX MAP Kit HCD8MAG-15K (Millipore)56. The fluorescence of the samples was measured using the Luminex MAGPIX magnetic bead analyser (Luminex). Samples that were within the linear range of the kit’s standard curve were given their measured concentration. Samples below the lowest standard in the linear range were given half the value of the standard (2.4 pg ml−1 for IFNγ), and samples above the highest standard were given the highest value of the standard (5,000 pg ml−1 for IFNγ). Standards with a standard deviation of less than 20% for the duplicates were accepted. According to the kit manufacturer, if there were less than 35 beads in the well, the samples could not be assigned a reliable concentration, hence those samples were discarded from the final analysis. Results were expressed as SI, defined as the ratio of IFNγ concentration after peptide pool or tetanus toxoid stimulation to the corresponding concentration after DMSO stimulation within the same sample. A stimulation response was considered positive if the IFNγ SI value measured in the sample exceeded the positive threshold (2 SI).
Statistical methods
Data analyses were performed with MS Excel v.2408, GraphPad Prism v.10.2.3 and 10.4.1, R v.4.2.1 and FlowJo v.10.10.0. P < 0.05 was considered statistically significant. All results are presented as descriptive statistics; statistical tests were performed without adjustment for multiple comparisons. For intra- and intergroup comparison, data were categorized into two groups according to vaccination history. Only data from participants who provided samples at the three different time points and received vaccinations in the correct order relative to sampling were included in the analysis of vaccine responses. Geometric means and 95% CIs were calculated for the neutralizing antibody titres, IgG antibody concentrations, T cell and IFNγ SIs. Fold changes were calculated from the geometric means of each group.
The Shapiro–Wilk normality test was used to determine whether data were normally distributed. Since MN and HI data were not normally distributed, the data were log2 transformed and non-parametric tests were used. As T cell data were not normally distributed, non-parametric tests were used. The Mann–Whitney U-test was used to compare differences between different groups, while the Wilcoxon matched-pairs signed-rank test was used for within-group comparisons across different time points. As IgG data were normally distributed, comparisons between groups were performed with a t-test. Correlation analyses were performed using the non-parametric Spearman rank correlation coefficient.
To assess the correlation of titres against A/Astrakhan/3212/2020 measured with MN and HI tests, data from all 142 samples that had results measured with both tests, including serum samples from participants who did not provide all three samples, were included. An HI titre of 40 is typically accepted to correspond to a 50% or more reduction in the risk of contracting an influenza infection or influenza disease59 and defined by both the US Food and Drug Administration and the European Medicines Agency Committee for Medicinal Products for Human Use as the primary correlate of protection60. To determine the MN titre corresponding to an HI titre of 40 against A/Astrakhan/3212/2020, the data were log2 transformed, and Spearman’s correlation was performed (r = 0.89, p < 0.0001). The Spearman correlation coefficient indicated a positive correlation between MN and HI titres. To further explore this relationship, regression analysis was conducted. A simple linear regression model was applied to assess the equivalence between MN and HI titres (R2 = 0.76, p < 0.0001), yielding the equation \(Y=0.9098x-0.4967\). Based on this model, an HI titre of 40 corresponds to an MN titre of 20. The percent SPR for each group was calculated as the number of seropositive samples (MN titres ≥20 or HI titres ≥40) divided by the number of samples ×100 in the group. Confidence intervals for SPRs were calculated with normal approximation to the binomial calculation.
Reporting summary
Further information on research design is available in the Nature Portfolio Reporting Summary linked to this article.