
Ethics approval and registration
The PERTH Trial has ethics approval from the University of Western Australia Human Research Ethics Committee; 2021-ET001118. The PERTH Trial is registered with the Australian and New Zealand Clinical Trials Registry under the following titles: ‘Sources of Exposure to Plastic-Associated Chemicals (PAC) in People living in the Perth Region’ (ACTRN12622001259730) and ‘Examining the effect of minimal plastics exposure strategies on Plastic-Associated Chemicals (PAC) Excretion in healthy adults’ (ACTRN12622001252707).
Study design
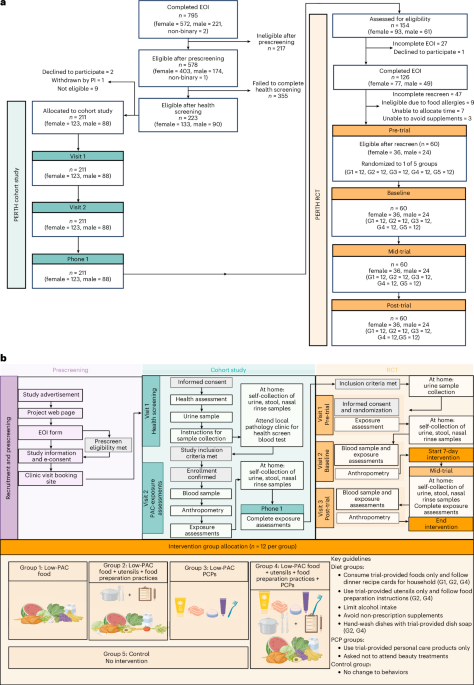
The PERTH Trial encompasses a prospective cohort study (N = 211) to estimate population exposure to PACs in healthy volunteers in Perth, Western Australia; and a follow-on 7-day RCT, comprising a subset (n = 60) of the PERTH cohort, which investigated whether PAC exposure could be decreased by changing participants’ diet and lifestyle. Ethical approval to conduct the studies was obtained from the University of Western Australia Human Research Ethics Committee; 2021-ET001118. The PERTH Trial is registered with the Australian and New Zealand Clinical Trials Registry under the following titles: ‘Sources of Exposure to Plastic-Associated Chemicals (PAC) in People living in the Perth Region’ (ACTRN12622001259730) and ‘Examining the effect of minimal plastics exposure strategies on Plastic-Associated Chemicals (PAC) Excretion in healthy adults’ (ACTRN126220012527070). All methods were carried out in accordance with the relevant guidelines and regulations, and informed consent was obtained from all participants.
Eligible participants were 18- to 60-year-old healthy adults with a BMI between 18.5 kg m−2 and 34.9 kg m−2. A participant with a BMI outside this range could be deemed eligible at the investigator’s discretion. General health was assessed by a comprehensive clinical assessment (detailed medical history and physical examination), electrocardiogram, vital signs and laboratory investigations (hematology, clinical chemistry, coagulation and urinalysis). Proof of immunization against COVID-19 (SARS-CoV-2), according to Health Department guidelines at the time of recruitment, was required, and participants gave written informed consent.
Exclusion criteria included a history of drug or alcohol misuse in the past 24 months (alcohol misuse was defined as >21 units per week for males, >14 units for females); current regular smoker or e-cigarette users (of note, social smokers of <3 nicotine/tobacco products in the last 3 months were able to be included if they abstained for the duration of the study); currently pregnant or planning pregnancy or breastfeeding during the study; acute infection, surgery, vaccination or other inflammatory process in the previous 2 weeks (minor procedures were exempt at the investigator’s discretion); evidence of moderate or greater renal impairment at screening, as indicated by an estimated Cr clearance of <60 ml min−1 using the Cockcroft–Gault equation; and clinically relevant abnormal laboratory tests, as determined by the investigator, not otherwise mentioned. Volunteers were also excluded for medical reasons not specified above, as determined by the investigator (Fig. 1a).
Outcomes of the PERTH RCT
The primary outcome of the PERTH RCT was the difference in urinary PAC levels between the control group (no intervention) and treatment groups at the post-intervention time point, after correcting for baseline measurements.
The prespecified exploratory outcomes of the PERTH RCT were changes in food group intake, energy and nutrient intake, dietary plastic exposures and urinary PAC levels from baseline to post-trial. Changes from baseline to post-trial in clinical blood biomarkers and body composition were post hoc exploratory outcomes, conducted for descriptive purposes.
Participant recruitment and randomization
PERTH cohort study (N = 211)
A PERTH Trial web page, social media, newspaper advertisements and physical posters promoted the cohort study. From the web page, willing participants completed an online expression of interest (EOI) form and eligibility questionnaire using an online Research Electronic Data Capture (REDCap) survey63. If eligible, participants received a Participant Information and Consent Form to enable informed consent electronically. Once consented, participants were contacted to discuss and book clinical visits.
PERTH RCT (n = 60)
PERTH cohort study participants (n = 154) were eligible for the RCT based on their putative exposure to PACs as measured by the PACeQ and urinary PAC excretion results. This was to ensure that the impacts of low-plastic interventions were measurable. Following data review, the study doctor or nurse contacted the participants and assessed their willingness to join the RCT. A short health ‘rescreen’ ensured ongoing eligibility for the RCT. Reasons for exclusion included food allergies (n = 9), unable to allocate time (n = 7) and unable to give up non-prescription supplements and medications (n = 3) (Fig. 1a). The 60 participants agreed to avoid makeup and alcohol for the intervention period and had the support of their households. Only one person per household could participate. Consent was confirmed at visit 1 (Fig. 1b), and participants each had an equal chance of randomized allocation to one of five groups (12 per group) using a block randomization tool in REDCap that supports stratified randomization (up to 14 fields) and ensures balanced groups. The personnel who enrolled and those who assigned participants to the intervention groups did not have access to the random allocation sequence.
Interventions and procedures
The study design is summarized in Fig. 1b.
PERTH cohort study
Cohort study participants underwent a series of assessments over five time points (Fig. 1b). At visit 1, the study doctor conducted a health screening including electrocardiogram, vital signs, urinalysis, BMI, waist-to-hip ratio and anthropometric measurements using a portable body composition analyzer (SECA m525). Participants received instructions and receptacles for collecting urine, stool and nasal washing samples; and a fasting blood request form for testing at their pathology provider. Following clinician review of the results, eligibility was confirmed. If any de novo clinical abnormality was detected during the health screening, the study doctor documented the findings in a letter to participants’ nominated general practitioner.
At visit 2, participants returned frozen samples collected the preceding day; provided a blood sample; and completed a sociodemographic questionnaire, the International Physical Activity Questionnaire—Short Form and three questionnaires developed by the research team: (1) PACeQ, (2) 24HR-PCP and (3) 24DR-PE. The latter was administered face-to-face by a research dietitian.
Participants received another set of sample receptacles for sampling Sunday (T2). The 24DR-PE was administered over a video call. During this call, the upcoming RCT was discussed with participants to gauge potential interest.
PACeQ
The PACeQ was developed by the research team to query dietary and lifestyle behaviors and environmental factors relating to plastic exposure34. The self-administered 87-item electronic questionnaire captured exposure via ingestion (46 items), absorption (14 items), inhalation (21 items) and inhalation/absorption combined (6 items). Research team members with relevant expertise explored existing literature for suitable questionnaires or items pertinent to direct human exposure to PACs and microplastics. Using a modified Delphi process, four experts provided commentary and reference material informing additional items. The questionnaire grew to 129 items, and a Likert scale for response categories was chosen. Two of the expert panel reviewed the 129-item questionnaire for item relevance, clarity and importance, and the research team removed redundant items by consensus. The final 87-item questionnaire was reviewed for syntactical errors and readability to age 14 years by an independent, suitably qualified person.
24DR-PE
The 24DR-PE33 is a dietitian administered, computer-assisted, 24-hour dietary interview (based on the Automated Multiple Pass Method64) that assessed dietary PAC exposure. Information was gathered from the participants on food and nutrient intake over the preceding 24 h. Additional information concerning purchasing, storage and preparation, based on empirical knowledge of potential PAC contamination from food packaging and processing65,66, was sought.
Data from the 24DR-PE were analyzed by food group intake using standardized serve sizes according to the Australian Dietary Guidelines35; inherent food properties associated with increased PACs (Food Properties Score); the use of high-risk processing and plastic packaging materials (Food Processing and Packaging Score); and a Total Dietary Plastics Score33. These indices provided a comprehensive framework for exploring associations between dietary factors and PAC exposure. The method detailing the 24DR-PE is published33.
The three 24DR-PEs from participants in the RCT were also entered into the Australian nutrient analysis program, Xyris Foodworks67, which enabled the assessment of energy (kilojoule), macronutrient and micronutrient intake and any changes over the intervention.
24HR-PCP
The 24HR-PCP is a self-administered, computer-assisted questionnaire that assessed PCP use over the preceding 24 h34. Developed by the research team, the automated, 5-min questionnaire queries potential PAC exposure through commonly used products: for example, dental products, skincare products, makeup, hair products, sun protection, nail polish, medicated creams and aerosols. Any exposures to dentists, hairdressers or beauticians on the day of sample collection were also captured. Each behavior reported was allocated one point. For example, use of both toothpaste and mouthwash in the preceding 24 h was allocated two points, and points were tallied to create a PCP score.
Blood samples
A blood draw of 60–70 ml delivered aliquots of whole blood, plasma, serum and peripheral blood mononuclear cells. One 6-ml glass vial (ethylenediaminetetraacetic acid or acid citrate dextrose) was retained for future plasticizer testing. Liquid samples were stored at −80 °C, and peripheral blood mononuclear cells were cryopreserved in vapor-phase liquid nitrogen.
Urine samples
To estimate the daily exposure of PACs in the cohort study and RCT, participants collected three urine samples at home or work, between the hours of 0600–1200, 1200–1800 and 1800–2400 (Fig. 1b and Supplementary Table 11). They froze their samples and returned them to the research site by courier or in person. Pooled daily samples were tested for PAC metabolites and normalized by urinary Cr level and specific gravity. PAC measurements corrected by urinary Cr or specific gravity were similarly distributed and highly correlated within cohort participants (Supplementary Fig. 4). As such, all summaries and analyses were performed using the Cr-adjusted PAC measurements.
Nasal lavage samples
To enable the quantitation of environmental dust and other airborne particles carrying phthalates and bisphenols, participants performed a nasal lavage (Fig. 1b and Supplementary Table 11). We adapted and standardized a technique used by other researchers68. Using a syringe containing sterile saline, participants flushed the nares and collected the eluate into a glass container using a stainless-steel funnel. The participants froze the samples and returned them with other samples they collected at the time.
Stool samples
A single stool sample was collected on ‘sampling’ days (Fig. 1b and Supplementary Table 12) into glass receptacles and again frozen. Samples remain stored at −80 °C for subsequent analysis of microplastic content and microbiome composition.
PERTH RCT
Participants enrolled in the RCT underwent a series of assessments over 14 time points. Consent and randomization took place at visit 1, and 1 week later the intervention, which was provided to the participant’s homes, commenced. This time allowed for the ordering, purchasing and delivery of fresh ‘low-plastic’ food to participants randomized to groups 1, 2 and 4. To minimize the possibility of behavior change between randomization (visit 1) and the baseline visit (visit 2), participants were instructed to maintain their usual diet and lifestyles in the community. Low-plastic kitchenware and/or PCPs were distributed at visit 2.
Low-plastic food intervention
Research dietitians worked with 100+ farmers, food producers and a local meal delivery service to screen and eliminate all modifiable sources of plastic in food from paddock to participants’ plates, within Australian food safety laws. Participants in groups 1, 2 and 4 selected from an electronic list of the screened and approved foods. Ten different dinner meal kits, including vegetarian options, and a general grocery list of foods and beverages for breakfast, lunch and snacks provided choice.
Selections and delivery details were dispatched to a dedicated meal delivery service contracted for the trial. This service agreed to modify their food-handling practices to accommodate the requirements of the trial. A trained pathologist collected samples for retrospective analysis. One sample of each food was collected and frozen and is stored in the research laboratory at −80 °C.
Meal delivery service
The meal delivery service replaced all plastic warehouse items, including tables, shelves, chopping boards and scales, with stainless-steel or glass alternatives. Once delivered from individual food suppliers, the PERTH Trial food was stored in a separate refrigerator or shelving unit. Each week, the meal delivery service packed meal kits and grocery items into insulated cardboard boxes lined with sheep’s wool to keep items cold. These boxes were then delivered directly to the participant’s home place the day before the intervention began and at other predetermined time points throughout the intervention, as required.
The meal delivery service staff all completed in-person training from the PERTH Trial research team, were provided with written instructions on how to minimize all potential PAC exposure and were able to call a PERTH Trial dietitian at any time with questions.
Instructions to participants
Participants received a schedule and instructions for the 7-day intervention and were contacted at preagreed times for assessments. The 24DR-PE conducted during the intervention week assessed adherence to the protocol and dietary evaluation of energy, macronutrient and micronutrient intake.
We advised participants to eat to appetite, consume only food provided, refrain from drinking alcohol and non-prescription supplements or medications and not purchase any foods or beverages. Group 1 participants were asked to consume the food provided and to carry on with their usual food-preparation habits, including the use of their own cookware and utensils.
Low-plastic kitchenware intervention
In addition to low-PAC food, participants in groups 2 and 4 were allocated plastic- and PAC-free cooking utensils and kitchenware. They received detailed instructions concerning storage, handling and preparation of food (Supplementary Document 1): for example, how to use a low-plastic dish bar instead of a dishwasher, the lining of fridge drawers and shelves with paper towels and microwaving only in glass containers. Cooking utensils and kitchenware provided were made from metal, glass or uncoated wood. Plant-based plastic alternatives and silicone products were avoided.
PCP intervention
Participants in groups 3 and 4 used exclusively PCPs screened by the research team using a standardized process. PCPs included, but were not limited to, shampoo, conditioner, face moisturizers, cleansers, sunscreens, deodorant, shavers, shaving cream, toothpowder, toothbrushes, dental floss, lip balm, tampons and period underwear. Participants were asked to refrain from wearing makeup and using any products not provided.
Control group (no intervention)
Participants in the control group were asked not to change any of their usual dietary or lifestyle behaviors but underwent the same assessments as the intervention groups.
Safety monitoring
Adverse events were defined in the study protocol as any untoward or unfavorable medical occurrence in a participant and were monitored from the start of the intervention period to end of study. Documentation of each applicable adverse event was recorded on the REDCap Case Report Form, with adverse event severity assessed by the principal investigator or delegate. In the case of a severe adverse event, the principal investigator or delegate reported to the trial sponsor within 24 h of becoming aware of the event. All other adverse events are reported annually or as required by the University of Western Australia Human Research Ethics Committee. Events prior to the study intervention, but after signing informed consent, were captured as medical history, as appropriate. Adverse events reported to the study team after this time were included at the investigators’ discretion.
The PERTH Trial had an independent Data Safety Monitoring Board comprising external clinicians and researchers. Written reports and face-to-face meetings were held between the PERTH Trial investigators and the Data Safety Monitoring Board. The PERTH observational cohort study and pilot RCT were reviewed and approved by all members of the Data Safety Monitoring Board.
Assessment of urinary and nasal PAC levels
Quantification of urinary bisphenol and phthalate metabolites
Specific gravity and Cr were measured in all urine samples to account for varying dilution between samples and allow for the normalization of PAC measures. Each single urine measure was subaliquoted into glass tubes for storage at −80 °C. Equal volumes of each multiple daily urine measure were subaliquoted and pooled in glass tubes for storage at −80 °C. The Queensland Alliance for Environmental Health Sciences Laboratory measured phthalate metabolites and bisphenol analogues in urine samples. A dilute-and-shoot method was employed to quantify the target chemicals in the urine samples using a SCIEX Triple Quad 7500 liquid chromatography coupled with a tandem mass spectrometer (LC-MS/MS) System – QTRAP Ready. The details of the chemicals quantified are listed in Supplementary Table 13.
Bisphenols and phthalates in nasal lavage samples
Frozen nasal lavage samples were analyzed by ChemCentre in Perth, Western Australia, for measurement of dimethyl phthalate, diethyl phthalate, diisobutyl phthalate, DnBP, di-n-pentyl phthalate, di-n-hexyl phthalate, benzyl butyl phthalate, DEHP, di-n-octyl phthalate, DNP, diisodecyl phthalate, BPA, bisphenol F and BPS. Samples were extracted with hexane:ethyl acetate (1:1) solvent and cleaned up with florisil. The extracts were blown to dryness before derivitizing the bisphenols with N,O-bis-(trimethylsilyl)trifluoroacetamide. The final extracts were analyzed by gas chromatography-tandem mass spectrometry. The validation was based on the method described by Velázquez-Gómez and colleagues68.
Clinical blood biomarker analysis
In addition to physical examination, the participants’ health was assessed using 68 blood tests that covered a broad range of physiological systems, including renal, liver, apolipoproteins, lipids androgens, metabolic, hematology, serum immunoglobulins and iron studies. The homeostatic model assessment of insulin resistance (HOMA-IR) was calculated using fasting plasma glucose and insulin measures according to the formula69 fasting insulin (mU l−1) × fasting serum glucose (mmol l−1)/22.5.
Data treatment for modeling urinary metabolites
Urinary levels of the phthalate metabolites and bisphenol analogues below the level of detection were assigned a value of LOD/\(\sqrt{2}\) recommended by the National Health and Nutrition Examination Survey (NHANES)70. Uncorrected, specific-gravity-corrected and Cr-corrected geometric means, distributions, and detection frequencies were calculated for each of the urinary PACs. To approximate DEHP exposure, we calculated a summary metric (ΣDEHP) equal to the molar sum of four DEHP metabolites: MEHP, MEHHP, MEOHP and MECPP. This single variable (ΣDEHP) was created by dividing each metabolite level by its molecular weight and then summing and multiplying by the molecular weight of DEHP: (([MEHP] ÷ 278.348) + ([MEHHP] ÷ 294.347) + ([MEOHP] ÷ 292.331) + ([MECPP] ÷ 308.33)) × 390.5561. Urinary PAC levels and summary values are reported in µg g−1 of Cr within this manuscript. To avoid bias in associations among PACs below the LOD, only the phthalate metabolites and bisphenol analogues that were detected in at least 80% of the samples were modeled.
EDI
Calculations of EDI were estimated for BPA, DEHP, DnBP, benzyl butyl phthalate and diethyl phthalate using the geometric means of the measured PAC levels and published values of fractional excretion for the parental chemicals71. Calculations of EDI for BPA used the method described by Lakind and Naiman72. Data used from the National Center for Health Statistics (USA) was from the 2015–2016 collection for bisphenols62 and 2017–2019 collection for phthalates61.
Statistical analysis
Sample sizes
PERTH cohort study
Based on recommendations from the Clinical and Laboratory Standards Institute73 citing a sample size of at least n = 120 to develop a reference range, and then allowing for substantial dropouts in the analysis, we collected a convenience sample of 211 participants.
PERTH RCT
The RCT sample size of 12 participants per group (n = 60 in total) was considered adequate for a feasibility study74. Given the absence of comparable low-plastic diet and lifestyle interventions to date, the sample size was chosen pragmatically, without calculation, to allow assessment of recruitment rates, data collection procedures and the variability of key outcome measures. The multiple-comparison testing conducted on RCT data is exploratory, conducted to test hypotheses and not to provide confirmatory findings.
Handling of missing data
Missing values accounted for less than 4% of the total data, attributed almost exclusively to FMI in the observational cohort (n = 8). Six of these eight participants proceeded to the RCT and provided FMI measures at baseline. As such, baseline RCT FMI measures from these six participants were used in the observational cohort modeling. Therefore, only two participants had missing data, and these were excluded from all observational cohort modeling to allow for a consistent sample of n = 209 across all analyses. Given the small number of missing data (n = 2), they were not considered to have a substantial impact on the results.
Descriptive statistics
Patient characteristics were summarized with means and standard deviations and counts and percentages, as appropriate.
Sex and gender variables
The online EOI form collected self-selected sex. At enrollment, participants were asked for self-identified gender. We did not ask participants to report sex assigned at birth. For analyses, we derived an analytic sex variable from measured serum testosterone, using adult reference ranges and requiring concordant classification at both time points. One participant self-identified as female and had testosterone within the typical adult male range at both time points and was coded as male for summaries and analyses involving the sex variable.
In these studies, we determined that chemical exposure affects individuals across both sex and gender. We present disaggregated data for this exposure on the basis of sex, due to the predominance of sex and gender correspondence in this cohort. The title of our manuscript indicates the effect of a low-plastic intervention on a cohort of mixed sexes and genders.
PERTH cohort study
Urinary and nasal PAC levels
The number and percent of participants with detectable PAC levels are summarized. Detectable PAC levels were skewed and so were summarized with geometric means (GMEANs), geometric standard deviations (GSDs) and the 75% and 95% percentiles. Furthermore, the intraclass correlation coefficient was calculated using urinary PAC levels measured during the two visits. The nasal lavage detection rates were low, and as such only summaries are provided for these. Phthalate metabolites and bisphenol analogue levels were assumed to be log-normally distributed and were summarized with GMEANs and GSDs.
Dietary and PCP behaviors and urinary PAC levels
Linear mixed models with a random intercept for individual were used to assess the relationships between potential exposures of food group serves, Total Dietary Plastic Scores, Food Properties Scores, Food Processing and Packaging Scores and PCP scores with urinary PAC levels. Having two time points enabled us to focus on within-person effects, using person-mean centering75, of these potential exposures that were measured on both occasions. Two models were conducted, both adjusted for age, sex and FMI76. The first model considered each potential exposure in its own model, and these were called the single-exposure models; the second included all exposures within the same class (for example, all the food group variables in one model), referred to as the multiple-exposure models. Additionally, another model was conducted that extended the multiple-exposure model to also adjust for income, education and marital status77.
Microwaving within the food processing and packaging exposures, as well as nail polish and beauty salon, hairdresser and dental treatments in the PCP exposure categories, were potential exposures that were not sufficiently frequent in the cohort study to support meaningful statistical analysis, so those potential variables of exposure were not modeled.
Cluster analysis of PACeQ responses
The results of the PACeQ questionnaire were analyzed with factor analysis to identify potential underlying latent factors that could explain correlations between observed variables. Factor analysis of mixed data (FAMD) was performed, as it is designed for datasets that can contain both quantitative (continuous) and qualitative (categorical) variables. In this investigation, we used the FAMD implementation provided by the FAMD function of the FactoMineR (v.2.11) package in R.
Subsequently, hierarchical clustering on principal components was performed on the outcomes of the FAMD analysis, relying on the HCPC function of the FactoMineR (v.2.11) package in R. In more detail, the trees were built using the Manhattan’s distance, which is a robust method for the analysis of mixed ordinal and categorical data, presented in the PACeQ questionnaire. Clustering was performed using the unweighted pair group method with arithmetic mean. More information on these approaches is described in Supplementary Document 2.
This analysis step revealed that, according to the profiles emerging from the PACeQ questionnaire, the participants could be partitioned into four clusters. Clusters were tested for evidence of enrichment in participants’ contemporaneous urinary levels of bisphenol and phthalate metabolites. Each continuous variable (PAC level) was partitioned. In this case, the variables were first standardized, and subsequently their values were partitioned into sextiles. The four clusters were then analyzed to test whether they were enriched for any value’s extreme top and bottom sextiles. Where such enrichment was detected, Barnard’s unconditional test was used on each cluster to estimate the randomness of the level of the possible enrichment.
Body composition and urinary PAC levels
Linear regression models were used to assess the relationships between body composition measures and urinary PAC levels measured at the visit time point. Our modeling considered the log-transformed PAC levels as the outcome and body composition measures as the predictors in separate models. These single-exposure models adjusted for age and sex76. An additional model was performed that also adjusted for income, education and marital status77.
Urinary PAC levels and clinical blood biomarkers
Linear regression models were used to assess the relationship between log-transformed urinary PAC levels as predictors and clinical blood biomarkers as the outcomes, measured at the first visit time point. Lp(a) and hsCRP included a large proportion of observations that were below the level of detection; as such, these were modeled with Tobit models that account for censorship, enabling the assessment and interpretation of associations in a way similar to the other blood biomarkers that were modeled. Apolipoprotein A1, HDL cholesterol, triglycerides, Lp(a), hsCRP and HOMA-IR were loge transformed prior to modeling, so coefficients associated with those outcomes are interpreted multiplicatively. Other blood biomarkers and adiposity measures were standardized to enable the estimation of regression coefficients that represent a standard deviation unit of change. Two models were considered. The first were single-exposure models, where each PAC was modeled separately. The second were multiple-exposure models, where multiple PACs were considered in the same model. In the multiple-exposure models, only MEP, MiBP, MnBP, MCPP, MBzP, ΣDEHP, BPA and BPS were included, to avoid collinearity with individual DEHP metabolites and Σbisphenols. Both the single-exposure and multiple-exposure models adjusted for age, sex and FMI. Additionally, the multiple-exposure model was extended to also adjust for income, education and marital status.
PERTH RCT
Changes between the baseline and post-intervention time points in modifiable (Food Processing and Packaging Score), non-modifiable (Food Properties Score) and Total Dietary Plastic Scores as well as energy, sodium, saturated fat and food group serve intake within individuals by treatment group were prespecified and assessed with paired t-tests. Given the small sample size in each group (n = 12), we applied non-parametric bootstrapping (9,999 resamples) to obtain more robust estimates of the confidence intervals and P values associated with the mean differences. CIs were calculated using the percentile method.
Similarly, urinary PAC levels were also tested for within individual changes between baseline and post-intervention across the five groups using bootstrapped, paired t-tests. Changes in individual PAC levels between the prerandomization and baseline time points were compared using the same methodology to verify that excreted PAC levels were stable prior to the intervention. Finally, due to the categorical nature of the data that resulted from the PACeQ questionnaire, no meaningful comparisons could be conducted between the prerandomization and baseline time points to assess whether participants had changed behavior.
The nasal lavage samples did not have a high enough detection frequency to enable statistical analysis consistent with the urinary PACs.
To estimate the primary outcome of the intervention study, linear mixed models with random intercepts for each participant were fitted to each urinary PAC level. These models used log-baseline PAC levels as a covariate and assessed the treatment group by time interaction78. This provided estimates of the primary outcome: the difference between the control and treatment groups at the post-intervention time point. As the PAC levels were logged, the control–treatment group contrasts are reported as percentage changes, along with 95% CIs.
Changes from baseline to post-trial in exploratory outcomes, including food group intake, energy and nutrient intake, dietary plastic exposures and urinary PAC levels, were prespecified in our trial protocol to supplement the primary outcome. However, changes from baseline to post-trial in clinical blood biomarkers and body composition were post hoc analyses conducted for descriptive purposes. No analyses were conducted on nasal lavage samples due to too-low detection rates.
Statistical analyses of urinary PAC levels were summarized as measured at baseline, during and at the end of the intervention, as well as differences between these time points in the five study arms with 12 participants in each, using means and standard deviations (Fig. 5b).
Common statistical methods
A large number of statistical tests were conducted to explore associations between the urinary excretion of 20 PACs and many potential predictors in the cohort study, as well as to compare the four intervention groups with the control group in the RCT. This breadth of testing increased the likelihood of chance findings. This study is exploratory in nature and represents a comprehensive assessment of plastic exposure through inhalation, ingestion and dermal absorption, alongside the contemporaneous excretion of urinary plastic chemical metabolites, body composition data and clinical cardiometabolic biomarkers.
Consequently, the aim was not to draw strong confirmatory conclusions but to identify potential patterns and generate hypotheses for future research. Applying strict multiple-comparison corrections would be overly conservative in this context and could obscure meaningful signals worth further investigation. Therefore, no formal correction for multiple comparisons was applied in the main body of the manuscript, where two-sided P values < 0.05 were used to assess statistical evidence for individual hypothesis tests; as such, all P values should be interpreted with appropriate caution. We provide the reader with q-values in the Supplementary Information that control for the false discovery rates79 in the fully adjusted, multiple-exposure models within PAC-specific hypothesis families, further segmented by between and within groupings of the exposures. Associations with q-values < 0.05 were considered to provide strong evidence after FDR correction, and associations with q-values between 0.05 and 0.20 were considered exploratory and hypothesis-generating.
All statistical analysis was performed using R (version 4.3.1, R Foundation for Statistical Computing).
Reporting summary
Further information on research design is available in the Nature Portfolio Reporting Summary linked to this article.