
Patient Characteristics
Five hundred and seventy-seven patients were enroled into the analysis, excluding 85 patients including 56 lacking post-transplant immune reconstitution data, 27 death within 1 month post-transplant and 2 without follow-up. AML accounted for 298 cases (51.6%), ALL for 104 (18.0%), MDS for 102 (17.7%) and NHL for 73 (12.7%). The median ages of patients and donors were 40 years (range: 6–71) and 32 years (range: 8–69), respectively. A total of 170 patients received ATG-based regimen, 340 received low-dose ATG plus low-dose PT-Cy-based regimen, and the remaining 67 were treated with PT-Cy-based regimen for GVHD prophylaxis. At transplantation, 445 patients were in complete remission, while 132 patients presented with active disease. The baseline characteristics of the cohort are summarised in Table 1.
Transplant outcomes
All enroled patients achieved successful engraftment, and those with active disease at transplantation achieved complete remission post-transplant. After a median follow-up of 24 months (range: 1–88 months), the 5-year OS was 72.0% (95% CI: 67.3–77%, n = 137). The 5-year of TRM was 14.7% (95% CI:10.1–19.0%, n = 64), while the 5-year cumulative incidence of relapse 21.7% (95% CI: 17.8–25.4%, n = 108). The cumulative incidence of grade I–IV aGVHD was 30.9% (95% CI:27.0–34.6%, n = 178), while grade II–IV aGVHD occurred in 14.7% of patients (95% CI:11.6–17.7%,n = 76). The 2-year cumulative incidence of moderate-to-severe cGVHD was 21.7% (95% CI: 18.0–25.1%, n = 114). Within 100 days post-transplantation, the cumulative incidence of CMV reactivation was 34.3% (95% CI:30.3–38.2%, n = 192), and EBV reactivation was 38.8% (95% CI: 34.6–42.7%, n = 216).
Lymphocyte subset reconstitution
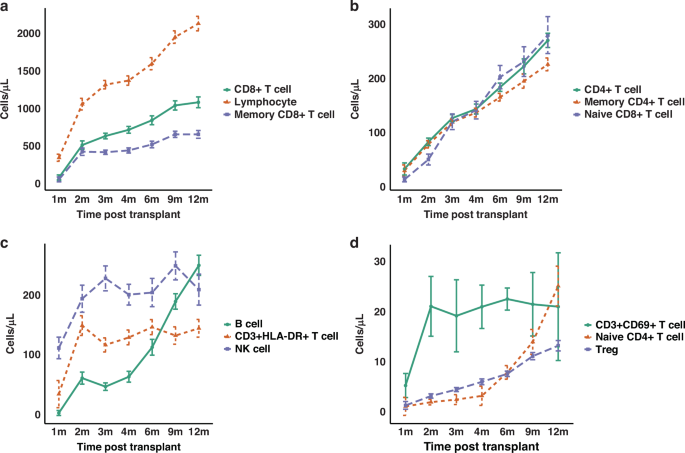
Distinct reconstitution patterns were observed across lymphocyte subsets post-transplantation. Total lymphocytes showed the fastest and strongest recovery, surpassing 2000 cells/μL at 12 months, whereas CD8+ T cells and memory CD8+ T cells exhibited a more gradual recovery trajectory (Fig. 1a). CD4+ T cells, memory CD4+ T cells and naïve CD8+ T cells demonstrated synchronised, linear increases, with CD4+ T cells and naïve CD8+ T cells reaching comparable levels (~270 cells/μL) at 12 months, although memory CD4+ T cells expanded more slowly in the later phase (Fig. 1b). CD3+HLA-DR+ late-activated T cells showed rapid and sustained reconstitution, while NK cells peaked early and fluctuated moderately thereafter. B cells displayed delayed but robust reconstitution, indicative of prolonged maturation processes (Fig. 1c). Early-activated CD3+CD69+ T cells expanded rapidly shortly after transplantation, whereas naïve CD4+ T cells increased sharply after 6 months, suggesting thymic regeneration. Tregs showed gradual, steady growth throughout the follow-up period (Fig. 1d). Additionally, a marked inversion of the CD4/CD8 T cell ratio was observed in the early post-transplant period, reaching its lowest median value at month 2 (0.16), followed by a gradual recovery over time. Specifically, the median CD4/CD8 ratio was 0.40, 0.16, 0.20, 0.21, 0.21, 0.23 and 0.25 at months 1, 2, 3, 4, 6, 9 and 12, respectively.

Median absolute counts (cells/μL) of each lymphocyte subset were plotted over time from 1 to 12 months post-transplantation. a Total lymphocytes, CD8⁺ T cells and memory CD8⁺ T cells. b CD4⁺ T cells, memory CD4⁺ T cells, and naïve CD8⁺ T cells. c CD3⁺HLA-DR⁺ late-activated T cells, NK cells, and B cells. d CD3⁺CD69⁺ early-activated T cells, naïve CD4⁺ T cells, and regulatory T cells (Tregs).
Impact of GVHD prophylaxis on immune reconstitution and outcomes
We further compared lymphocyte reconstitution across the three GVHD prophylaxis regimens (ATG + PT-Cy, ATG alone and PT-Cy alone). As shown in Fig. S1, prophylaxis significantly affected the recovery of several subsets at multiple time points. PT-Cy alone was associated with higher counts of naïve CD4⁺ T cells, naïve CD8⁺ T cells and Tregs from the early to late phases (1–12 months), whereas ATG alone showed higher early NK-cell counts (particularly at 1–2 months). Importantly, despite these effects on reconstitution, the prophylaxis regimens themselves did not influence OS, TRM, or RR in this cohort (all p > 0.05).
CD4+ T cell reconstitution and survival outcomes
Superior CD4+ T cell recovery at 4 months correlated with improved OS (Fig. S2A, Table 2), and better reconstitution at 9 months was associated with reduced RR (Fig. S2C, Table 4). Among CD4+ T cell subsets, enhanced naïve CD4+ T cell counts at 1 month reduced RR (Fig. S2C, Table 4). Higher memory CD4+ T cell counts at 4 months improved OS (Fig. S2A, Table 2), while higher AC at 9 and 12 months correlated with decreased relapse risk (Fig. S2C, Table 4). Furthermore, superior reconstitution of Tregs at 1, 2 and 4 months significantly reduced TRM, thereby improving OS (Fig. 2a, S2A, B, Tables 2, 3).

a Tregs: cumulative incidence of TRM at 1 and 2 months, and OS at 1 and 2 months, stratified by median Treg counts. b B cells: cumulative incidence of TRM at 4 and 6 months, and OS at 4 and 6 months, stratified by median B-cell counts. c Naïve CD8⁺ T cells: cumulative incidence of RR at 4 months, TRM at 9 months and OS at 9 months, stratified by median naïve CD8⁺ T-cell counts. d CD3⁺CD69⁺ T cells: cumulative incidence of RR at 12 months, stratified by median CD3⁺CD69⁺ T-cell counts. At each indicated month, subsets were dichotomised by the median absolute count (cells/μL). P values shown in each panel are from multivariable Cox proportional hazards models. Curves are displayed as Kaplan–Meier (OS) or cumulative incidence (TRM/RR) for visualisation; OS panels include numbers at risk, and TRM/RR panels include cumulative numbers of events. Shaded areas represent 95% confidence intervals, and tick marks indicate censoring. OS overall survival, TRM transplant-related mortality, RR relapse rate.
CD8+ T Cell Reconstitution and Survival Outcomes
Higher CD8+ T cell AC at 9 months post-transplantation was associated with better OS (Fig. S2A, Table 2), and higher counts at 9 and 12 months correlated with lower relapse risk (Fig. S2C, Table 4). For CD8+ T cell subsets, superior reconstitution of naïve CD8+ T cells at 1, 3 and 9 months significantly reduced TRM (Fig. 2c and Fig. S2B, Table 3), and better reconstitution at 4 and 9 months improved OS (Fig. 2c and Fig. S2A, Table 2). Moreover, higher naïve CD8+ T cell AC at 4 months was significantly associated with reduced RR (Fig. 2c, Table 4).
B cell reconstitution and survival outcomes
Enhanced B cell reconstitution at 2, 3, 4, 6 and 9 months post-transplantation was associated with significantly lower TRM (Fig. 2b and Fig. S2B, Table 3). Additionally, higher B cell counts at 4 and 6 months correlated with improved OS (Fig. 2b, Table 2).
Other subsets reconstitution and survival outcomes
Better NK cell reconstitution at 2 months was associated with reduced TRM (Fig. S2B, Table 3), and superior NK cell counts at 9 months improved OS (Fig. S2A, Table 2). Additionally, higher CD3+CD69+ T cell counts at 9 and 12 months correlated significantly with lower RR (Fig. 2d and Fig. S2C, Table 4). Figure 3 summarises the lymphocyte subsets significantly associated with transplant outcomes at each post-transplantation time point. For completeness, the full results of the univariate and multivariate analyses for all lymphocyte subsets at each time point, including non-significant findings, are provided in Tables S1–S18. Moreover, in sensitivity analyses treating subsets as continuous variables, the overall patterns were highly consistent with the median-based findings (Tables S19–S21).

Each coloured symbol represents a statistically significant association between a given lymphocyte subset and clinical outcome. White bars indicate reduced TRM, black bars indicate reduced relapse risk and green circles indicate improved OS. Outcomes are mapped across time points (1–12 months) for each lymphocyte subset. TRM transplant-related mortality, OS overall survival.
Influence of lymphocyte subsets on other transplant outcomes
We further investigated whether lymphocyte reconstitution influenced post-transplant complications that may contribute to TRM, including viral reactivations and GVHD. Cox analyses showed that superior Treg reconstitution at 1 and 2 months was associated with a lower risk of early CMV reactivation. At 1 month, CMV reactivation within 100 days occurred in 19.7% (95% CI, 10.3–28.2%) of patients with Treg > median versus 34.2% (22.6–44.1%) with Treg ≤ median; letermovir prophylaxis itself was strongly protective (HR 0.20, 95% CI 0.09–0.45; p < 0.001), and higher Treg counts remained independently protective after adjustment (HR 0.49, 95% CI 0.26–0.94; p = 0.032; Fig. 4a, Table S22). At 2 months, the corresponding incidences were 5.7% (1.2–10.1%) vs 24.7% (15.6–32.9%), and Treg reconstitution continued to show an independent association (HR 0.22, 95% CI 0.09–0.55; p = 0.001; Fig. 4a), while letermovir also remained significant (HR 0.37, 95% CI 0.16–0.87; p = 0.022, Table S23). In univariate analyses, NK reconstitution at 2 months was associated with a lower risk of CMV reactivation; the 100-day cumulative incidence was 9.6% (95% CI, 4.0–14.8%) in NK > median versus 19.5% (11.8–26.4%) in NK ≤ median (HR 0.47, 95% CI 0.23–0.96; p = 0.039). However, after adjustment for letermovir and other covariates, this association was attenuated and became non-significant (HR 0.59, 95% CI 0.23–1.53; p = 0.279, Table S23). In contrast, we did not find any association between early B cell or naïve CD8+ T cell reconstitution and CMV reactivation, nor did we observe any correlation between lymphocyte subsets reconstitution and EBV reactivation. Furthermore, early reconstitution of the above-mentioned lymphocyte subsets showed no significant correlation with the incidence of grades I–IV or II–IV aGVHD.

a Cumulative incidence of CMV reactivation stratified by Treg reconstitution at 1 and 2 months (dichotomised by the median absolute count, cells/μL). P values are from multivariable cause-specific Cox models adjusted as specified in Methods (including letermovir prophylaxis). b Cumulative incidence of moderate-to-severe cGVHD according to B-cell reconstitution at 6 and 9 months (median split). P values are from multivariable cause-specific Cox models that include systemic steroid use and other prespecified covariates (Methods). c Comparison of Treg absolute counts measured prior to CMV reactivation between patients with and without early CMV reactivation (bars show mean ± SEM). P values are from Wilcoxon rank-sum tests. d Comparison of B-cell absolute counts at 6 and 9 months (measured prior to clinical cGVHD) between patients with and without subsequent moderate-to-severe cGVHD (mean ± SEM). P values are from Wilcoxon rank-sum tests. Asterisks denote statistical significance: P < 0.05 (*), P < 0.01 (**), P < 0.001 (***). CMV cytomegalovirus, cGVHD chronic graft-versus-host disease, SEM standard error of the mean.
In univariate analyses, higher B-cell counts were associated with lower subsequent cGVHD at 2 months (HR 0.50, 95% CI 0.27–0.94; p = 0.031), 6 months (HR 0.48, 95% CI 0.26–0.90; p = 0.022) and 9 months (HR 0.27, 95% CI 0.09–0.81; p = 0.019). The group-wise cumulative incidences for B cells> vs ≤median were 11.2% (95% CI 5.6–16.4) vs 19.5% (12.6–25.9) at 2 months, 11.8% (6.0–17.2) vs 22.9% (15.0–30.1) at 6 months and 5.5% (0–10.7) vs 17.3% (8.6–25.2) at 9 months. In multivariable models including systemic steroid use, the association at 2 months was not significant (B cells> vs ≤median: HR 1.08, 95% CI 0.55–2.13; p = 0.828; systemic steroid use: HR 5.64, 95% CI 2.46–12.9; p < 0.001, Table S24). At 6 months, higher B cells showed a borderline association with lower cGVHD (HR 0.54, 95% CI 0.28–1.03; p = 0.062, Fig. 4b), whereas systemic steroid use remained associated with increased risk (HR 6.17, 95% CI 2.58–14.8; p < 0.001, Table S25). At 9 months, higher B cells were independently associated with lower cGVHD (HR 0.32, 95% CI 0.10–0.99; p = 0.047; Fig. 4b and Table S26). Additionally, patients without CMV reactivation had significantly higher AC of Tregs (3.7 cells/μL vs. 1.2 cells/μL, p < 0.001, Fig. 4c) compared with those who developed CMV reactivation, measured prior to reactivation. Similarly, patients who did not develop cGVHD demonstrated significantly higher B cell counts at 6 months (124.5 cells/μL vs. 65.0 cells/μL, p < 0.001, Fig. 4d) and 9 months (211.4 cells/μL vs. 118.4 cells/μL, p = 0.011, Fig. 4d) compared to those who developed cGVHD, measured prior to cGVHD. However, we found no significant association between Treg, NK cell, or naïve CD8+ T cell reconstitution and moderate-to-severe cGVHD.
Mediation analysis
In the Cox proportional hazards regression analysis evaluating the association between immune reconstitution status at 2 months post-transplant and TRM, early CMV reactivation emerged as an independent factor associated with TRM (9.7% in patients without CMV reactivation vs. 18.1% in those with reactivation; p = 0.038 when analysed with Treg reconstitution, Table S8). These findings led us to hypothesise that improved early Treg reconstitution may reduce TRM by suppressing early CMV reactivation. To test this hypothesis, we performed a mediation analysis to estimate the direct and indirect effects. A causal pathway among Treg reconstitution, CMV reactivation and TRM was identified (Fig. 5a, b), in which early CMV reactivation mediated the effect of Treg reconstitution at 2 months on TRM (ACME = –0.22, p = 0.032), accounting for 28.8% of the total effect. In addition, a significant direct effect of Treg reconstitution on TRM was confirmed (ADE = –0.09, p = 0.048). Furthermore, we evaluated the potential causal relationship between B cell reconstitution (at 6 and 9 months) and TRM via cGVHD, but found no evidence supporting a mediating role of cGVHD in this context.

a Mediation analysis showing that early CMV reactivation significantly mediated the association between Treg reconstitution at 2 months and TRM (ACME = –0.22, p = 0.032), accounting for 28.8% of the total effect. A significant direct effect of Treg reconstitution on TRM was also observed (ADE = –0.09, p = 0.048). b Sankey diagram illustrating the distribution of patients across Treg reconstitution groups (low vs. high), CMV reactivation status (no CMV vs. CMV), and transplant-related mortality (survival vs. death). Patients with high Treg reconstitution were more likely to avoid CMV reactivation and had a lower incidence of TRM. TRM transplant-related mortality, ACME average causal mediation effect, ADE average direct effect.