
Human tissue samples
Human skin tissues infected with NTM and peritoneal tissues infected with TB, used in this study were collected at Izumi General Medical Center. Tissue samples were fixed in 10% neutral-buffered formalin and embedded in paraffin.
Chemicals
The STAT1 inhibitor fludarabine was purchased from Selleck Chemicals (Houston, TX, USA). The NF-κB inhibitor Bay 11-7082 was purchased from FUJIFILM Wako Pure Chemical Corporation (Osaka, Japan). The p38 inhibitor adezmapimod (SB203580) was purchased from Selleck Chemicals. The JNK inhibitor SP600125 was purchased from LC Laboratories (Waltham, MA, USA). IFN-γ was purchased from FUJIFILM Wako Pure Chemical Corporation. Anti-mouse PD-L1 (B7-H1)-InVivo (clone: 10F.9G2) and rat IgG2b isotype control-InVivo (clone: LTF-2) were purchased from Selleck Chemicals.
Macrophage culture
Peripheral blood samples were collected from healthy volunteers after obtaining written informed consent for sample collection and subsequent experimental use. Peripheral blood mononuclear cells (PBMCs) were isolated using Lymphoprep™ (STEMCELL Technologies Inc., Vancouver, Canada). Isolated monocytes were cultured in Corning Primaria tissue culture dishes (Corning Inc., Corning, NY, USA) with 10 ng/mL recombinant human M-CSF (FUJIFILM Wako Pure Chemical Corporation) for 7 days to induce differentiation into human monocyte-derived macrophages (HMDMs). These HMDMs were maintained in DMEM (low glucose) (FUJIFILM Wako Pure Chemical Corporation) supplemented with 2% fetal bovine serum (FBS) and 100 µg/mL penicillin–streptomycin solution.
Bacterial growth and cell stimulation
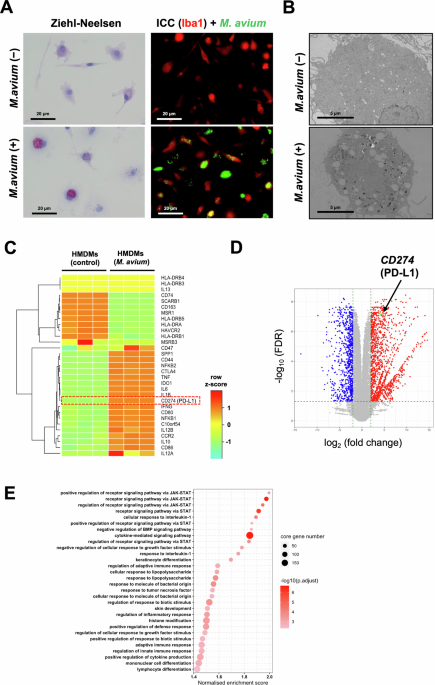
M. avium and M. avium harboring pGFPHYG2 (#30173, Addgene, Watertown, MA, USA) (GFP-expressing M. avium) were cultured in MycoBroth (Kyokuto Pharmaceutical, Tokyo, Japan) at 37 °C with 5% CO2. When the bacteria reached the exponential growth phase, the optical density of the bacterial solution was measured using a spectrophotometer (ABS-B470; Kyoritsu Chemical Check Lab, Tokyo, Japan). For cell stimulation, HMDMs were treated with M. avium at a multiplicity of infection (MOI) of 20 in DMEM (low glucose) (FUJIFILM Wako Pure Chemical Corporation) supplemented with 2% FBS for 24 h. After stimulation, M. avium was removed from the culture supernatant, and the HMDMs were cultured in a regular medium for 6 days.
Electron microscopy
HMDMs were cultured in the presence of M. avium. After incubation, the HMDMs were fixed in 2.5% glutaraldehyde in 0.1 M cacodylate buffer for 1 h and then post-fixed in 1% osmium tetroxide. After dehydration in a graded series of ethanol and propylene oxide solutions, the samples were embedded in Epon 812. Ultrathin sections were cut using an ultramicrotome (EM UC7; Leica, Wetzlar, Germany), stained with uranyl acetate and lead citrate, and observed using a transmission electron microscope (TEM) (H-7700; Hitachi, Tokyo, Japan).
Bulk RNA-sequencing data analysis
After HMDMs were cultured with M. avium for 24 h, M. avium was removed from the culture supernatant, and the HMDMs were subsequently cultured in a regular medium for 6 days. Following stimulation, HMDMs were immersed in a cell preservation solution and transported to the contracted company. Bulk RNA-sequencing was outsourced to CyberOmix (Kyoto, Japan) according to the protocol provided by the manufacturer.
The R and edgeR packages were used to analyze bulk RNA-seq data. The read count table was loaded with the DGEList function as the DGE list object. Normalization factors accounting for the library size of each sample were calculated using the TMM method with the calcNormFactors function. A general linear model (GLM) was used for differentially expressed gene analysis (DEG analysis) between control and infected macrophage samples. The common dispersion was estimated using the estimateDisp function. The glmQLFit function was used to fit a negative binomial GLM, and whether the genes were DEGs was tested using the glmQLFTest function.
For the heatmap, the CPM values normalized using the TMM method for each gene were extracted using the function CPM. The values were logarithmically transformed and scaled to z-scores across all samples. The results of the DEG analysis were used for gene set enrichment analysis (GSEA) using the packages org.Hs.eg.db and ClusterProfiler. The average log2 (fold change) × log (FDR) values were used to rank genes. The gseGO function was used to conduct GSEA for the gene sets of the gene ontology biological process.
Real-time quantitative PCR
Total RNA was isolated using the RNAiso Plus reagent and reverse-transcribed using the PrimeScript RT reagent kit (Takara Bio Inc., Shiga, Japan). Real-time quantitative PCR was conducted using TaqMan polymerase with SYBR green fluorescence (Takara Bio Inc.) and an ABI PRISM 7300 sequence detector (Applied Biosystems (Thermo Fisher Scientific), Waltham, MA, USA). The following primers were used: PD-L1, sense 5′-AAA.TGG.AAC.CTG.GCG.AAA.GC-3′, antisense 5′-GAT.TCA.GAG.CTA.CCC.CTC.AGG.CAT.TT-3′; β-actin, sense 5′-ATT.CCT.ATG.TGG.GCG.ACG.AG-3′, antisense 5′-AAG.GTG.TGG.TGC.CAG.ATT.TTC-3′.
Western blot analysis
HMDMs were lysed in ice-cold lysis buffer supplemented with a protease inhibitor cocktail (Sigma-Aldrich, St. Louis, MO, USA). Proteins were separated by SDS–PAGE and transferred onto polyvinylidene fluoride membranes, which were incubated with primary antibodies including anti-PD-L1 (#13684, Cell Signaling Technology [CST], Danvers, MA, USA), anti-p38 MAPK (#8690, CST), anti-phospho-p38 MAPK (#4511, CST), anti-JNK1/2 (#9252, CST), anti-phospho-JNK1/2 (#9251, CST), anti-STAT1 (#9175, CST), anti-phospho-STAT1 (#9167, CST), anti-NF-κB (#8242, CST), anti-phospho-NF-κB (#3033, CST), and anti-β-actin (sc-47778, Santa Cruz Biotechnology, Dallas, TX, USA). HRP-conjugated secondary antibodies included goat anti-mouse IgG (#7076, CST) and goat anti-rabbit IgG (#7074, CST). Immunoreactive bands were visualized using a Pierce western blotting Substrate Plus Kit (Thermo Fisher Scientific, Waltham, MA, USA) and Amersham Imager 680 (Fujifilm, Tokyo, Japan).
Flow cytometry
Single-cell suspensions were prepared from mouse lung tissue and treated with FcR-blocking reagent (BioLegend Inc., San Diego, CA, USA). The cells were stained with PerCP-Cy5.5-labeled anti-CD69 antibodies (clone H1.2F3, BioLegend), BV-421-labeled anti-PD-1 antibodies (clone 29F.1A12, BioLegend), and isotype-matched control antibodies (BioLegend). Stained cells were analyzed using a FACSverse flow cytometer (Becton Dickinson and Company, Franklin Lake, NJ, USA) and the FACSuite software program (Becton Dickinson).
Immunohistochemistry
Human specimens were cut into 3-µm sections. The sections were deparaffinized and rehydrated, followed by antigen retrieval, endogenous peroxidase removal, and blocking with protein block. The primary antibodies used were anti-PD-L1 (#SK006, Agilent Technologies, Santa Clara, CA, USA), anti-PD-1 (#43248, CST), anti-CD4 (#413181, Nichirei Biosciences, Tokyo, Japan), anti-CD8 (#413201, Nichirei Biosciences), and anti-Iba1 (#019-19741, FUJIFILM Wako Pure Chemical Corporation). Samples were then incubated with peroxidase-labeled goat anti-mouse or rabbit secondary antibodies (anti-mouse, #424132; anti-rabbit, #424142; Nichirei Biosciences). Immunoreactions were visualized using the Diaminobenzidine Substrate Kit (#425011; Nichirei Biosciences).
Mouse specimens were similarly processed into 3-µm sections. The sections were subjected to deparaffinization, rehydration, followed by antigen retrieval, endogenous peroxidase removal, and blocking with protein block. The primary antibodies used were anti-PD-L1 (#64988, CST), anti-PD-1 (ab214421, Abcam, Cambridge, UK), anti-CD8 (#98941, CST), anti-CD25 (#36128, CST), anti-Ki-67 (#418071, Nichirei Biosciences) and anti-Iba1 (#019-19741, FUJIFILM Wako Pure Chemical Corporation). Samples were then incubated with peroxidase-labeled goat anti-rabbit secondary antibodies (#413341; Nichirei Biosciences). Immunoreactions were visualized using the Diaminobenzidine Substrate Kit (#425011; Nichirei Biosciences).
Immunofluorescence staining
HMDMs were cultured in 6-well plates with M. avium. After infection, HMDMs were fixed in 4% paraformaldehyde for 15 min at room temperature. The cells were then incubated with primary antibodies against Iba1 (#019-19741, FUJIFILM Wako Pure Chemical Corporation) and PD-L1 (ab228462, Abcam) for 2 h at room temperature. Following incubation with the primary antibody, the cells were treated with the corresponding Alexa Fluor 594-conjugated secondary antibody (#A-11012; Invitrogen, Waltham, MA, USA) for 30 min at room temperature. Nuclei were counterstained using the VECTASHIELD Mounting Medium with DAPI (H-1200, Vector, Anaheim, CA, USA). The images were captured using a Keyence BZ-X800 fluorescence microscope.
Ziehl–Neelsen staining
Samples of M. avium-infected HMDMs and formalin-fixed paraffin-embedded tissue sections were stained with carbol fuchsin (#41122, Muto Pure Chemicals, Osaka, Japan) for 30 min. After staining, the slides were rinsed with tap water, decolorized with 70% ethanol containing 1% HCl, and rinsed again with tap water. The slides were then counterstained with hematoxylin for 1 min, followed by rinsing, dehydration, and mounting.
Multiplexed immunohistochemical consecutive staining on a single slide (MICSSS)
MICSSS was performed as previously described [14]. Briefly, serial rounds of immunohistochemical staining were performed on a single formalin-fixed, paraffin-embedded (FFPE) tissue section. After each round of staining, chromogenic signals were scanned using a NanoZoomer digital slide scanner (Hamamatsu Photonics, Shizuoka, Japan) and then removed using a mild antibody and chromogen stripping protocol. Staining was performed using different antibodies. This cycle was repeated to detect multiple markers in the same tissue section. The acquired images were aligned and analyzed using the HALO image analysis software program (Indica Labs, NM, USA) to generate pseudo-fluorescent composite images and assess marker distribution within the tissue microenvironment.
HALO analysis
Quantification of marker-positive cells was performed using the Highplex FL module in the HALO image analysis software program. Multichannel immunofluorescence images were analyzed to detect and quantify cells expressing specific markers. Regions of interest (ROIs) were defined based on tissue classification using the HALO Tissue Classifier module, which applies a machine-learning algorithm to distinguish different tissue compartments based on histomorphological features and marker expression patterns. Individual cells were identified using nuclear segmentation and marker positivity was determined using user-defined fluorescence intensity thresholds. The number and spatial distribution of positive cells were automatically calculated and exported for the statistical analysis.
M. avium intratracheal infection mouse model
The experimental model was established using 6- to 8-week-old male BALB/c mice. M. avium (2 × 10⁵ CFU (colony-forming units)/mouse) in 50 µL of sterile saline was administered intratracheally. Mice were euthanized 6 weeks after infection. After dissecting, the lungs were fixed in 10% neutral-buffered formalin and embedded in paraffin. In the PD-L1 antibody treatment experiment, mice were randomly assigned to the PD-L1 antibody treatment group or the isotype control group by drawing lots. Group allocation was conducted by an investigator who was not involved in the infection procedures, data collection, or statistical analysis. The sample size for each experimental group was determined based on previous studies using similar M. avium infection models. Mice in which NTM infection was not detected by Ziehl–Neelsen staining of lung tissues after dissection were excluded from the study. No blinding was performed during the procedures or outcome assessment because the differences in treatment groups were evident due to the experimental procedures.
Statistical analysis
Prism software (GraphPad Software, San Diego, CA, USA) was used for statistical analyses. All data are representative of two or three independent experiments. Center values represent the mean, and error bars indicate the standard deviation (SD). Differences between groups were examined for statistical significance using the two-sided Mann–Whitney U test. No adjustment for multiple comparisons was applied. In the animal experiments, differences in variance between the PD-L1 antibody treatment group and the isotype control group, as well as between infected and non-infected regions, were assessed using Levene’s test to confirm that no extreme differences in variability were present. Statistical significance was set at *p < 0.05; **p < 0.01; ***p < 0.001.