
Human samples and animals
Human DRG samples listed in Supplementary Table 8 were included in this study and were approved by the Swedish Ethical Review Authority (Etikprövningsmyndigheten). All animal experiments were performed in accordance with protocols approved by the Stockholm Ethical Committee for Animal Experiments (Stockholms Norra Djurförsöksetiska Nämnd, Sweden). Animals were provided with food and water ad libitum and were maintained on a 12-h light/12-h dark cycle. Wild-type C57BL/6N mice (adult, 8–9 weeks) were ordered from Charles River (Scanbur). Mouse strains targeting different subsets of neurons are included in Supplementary Table 9. All strains were backcrossed to C57BL/6N wild-type mice for at least three generations before being used for breeding.
For TrkACreERT2 and Gfra3CreERT2 mice, tamoxifen (Sigma, T5648) was dissolved in corn oil (Sigma, 8267) at a concentration of 20 mg ml−1 and delivered by i.p. injection to postnatal day 14 pups once and then in adults for two consecutive days (140 mg per kg (body weight), both pups and adults). Control groups of test mice also received tamoxifen injections.
Autoantibody-induced arthritis model
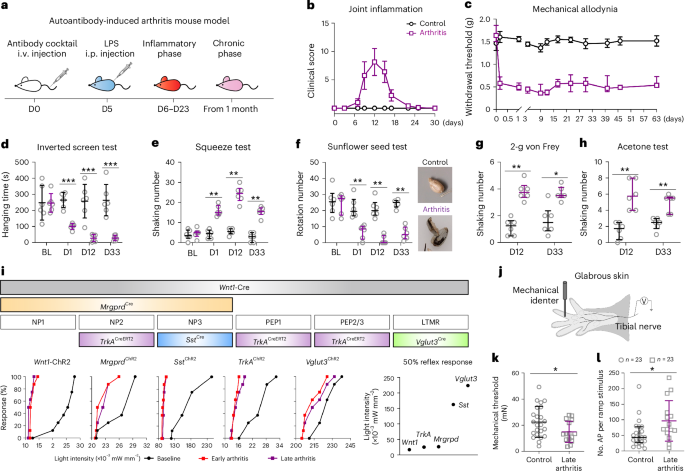
Arthritis was induced by i.v. injection of 6 mg of a mixture of four arthritogenic monoclonal antibodies (ACC1 (anti-citrullinated C1 epitope of collagen type II (COL2)), M2139 (anti-COL2), L10D9 (anti-collagen type XI) and 15A (anti-cartilage oligomeric matrix protein antibody)) on day 0, followed by 25 μg of LPS (055:B5, Sigma) i.p. on day 5 (ref. 18). Control mice received 150 μl of saline i.v. on day 0 and 100 μl of saline i.p. on day 5. LPS-treated mice were injected with 150 μl of saline i.v. on day 0 and 25 μg LPS i.p. on day 5. No changes in joint inflammation or pain-like behavior were observed in any strain of LPS-treated mice.
Visual joint inflammation was scored as previously described54. In brief, each inflamed (both swollen and redness) digital was given a score of 1 point, and if the dorsal side of the paw or wrist/ankle joint was inflamed, 2.5 points were given for moderate inflammation and 5 points for severe inflammation, resulting in a maximum of 15 for each limb and in total 60 per mouse.
Light-induced response
A flexible optical fiber bundle monitored by a power controller (DC2200, Thorlabs) was used to activate ChR2, and the withdrawal reflex was elicited using a pulsing laser (470 nm, 10 Hz, 50 ms ON/OFF) with intensities from low to high and applied to the plantar surface of the hind paws. Wnt1-ChR2, TrkAChR2, SstChR2, Vglut3ChR2, Gfra3ChR2 and MrgprdChR2 mice (n = 7–8) were habituated for 1 h on the mess floor, and a 20-s trial was conducted, alternating between the left and right hind paws with intervals of at least 10 min. The light threshold was determined as the lowest light power provoking a withdrawal response (for reflex) or nocifensive behavior like shaking, lifting, licking and guarding in one of the stimulated hind paws. The percentage of withdrawal reflex responding mice in different strains was reported. In all experiments, subthreshold light stimulations (0.2% lower intensity than threshold) were applied simultaneously combined with the following described behavioral tests.
Behavioral tests
Mice were habituated on two occasions before assessment of baseline. After two baseline recordings performed on different days, the animals were randomly assigned to saline control and arthritis groups. Mechanical sensitivity was determined by assessment of paw withdrawal using von Frey filaments (Stoelting). A series of filaments with a logarithmically incremental stiffness of 0.04, 0.07, 0.16, 0.4, 0.6, 1.0 and 2.0 g was applied to the plantar surface of the hind paw and held for 3 s according to the up–down method, as previously described55. A brisk withdrawal of the paw was noted as a positive response. The 50% probability of withdrawal threshold (force of the von Frey hair to which an animal reacts to 50% of the presentations) was calculated as the threshold. To avoid any potential tissue damage, a cutoff value of 2.0 g was applied. The average withdrawal threshold of two hind paws was used.
To assess heat sensitivity, a radiant heat source (IITC) was aimed at the plantar surface of the hind paw through a glass surface, and withdrawal latency was recorded56. In brief, mice were placed in plexiglass cubicles on a glass surface. The thermal nociceptive stimulus originated from a projection bulb below the glass surface, and the stimulus was delivered separately to one hind paw at a time. Latency was defined as the time required for the paw to show a brisk withdrawal. Each hind paw was tested three times with intervals, and the average withdrawal latency was calculated.
Nocifensive response (shaking) was measured as a quantitative scale of pain responses to a 2.0-g von Frey filament applied to both hind paws. Cold allodynia was assessed by calculating nocifensive responses for 45 s after application of one drop of acetone each to both hind paws. Mechanical hyperalgesia (pinprick) was tested with a safety pin (23-G needle, BD), and nocifensive responses were recorded. The average number of shakes of the two hind paws was used.
Inverted screen test
To assess limb function, an inverted screen test was used19. Mice were placed in the center of the wire screen (width 7 mm and diameter 2 mm for wire; GMC500) and rotated to an inverted position over 2 s, with the mouse’s head declining first. The screen was positioned steadily 45–50 cm above a soft material padded surface. The time was recorded until the mouse fell off (hanging time); animals were removed from the screen when they reached the cutoff point (8 min).
Clip squeeze test
To check joint tenderness, after 1 h of incubation in a Hargreaves’ box (IITC), a toothless clip (420 G) was applied to squeeze the proximal interphalangeal joint and extension of the metatarsal–phalangeal joint of one hind paw for 5 s. Shaking numbers were then analyzed for 4 min after clip removal.
Sunflower seed test
To test forepaw dexterity, the sunflower seed test was used (modified from previous descriptions57,58). Animals were habituated to separate test boxes (animal enclosure, IITC) placed on a gray matte acrylic floor. After habituation, two to three sunflower seeds, provided by KM-B, KI (Komparativ Medicin Biomedicum, Karolinska Institutet), were left on the floor for 20 min for three consecutive days (one round of training). Only activated mice (those that completely deshelled the seeds, around 60% of C57BL/6N mice and 100% of BALB/c mice) after two rounds of training were used for further study. Two days before testing (habituation days 1 and 2) and during the testing day (testing on day 3), animals were transferred from their home cages, placed in the test box and allowed to explore the environment for 10 min. Two seeds were thereafter placed on the floor, and seed eating activity was recorded for 20 min. Episodes of rotation were calculated (the act of manipulating shell orientation by rotating 180° within the forepaws).
Gain-of-function study
Light threshold was defined as the lowest light intensity provoking a withdrawal (reflex) or nocifensive response (shaking) in one of the hind paws. Subthreshold light stimulations were then applied simultaneously with sensory stimuli. The subthreshold light intensities for baseline mice and mice with arthritis were adjusted for hyperexcitability associated with arthritis (Wnt1-ChR2 mice baseline reflex subthreshold: 12.7 × 10⁻³ mW mm−2, nocifensive subthreshold: 18.5 × 10⁻³ mW mm−2; mice with arthritis reflex subthreshold: 11.7 × 10⁻³ mW mm−2, nocifensive subthreshold: 14.5 × 10⁻³ mW mm−2; MrgprdChR2 mice no difference in subthreshold light; TrkAChR2 mice baseline reflex subthreshold: 19.7 × 10⁻³ mW mm−2, mice with arthritis reflex subthreshold: 15.4 × 10⁻³ mW mm−2). No effects were found in SstChR2 or Vglut3ChR2 mice with the subthreshold gain-of-function blue light in normal mice or mice with arthritis.
Inhibitory optogenetics
Animals were tested before and after yellow light. A yellow LED plate (wavelength: 566 nm; 0.1 mW mm−2) was positioned under the testing floor with exposures of 30 min for TrkAArchT mice and 45 min for Gfra3ArchT mice (n = 8). For mechanical sensitivity, after 1 h of habituation on a mesh floor, the plantar surface of the hind paws was stimulated with a series of calibrated monofilaments (Stoelting) with increasing force (0.07, 0.16, 0.4, 0.6, 1.0, 1.4 and 2.0 g). Each filament was applied five times to both hind paws. The percentage of animals with a withdrawal reaction was reported.
Joint innervation and function
Retrograde tracing of sensory neurons was performed by intra-articular ankle joint injection of 5 µl of AAV-retro-CAG-eGFP virus (2 × 10¹² viral genomes per ml, v24-retro, ETH Zurich Virus Core) administered to C57BL/6N mice. Functional activation was achieved by injection of AAV-retro-hSyn1-hChR2(H134R) mCherry virus (5.3 × 10¹² viral genomes per ml, v124-retro). A blue laser (470 nm, 10 Hz, 50 ms ON/OFF) was applied to the ankle joints for 2 min, and light threshold was determined as the lowest light intensity provoking a withdrawal (reflex) or nocifensive response before (baseline) and after arthritis was established (days 3, 12 and 31).
DRG single-cell suspension preparation
Cervical and lumbar DRGs from C57BL/6N mice (10–15 weeks, control and arthritis) at different timepoints (0.25, 0.5, 1, 2, 12, 33 and 63 days) were dissected in a 6-cm Petri dish with DPBS (Sigma) on ice. Single-cell suspensions were generated largely according to our previous protocol with modifications59. In brief, dissected DRGs were chopped with microscissors one to two times in 2 ml of papain (25 U ml−1; Worthington Biochemical) and incubated for 30 min at 37 °C with a mixture of digestion enzymes including papain/collagenase/dispase (papain, 25 U ml−1, 4 ml; DNase I, 55 U ml−1, 0.5 ml, Worthington Biochemical; collagenase and dispase 20 mg ml−1, 800 μl, Worthington Biochemical). DRGs were triturated up and down ten times using glass Pasteur pipettes with decreasing diameter (precoated with 0.5% bovine serum albumin (BSA)). Cell suspensions were filtered through a 30-µm cell strainer (CellTrics, Sysmex) and washed with an additional 1.5 ml of artificial cerebrospinal fluid (ACSF; 87 mM NaCl, 2.5 mM KCl, 1.25 mM NaH2PO4, 26 mM NaHCO3, 75 mM sucrose, 20 mM glucose, 0.5 mM CaCl2 and 4 mM MgSO4) and 0.5 ml of DPBS. Cells were pelleted by centrifugation (300g × 6 min, 4 °C) and resuspended with 1.5 ml of cold ACSF with 0.5 ml of DPBS. The cell suspension was carefully loaded on top of the same volume of OptiPrep density gradient medium (Sigma) and centrifuged at 700g for 10 min at 4 °C. The cell pellet was resuspended with 3 ml of cold ACSF. SYTOX Blue (Invitrogen, Thermo Fisher Scientific) was added to stain dead cells. Thereafter, live SYTOX Blue-negative cells were sorted by fluorescence activated cell sorting (BD FACSAria Fusion/BD FACSAria III) at 4 °C. Cells were concentrated by centrifugation (300g × 5 min, 4 °C) and resuspended in a proper volume (~1,000 cells per µl) of ACSF solution.
Single-cell gene expression 3′ sequencing
Sorted cells were loaded onto a 10x Chromium Chip G to yield single-cell droplets with a v3.1 kit (10x Genomics). Targeted cell recovery for each well was set to 5,000 cells (∼10% neurons). Reverse transcription, cDNA amplification and library construction were performed according to the user guide provided by 10x Genomics, and libraries were sequenced at the National Genomics Infrastructure (SciLifeLab) and aligned to mouse reference mm10 using the STAR aligner to generate the gene–cell matrices.
scRNA-seq data analysis
The R (v.4.1.1) package Seurat (v.4.1.0) was used for the main scRNA-seq analysis. Individual count matrices created by CellRanger (v.5.0.1) were merged to a single Seurat object, and all cells with more than 20% of counts originating from mitochondrial genes were discarded. A cutoff at more than 2,000 detected genes was set for the primary data. These data were integrated using Harmony (v.0.1.0) and clustered using the default algorithm in Seurat. Putative neuronal clusters were identified using the neuronal marker gene Rbfox3. Non-neuronal clusters from control samples were extracted, integrated, clustered and assigned cell labels according to Krauter et al.10. The non-neuronal control data were then used to transfer labels (Seurat) to all remaining non-neuronal data. After this, all remaining original data with ≥1,000 detected genes were integrated, clustered and assigned labels from the primary data. All neurons from these secondary data were discarded to make sure that only high-quality neurons were used for the final analyses. Then, the primary (>2,000 detected genes) and secondary (≥1,000 detected genes) datasets were merged to produce the full working dataset. More granular identities for the immune cells in the data were assigned using a peripheral nerve immune cell atlas60. For this, a mixture discriminant analysis (mda)-based classifier (scPred, v.1.9.2) was built using these data, and the cell-type labels for the immune cells in the present data were learned using this model. All cells with a prediction score below 0.55 were discarded. For neurons, all cells labeled as neurons were extracted from the full working data and clustered, and using iterative clustering steps all cells with less than 0.5 normalized counts of Rbfox3 and more than two normalized counts of Apoe were removed. A classifier was then built as described before using data from Zeisel et al.13 with annotations from Usoskin et al.12, cell-type labels for the neuronal data were learned using the model, and unassigned neurons were discarded similar to as stated above. For a pseudobulk differential expression analysis, neuron types were collapsed together, and data from each individual time point after inducing arthritis were compared against controls (t0) using a Wilcoxon rank-sum test with the Seurat function FindMarkers and an adjusted P value cutoff of 1 × 10⁻²⁰. Differentially expressed genes for each cell type between individual arthritis timepoints and controls were defined in a similar fashion. Fcoex (v.1.10.0) was used to identify co-regulated gene modules in the dataset. For this, to reduce computational load, a random set (25%) of cells from each cell type–timepoint pair was sampled. Fcoex was run for the first 200 genes using ‘timepoint’ as the target. The resulting set of modules was further filtered to contain only differentially expressed genes and modules that consisted of a minimum of ten genes. A module score was calculated for modules and scaled to fall between 0 and 1. A GSEA for gene modules was run using enrichR (v.3.0) with the ‘GO_Biological_Process_2021’ and ‘KEGG_2019_Mouse’ databases. For the perturbation analysis (Augur v.1.0.0), all genes situated on the Y chromosome and non-protein-coding genes were first discarded. Following this, the analysis was run comparing each individual timepoint against controls for each neuron type. The default minimum of 20 cells per type/timepoint was used; therefore, some neuron types were not compared for each timepoint. For hallmark GSEA, we used MSigDB61. SCENIC was used to infer master transcription factor regulons across all cell types and timepoints62.
Intercellular ligand–receptor analysis
Upregulated genes at the 12-h timepoint were compared to the 0-h timepoint by the following criteria: greater than threefold change, expression in >10% of cells within a cell type and P < 0.05. Ligand-encoding genes were selected, and all expressed genes were used for determining the receptor genes in each cell type. Ligand–receptor pairs were calculated using the ligand–receptor dataset63. We then collected associated gene patterns for each ligand–receptor pair from NicheNet and SCENIC62,64. Ligand–receptor activity was scored using the enrichment score65. In brief, we used all upregulated genes as the candidate gene pool. Ligand–receptor-associated gene patterns were selected for scoring, whereas the remaining genes were considered background genes and ranked based on their expression. We created 20 intervals according to background gene expression and randomly selected 100 genes from each interval to form a random background gene matrix. Feature scores were calculated by comparing the average expression of the associated genes to the randomized background genes. All negative values were normalized to 0, indicating nonactivity. To reduce variation, for each ligand–receptor pair between two cell types, the enrichment score was calculated five times with the average value as the activity score. The specific ligand–receptor pairs between different cell types were visualized in a Sankey plot.
Type 1 IFN signaling blockade
C57BL/6N mice received either a neutralizing monoclonal antibody to IFNAR1 (40 mg per kg (body weight), i.p., BioXCell) or an isotype of mouse IgG1 (40 mg per kg (body weight), i.p., BioXCell) 1 h before the injection of cartilage autoantibodies (day 0) or on day 22 or day 45 after autoantibody injection (n = 6). TYK2 inhibitor (deucravacitinib/MBS-986165, MCE, in ethanol:TPGS:PEG300 (5:5:90)) was orally administrated twice daily for 9 days from day 13 after autoantibody injection in C57BL/6N mice (8:00 AM and 8:00 PM, 15 mg per kg (body weight); n = 6)66. A single i.p. injection of MNK1/MNK2 inhibitor, tomivosertib (eFT508/HY-100022, MCE, 1 mg per kg (body weight), in DMSO:PEG300:Tween-80:saline (5:40:5:50)), was administered on day 48 after antibody injection in C57BL/6N mice (n = 10, 5 females and 5 males). eIF4E/eIF4G interaction inhibitor, 4EGI-1 (324517, Sigma), was i.p. injected into C57BL/6N mice with antibody-induced arthritis (15 mg per kg (body weight) in DMSO:PEG300:Tween-80:saline (5:40:5:50); n = 5) on day 56. Animals were tested in behavioral tests as described in the Results.
Ifnar1 knockout in the DRG
Knockout of Ifnar1 was performed with AAV-PHP.S-CAG-eGFP_Cre virus (1.7 × 10¹³ viral genomes per ml, v25-PHP.S, ETH Zurich Virus Core) in Ifnar1fl/fl mice. AAV-PHP.S-CAG-eGFP virus (1.3 × 10¹³ viral genomes per ml, v24-PHP.S, ETH Zurich Virus Core) served as the control virus. Somatic CRISPR knockout was performed using a hybrid strategy combining constitutive Cas9 expression with AAV-mediated delivery of gRNAs, AAV-PHP.S-U6>Ifnar1(gRNA 1)-H1>Ifnar1(gRNA 4)-7SK>Ifnar1(gRNA 5) virus (3.58 × 10¹³ viral genomes per ml, AMSBio) in Rosa26-Cas9 mice. The AAV construct contained three gRNA sequences (5’-TTCAGCAGAATATCGAACGT-3’, 5’-AAGGGAACAGCACATCTTCG-3’ and 5’-CGGACAAGACGGGAACATGT-3’) targeting the second, third and fourth exons of Ifnar1, respectively. AAV-PHP.S-CAG-eGFP_Cre (1.7 × 10¹³ viral genomes per ml, v25-PHP.S, ETH Zurich Virus Core, for CRISPR–Cas9) was used as the control virus. The virus (8 µl) was delivered through intrathecal injection. Mice were used for antibody-induced arthritis experiments after 6–8 weeks of virus injection. Knockout efficiency was evaluated by RNAscope experiments for Ifnar1 expression.
EndoS treatment of autoantibody
For Fc N-glycan cleavage, glutathione S-transferase-fused EndoS expressed by Escherichia coli was used to incubate with the cartilage antibody cocktail at a ratio of 1:1,000 (wt/wt) and 37 °C for 1 h. All antibodies were purified by using Protein G GraviTrap columns (Cytiva) according to the manufacturer’s instructions.
Cytokine measurements in serum
Collected blood samples were centrifuged at 1,000g for 10 min at 4 °C, and serum samples were aliquoted and stored at –80 °C until use. Serum levels of IFNα and IFNβ as well as 31 other cytokines/chemokines were measured by a multiplex assay service (Eve Technologies) using a Mouse IFN 2-Plex Discovery Assay (MDIFNAB) and Mouse Cytokine/Chemokine 31-Plex Discovery Assay Array (MD-31), respectively (n = 4).
qPCR of IFNs in DRG samples
Fresh DRG samples were collected at different timepoints after autoantibody injection: 1 h, 12 h, 3 days, 33 days and 63 days, four mice for each group, whereas the 12 h group had eight mice. Naive C57BL/6N mice (n = 9) were used as the control group. For mice treated with anti-IFNAR1, samples were collected 33 days after autoantibody injection with 12 h of treatment with monoclonal anti-IFNAR1 (40 mg per kg (body weight), i.p., BioXCell; n = 5). Fresh-frozen human lumbar DRGs were used and are listed in Supplementary Table 8. Total RNA was extracted from mouse cervical and lumbar DRGs using TRIzol Reagent (Thermo Fisher Scientific) and a Motorized Pestle Mixer (Argos Technologies), as previously described67. cDNA was generated from 500 ng of RNA using a High-Capacity cDNA Reverse Transcription kit (Applied Biosystems) with random primers according to the manufacturer’s instructions. qPCR reactions were performed using SYBR Green Master Mix (Thermo Fisher Scientific) on a QuantStudio5 System (Applied Biosystems). Primer pairs used in this study are listed in Supplementary Table 9. All assays were performed in duplicate, and the levels of transcripts were analyzed by the comparative cycling threshold (\({2}^{-\mathrm{\varDelta \varDelta }{C}_{{\text{t}}}}\)) method relative to mouse Gapdh or human GAPDH.
Tissue preparation and in situ hybridization (RNAscope)
Mice were deeply anesthetized and decapitated. Lumbar DRGs were dissected, snap-frozen and maintained at −80 °C. Fresh-frozen human lumbar DRGs were provided by AnaBios (L3–L5 DRGs; Supplementary Table 8). Twelve-micron sections were mounted onto Superfrost Plus microscope slides and stored at −80 °C until use.
RNAscope assays were performed according to the protocol provided with an RNAscope Multiplex Fluorescent Detection kit v2 (323110, ACDBio) with minor modifications, where the hydrogen peroxide treatment was omitted, protease 3 was used instead of protease 4, and counterstaining with DAPI (1.0 μg ml−1, 10 min at room temperature) was performed. Slides were mounted after rinsing in PBS with mounting medium (Agilent Dako), dried overnight at room temperature and stored at −20 °C until imaging. The probes included in this study were designed and provided by ACDBio as listed in Supplementary Table 9.
Immunohistochemistry
Mice were deeply anesthetized with sodium pentobarbital (300 mg per kg (body weight)) and perfused transcardially with 20 ml of prewarmed (37 °C) saline, followed by 20 ml of prewarmed 4% paraformaldehyde in 0.16 M phosphate buffer (pH 7.2–7.4) and 50 ml of cold fixative. L4/L5 DRGs were dissected and postfixed in the same fixative for 90 min at 4 °C. After cryoprotection in 10% sucrose with 0.1 M phosphate buffer containing 0.01% sodium azide (VWR) and 0.02% bacitracin (Sigma) for 48 h, the tissue was embedded with OCT (HistoLab), frozen with liquid carbon dioxide and sectioned on a CryoStar NX70 cryostat (Thermo Scientific) at 12-µm thickness. Immunohistochemistry was conducted as described in Zhang et al.68 using antibodies listed in Supplementary Table 9.
H&E staining
Ankle joints were collected from BALB/c mice on day 60 after autoantibody injection after transcardial perfusion and then postfixed in 4% paraformaldehyde overnight at 4 °C. After decalcification in EDTA solution (Sigma), the joints were cryosectioned and stained with H&E (Sigma). Histopathological analysis was evaluated by a three-grade system for synovitis (inflammation), cartilage destruction and bone erosion as previously described54, five sections for each animal.
Microscopy, image processing and quantitative analysis
Representative confocal images were acquired from 1-Airy unit pinhole on an LSM700/LSM800/LSM900-Airy confocal laser-scanning microscope (Carl Zeiss) and limited emission spectra for image acquirement. Joint histology images were acquired by microscopy using an Olympus IX73. For mRNA or protein intensity analysis, cell segmentation was performed with cellpose, and intensity was detected with ImageJ. Images were processed using ZEN2012 software (Zeiss).
Patch clamp electrophysiology
Cell cultures for patch clamp electrophysiology were prepared from adult C57BL/6N mice (both sexes, 7–10 weeks). In brief, all levels of cervical and lumbar DRGs were dissected and digested in a mixture of papain/collagenase/dispase and triturated using glass Pasteur pipettes. Dissociated cells were suspended in L-15 medium (Liebovitz, L1518, Merck) containing 10% fetal bovine serum, NaHCO3, glucose, penicillin/streptomycin (1×) and floxuridine (PHR2589, Merck) and plated on coverslips precoated with poly-d-lysine (A-003-E, Merck) and laminin (L2020, Merck). The following day, changes in neuronal excitability in small-sized nociceptors (diameter of ≤20 µm) were tested after a 1-h preincubation in recombinant mouse IFNα protein (12100-1, 300 U ml−1, B&D Systems); PBS containing 0.1% BSA (Sigma) stimulation in neurons served as the control. To test the effects of MNK1/MNK2 inhibition on IFN-stimulated nociceptors, neurons were first incubated with 10 µM eFT508 (in L-15 medium) or vehicle (DMSO, 0.1% (vol/vol)) for 1 h, and IFNα (300 U ml−1) was then added. After 1 h of IFNα incubation, the coverslip was placed in a 35-mm Petri dish filled with ACSF solution. ACSF was composed of 125 mM NaCl, 25 mM glucose, 25 mM NaHCO3, 2.5 mM KCl, 2 mM CaCl2, 1.25 mM NaH2PO4 and 1 mM MgCl2 that was saturated with 95% oxygen and 5% carbon dioxide and maintained at room temperature (20–22 °C).
All recordings were performed using a whole-cell patch clamp technique. Patch clamp electrodes were filled with a solution containing 120 mM K-gluconate, 5 mM KCl, 10 mM HEPES, 4 mM Mg2ATP, 0.3 mM Na4GTP and 10 mM sodium phosphocreatine with pH 7.4 adjusted with KOH and an osmolarity of 275 mOsm. Neurons were visualized using a fluorescence microscope (Axioskop FS Plus, Zeiss) equipped with IR-differential interference contrast optics and a CCD camera (Hamamatsu). Patch clamp electrodes were advanced into the dish using a motorized micromanipulator (Luigs and Neumann) while applying constant positive pressure. Intracellular signals were amplified using a MultiClamp 700B amplifier (Molecular Devices) and low-pass filtered at 10 kHz. Electrophysiological data were digitized at 10 or 20 kHz using a Digidata 1322AA/D converter (Molecular Devices) and acquired using pClamp software (Molecular Devices). Neurons were held at –60 mV in current clamp mode, and ramps of depolarizing current (1-s duration, peak amplitudes of 100, 300, 500 and 700 pA) were injected into each neuron. The total number of action potentials elicited by each current ramp was quantified for each neuron.
Western blotting
To perform western blotting, cervical and lumbar DRGs were collected at different timepoints after antibody injection: 1 h, 12 h and 33 days, four mice for each group. For mice treated with anti-IFNAR1, samples were collected at 33 days after 12 h of treatment with monoclonal anti-IFNAR1 (40 mg per kg (body weight), i.p., BioXCell; n = 3). Naive C57BL/6N mice (n = 9) were used as the control group. Total protein was extracted using N-PER neuronal protein extraction reagent (87792, Thermo Fisher Scientific) containing protease inhibitor cocktail (G6251, Promega) and Halt phosphatase inhibitor cocktail (78428, Thermo Fisher Scientific). Tissues were homogenized using a micropestle (Sigma), followed by sonication, incubation for 10 min on ice, centrifugation at 10,000g and collection of supernatants. Total protein concentration was measured with a BCA assay kit (Thermo Fisher Scientific). Protein lysates from fresh human lumbar DRGs from healthy donors, individuals with RA with pain and individuals with RA without pain (AnaBios, Supplementary Table 8) were homogenized with beads using a tissue homogenizer (Qiagen) and processed in a similar way to mouse DRGs. For mouse DRG lysates, 20 µg of denatured protein was separated by electrophoresis on a NuPAGE 4–12% Bis-Tris gel and transferred onto a 0.2-µm nitrocellulose membrane with an iBlot2 transfer system. Membranes were blocked with 5% BSA in 0.1% Tween-20 (TBST) for 1 h at room temperature and then incubated with primary antibody to p-eIF4E (Ser209, Cell Signaling Technology) for 2 days at 4 °C. Membranes were washed in TBST three times for 15 min each at room temperature on a shaker and incubated with polyclonal secondary antibody conjugated with horseradish peroxidase (HRP) in 5% BSA (Dako) for 1 h at room temperature. Signal was detected with SuperSignal West Femto reagents (Thermo Fisher Scientific) after washing the membrane and imaged with a ChemiDoc MP system (Bio-Rad Laboratories). Membranes were stripped in Restore Plus Western Blot stripping buffer (46430, Thermo Fisher Scientific) for 1 h, washed with TBST (three times, 15 min each), blocked with 5% BSA and reprobed with primary antibody to eIF4E (Cell Signaling Technology) overnight at 4 °C. The membrane was washed, incubated with HRP-conjugated secondary antibody, detected with Amersham ECL Prime Western Blotting detection reagents and imaged with a ChemiDoc system. At the end, GAPDH (Cell Signaling Technology) was probed on the stripped membranes as the loading control. Band intensity were quantified with Image Lab 6.1 software (Bio-Rad Laboratories). Protein phosphorylation levels were normalized to total protein expression and compared to normalized control samples. For human DRG lysates, 30 µg of denatured protein was loaded for western blotting and probed with primary antibodies (IFNα from Thermo Fisher Scientific and β-actin from Abcam) in a similar protocol as described above using antibodies listed in Supplementary Table 9.
Ex vivo teased tibial nerve recordings
Extracellular recordings from single cutaneous primary afferent axons in an isolated mouse glabrous skin–tibial nerve preparation were obtained following previously published procedures69,70. Three months (days 85–98) after injection with either autoantibody (arthritis) or saline (control; n = 5, both males and females), mice were killed by cervical dislocation, and the glabrous skin from one hind paw with the tibial nerve attached was dissected and placed in a custom-made two-compartment Teflon recording chamber with the corium side down. The chamber containing the preparation was continuously superfused at a rate of 5 ml per min with oxygenated external solution consisting of 107.8 mM NaCl, 26.2 mM NaHCO3, 9.64 mM sodium gluconate, 7.6 mM sucrose, 5.55 mM glucose, 3.5 mM KCl, 1.67 mM NaH2PO4, 1.53 mM CaCl2 and 0.69 mM MgSO4, which was adjusted to pH 7.4 by continuously gassing with 95% O2, 5% CO2. The temperature was maintained to ±1 °C using a heat exchanger connected to a thermostat. The tibial nerve was placed into an adjacent chamber of the bath filled with mineral oil and then teased into small bundles that were individually placed on a gold wire electrode. A reference electrode was positioned inside the recording chamber dipped into the aqueous solution. Input signals were amplified through a high-gain AC differential amplifier (Neurolog NL104A, Digitimer), digitized (PowerLab 8, ADInstruments) at 25 kHz and stored in the hard drive of a PC for offline analysis. The LabChart software package (ADInstruments) was used for recording and offline analysis. Mechanically responsive receptive fields were identified by probing the skin flap with a blunt glass rod. Once a suitable fiber was found, a mechanical stimulator consisting of a tension/length feedback controller (300C-I, Aurora Scientific) was used to apply mechanical stimuli. Two different force protocols were used to characterize mechanical responses. Threshold and firing frequencies were measured during continuous force ramps from 0 to 100 mN (ramp duration 10 s) and firing frequencies during static force applications (0 to 5, 10, 20, 40, 50, 75, 150 and 200 mN, step duration 10 s; 50-s interforce interval). Only mechanically responsive C-fibers (conduction velocity of <1.2 m s−1) were used in these experiments71. The experimenter was blinded to genotype until data analysis was complete.
Statistics and reproducibility
Behavior data for the von Frey filament up–down test and nocifensive behavioral tests (including the 2-g von Frey, acetone cold allodynia, pinprick and squeeze tests) as well as the sunflower seed assay (noncontinuous data) are presented as median with interquartile range. Heat hypersensitivity, inverted screen test data, western blotting quantification data and cytokine levels in sera are presented as mean ± s.d. Clinical scores and qPCR data are shown as mean ± s.e.m. A P value less than 0.05 was considered significant. Data were analyzed with Prism 10.2.0 (GraphPad software) as specified in the figure legends. The sample size was determined according to our previous experience and publication54. Animals for the experimental groups were randomly assigned. Animal exclusion was applied to those that were not suitable for behavioral tests during the testing day. Animal behavioral assessments were blinded during testing and quantification of videos. Skin nerve recordings and patch clamp recordings were blinded. Single-cell data analysis was not blinded.
Reporting summary
Further information on research design is available in the Nature Portfolio Reporting Summary linked to this article.