
Patients
Complete eligibility criteria are shown in Supplementary Table 6. Sex was recorded as a binary variable based on self-reported biological characteristics. Gender identity was not collected or analyzed in this study. No analyses stratified by sex were conducted.
Study design
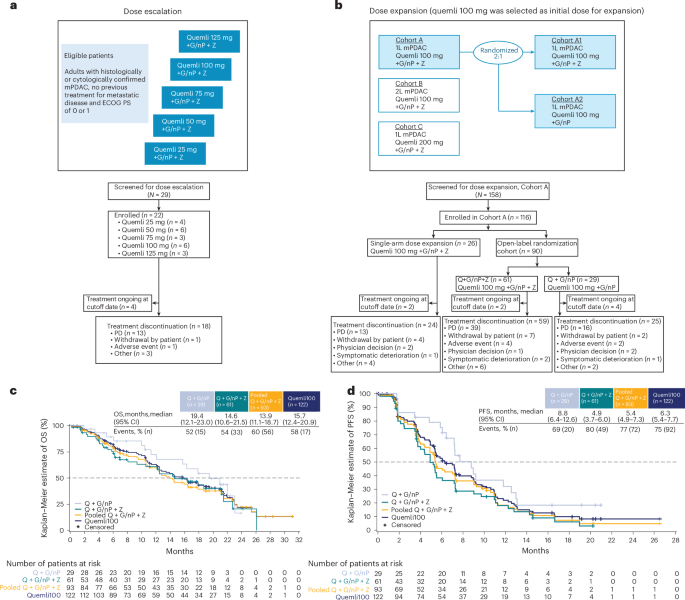
The study design for the ARC-8 trial is provided in Fig. 1. The primary endpoints included safety and tolerability of quemliclustat combination therapy. Secondary endpoints included ORR, DCR, DOR, PFS and OS. Additional planned secondary endpoints not reported in this paper are plasma concentration and pharmacokinetic parameters for quemliclustat, serum concentration and pharmacokinetic parameters for zimberelimab and number and percentage of patients who develop antidrug antibodies to zimberelimab.
The study was conducted in full conformance with the Declaration of Helsinki, the Council for International Organizations of Medical Sciences International Ethical Guidelines, institutional review board regulations and all other applicable local regulations. The study protocol was approved by the local ethics committee at each site (Supplementary Table 7). All patients provided written informed consent before any study procedures, and patients were not compensated monetarily for participation in this trial.
Dose-escalation phase
The dose-escalation phase employed a ‘3 + 3’ design with a 28-day DLT evaluation period (Supplementary Table 8). Three patients were enrolled in the initial dose cohort. Patients were considered evaluable for DLT if they received at least one dose of quemliclustat, received at least one dose of zimberelimab and completed the 28-day DLT evaluation period or experienced a DLT during the DLT evaluation period. When a minimum of three DLT-evaluable patients completed the DLT evaluation period for a given quemliclustat dose level, subsequent patients could be enrolled at the same, a lower or a higher dose level, and up to six patients could be treated at each dose level. The planned sample size for the dose-escalation phase was approximately 30 patients, based on the ‘3 + 3’ design. A patient not DLT evaluable was replaced with another patient at the same dose level. Disease status was evaluated every 8 weeks until disease progression (regardless of whether the patient was still receiving study treatment), study discontinuation or initiation of an alternative anticancer treatment.
Patients received quemliclustat intravenously (25 mg, 50 mg, 75 mg, 100 mg or 125 mg) every 2 weeks, G/nP (gemcitabine 1,000 mg m−2 and nab-paclitaxel 125 mg m−2) intravenously on days 1, 8 and 15 of a 28-day cycle and zimberelimab 240 mg intravenously every 2 weeks. The maximum tolerated dose was defined as the maximum dose at which fewer than 33% of patients experienced a DLT. The RP2D of quemliclustat was selected based on overall safety and tolerability, pharmacokinetics and pharmacodynamics.
Dose-expansion phase
The dose-expansion phase evaluated the RP2D of quemliclustat in patients with treatment-naive mPDAC. Initially, a single non-randomized arm of patients received the quemliclustat RP2D combined with G/nP and zimberelimab. After the prespecified interim analysis of the non-randomized arm, two additional arms were opened, and patients were enrolled and randomized 2:1 using the permuted block method to receive the quemliclustat RP2D combined with G/nP with or without zimberelimab. Subsequent prespecified data reviews were conducted every 6 months or after 45 patients were randomized and disease evaluable across both randomized arms, whichever occurred first.
ARC-8 (NCT04104672) was registered on 24 September 2019 with ClinicalTrials.gov.
Assessments
Tumor response was assessed by investigators using Response Evaluation Criteria in Solid Tumors v.1.1. Endpoints included ORR based on confirmed and unconfirmed best overall response, PFS and OS.
Safety data included type, incidence, seriousness, causality and severity of TEAEs and serious adverse events, as assessed by investigators according to the National Cancer Institute’s Common Terminology Criteria for Adverse Events v.5.0 (ref. 47). Adverse events were coded using the Medical Dictionary for Regulatory Activities v.26.1.
Statistical analysis
Analyses were based on the safety-evaluable population, defined as all patients who received at least one dose of any study treatment. The sample size justification was based on an estimation framework, and the study was designed for descriptive statistical analysis rather than formal statistical hypothesis testing involving power and type I error considerations. The planned sample size for the randomization portion of the dose-expansion phase was approximately 90 patients in a 2:1 ratio, with approximately 60 patients in the Q + G/nP + Z arm and approximately 30 patients in the Q + G/nP arm. Assuming a 40% ORR (24/60) in the Q + G/nP + Z arm and a 20% ORR (6/30) in the Q + G/nP arm, the 90% CI for the difference in ORR would be 3–37%, with the lower bound excluding the null value of 0%.
ORR was defined as the percentage of patients with a best overall response of complete or partial response and summarized with two-sided 95% CIs using the Clopper−Pearson method48. DCR was defined as the percentage of patients with a best overall response of complete response, partial response or stable disease. DOR was defined as the time from first documentation of disease response (complete or partial response) until first documentation of progressive disease or death, whichever occurs first. Responders without documented disease progression who were still alive at the time of analysis were censored at the time of their last tumor assessment. Median DOR was estimated using the Kaplan−Meier method, with two-sided 95% CIs calculated using the Brookmeyer−Crowley method. PFS was defined as the time from first dose to progressive disease or death due to any cause. OS was defined as the time from the first dose of study drug to death due to any cause. OS and PFS were estimated using Kaplan−Meier methodology. Median time to event for OS and PFS with two-sided 95% CIs was estimated using the Brookmeyer−Crowley method.
This interim analysis assessed emerging efficacy and safety data after all patients had been followed for at least 18 months. The analysis was not prespecified in the protocol and did not include formal futility boundaries; therefore, it was descriptive in nature and not intended to support definitive conclusions regarding efficacy or futility. Datasets for the clinical trial were prepared using standards from Clinical Data Interchange Consortium Study Data Tabulation Model implementation for human clinical trials and the Analysis Dataset Model.
SCA analysis
In a post hoc analysis, we constructed an SCA to evaluate the efficacy of quemliclustat in patients with mPDAC, given that recruiting a control group for this patient population is challenging. The SCA analysis compared the efficacy outcomes of ARC-8 to the outcomes of a cohort of patients treated with G/nP alone in historical clinical trials. Patients with first-line mPDAC who received at least one dose of quemliclustat 100 mg in combination with G/nP with or without zimberelimab in the dose-escalation or dose-expansion phases of ARC-8 were compared to similar patients from historical clinical trials in first-line mPDAC who were treated with G/nP alone.
Historical clinical trial patient-level data for the SCA were sourced from electronic data capture available through an optional data-sharing program (Medidata Solutions, Inc., a Dassault Systèmes company). All available interventional trials completed before 7 June 2023 that enrolled adults with first-line mPDAC with a design that provided an opportunity to be assigned to G/nP were included in the search for eligible SCA patients. Up to four completed historical phase 2 or phase 3 randomized clinical trials were identified. All patients within these trials who satisfied prespecified SCA eligibility criteria (Supplementary Table 3), which were patterned after key eligibility criteria of the ARC-8 study, were included in the SCA-eligible cohort. Trials and patients were selected while blinded to all patient-level outcomes. Patient-level data, including baseline, outcome, prognostic and other variable definitions and conventions, were aligned to create a harmonized analysis dataset across historical clinical trials and ARC-8 using the data specifications from the ARC-8 study.
Propensity score methods commonly used to analyze observational data to reduce bias due to confounding variables that are unbalanced between groups of interest were used to create a one-to-one matching ratio between the Quemli100 cohort in ARC-8 and the SCA49,50. Specifically, greedy nearest neighbor propensity score matching without replacement, no caliper restriction and exact matching on the presence of liver metastases at baseline were used. All other available baseline and clinically important covariates considered necessary to achieve a well-balanced comparator group were included in the propensity score model (Supplementary Table 3). Balance was assessed using absolute standardized difference in covariate means51,52. Absolute standardized differences less than 0.25 were defined in a prespecified statistical analysis plan as indicating sufficiently well-balanced groups, with values less than 0.10 indicating negligible differences53,54. All propensity score modeling was completed while blinded to patient-level outcome data.
Efficacy endpoints of interest included OS, PFS and unconfirmed ORR. The index date for calculating OS and PFS was the date of first dose of study medication. Treatment effects for OS, PFS and unconfirmed ORR were analyzed by comparing the Quemli100 cohort in ARC-8 with the SCA. The Kaplan−Meier method was used to estimate PFS and OS rates at specified time intervals. Data for the SCA are part of the Medidata data-sharing program and were collected using Rave Electronic Data Capture. The data were extracted and standardized to ADaM datasets in SAS v.9.4.
Cell culture experiments
Cell lines were purchased from the American Type Culture Collection and cultured based on the supplier’s recommendations. CAFs from a human pancreatic tumor were purchased from Neuromics (no. CAF118) and cultured based on the supplier’s recommendations. Human T cells were isolated from healthy donor blood using EasySep Human T Cell Isolation Kits (STEMCELL Technologies, 17592 and 17953). Cells were incubated in the presence of AMP (Thermo Fisher Scientific, J61643.06) and EHNA (Sigma-Aldrich, 324630) or NECA (Sigma-Aldrich, E2387) for 6 hours before RNA extraction. Total RNA was extracted using the RNeasy Mini Kit (Qiagen) according to the manufacturer’s instructions. cDNA was synthesized using SuperScript IV First-Strand Synthesis System (Thermo Fisher Scientific, 18-091-050), and real-time PCR was carried out using TaqMan (Thermo Fisher Scientific) assays NR4A1 (Hs00374226_m1; cat. no. 4331182), NR4A2 (Hs01117527_g1; cat. no. 4331182), NR4A3 (Hs00545009_g1; cat. no. 4331182), HPRT1 (Hs02800695_m1; cat. no. 4448489) and ACTB (Hs01060665_g1; cat. no. 4448484). For RNA-seq, libraries were prepared using Illumina Stranded mRNA Prep. Sequencing was performed using Illumina NovaSeq 6000 at 150-bp paired-end reads for 20 million paired-end (40 million total) reads per sample.
Tumor sample analysis
Pretreatment tumor biopsy was mandatory, whereas on-treatment biopsy was optional. Tumor formalin-fixed paraffin-embedded (FFPE) samples were profiled using RNA-seq. RNA was extracted from FFPE samples using the MagMAX FFPE DNA/RNA Ultra Kit (Thermo Fisher Scientific). Macrodissection was performed to enrich for 70% tumor content where possible. RNA-seq libraries were prepared with the TruSeq RNA Exome Kit (Illumina). Sequencing was performed on Illumina systems using 150-bp paired-end, dual-index reads. Samples were sequenced to a depth of 100 million paired-end (200 million total) reads.
RNA-seq preprocessing
Quality control was performed using FASTQC55. Reads were aligned to the GRCh38 human reference genome (Ensembl v.104) using the STAR aligner56, and quantification was performed using Salmon57 with GENCODE v.38 annotations58. Count data were further normalized using library size adjustment and trimmed mean of M-values normalization, followed by voom transformation59.
Differential gene expression analysis
Limma-voom59 with precision weights was used for differential gene expression analysis comparing different experimental conditions as contrasts using the following formula for the model matrix, where ~ indicates ‘modeled as/by’:
$$\sim \,0+\mathrm{Treatment}$$
For CD8 T cells, the model is adjusted for donor, as follows:
$$\sim \,0+\mathrm{Treatment}+\mathrm{Donor}$$
Genes were considered significantly upregulated by AMP + EHNA if they showed fold change ≥ 50% and adjusted P < 0.05 across all tested cell types. For quemliclustat inhibition analysis in cancer cell lines, genes were considered significantly inhibited if they showed ≥50% reduction in expression when quemliclustat was co-treated with AMP + EHNA compared to AMP + EHNA alone, with adjusted P < 0.05.
Gene set enrichment analysis (GSEA) was performed on the ranking of t-statistics from the differential gene expression analyses using the Fast GSEA (FGSEA) package60. Gene set scores were calculated using single-sample GSEA (ssGSEA)61 implemented in the gene set variation analysis (GSVA) package62. ssGSEA calculates enrichment scores based on the cumulative distribution of gene expression ranks within each sample. The ssGSEA scores were calculated for consistency in comparisons among different studies.
Analysis of snRNA-seq dataset
Processed snRNA-seq data were downloaded from the Gene Expression Omnibus (accession ID GSE202051 (ref. 31)) and were analyzed using the R programming language using the Seurat package. The author-normalized RNA assay and reductions for principal component analysis, Harmony and uniform manifold approximation and projection were extracted and converted to a Seurat object for further analysis. Author cell type annotations were used for analysis. AUCell was used to calculate gene set scores for the NR4A family63. We applied the PurIST algorithm, which may be used accurately on low-input and degraded samples64, to the RNA-seq data. We classified patients from the ARC-8 study as classical molecular subtype or basal-like molecular subtype.
Dual ISH
Dual ISH was used to detect mRNA transcripts for NR4A1 and IFNγ in FFPE tissue sections. Staining was performed on the Leica Bond Rx automated staining platform using the RNAscope 2.5 LS Duplex Reagent Kit (Advanced Cell Diagnostics, 322440) according to the manufacturer’s recommended protocol. In brief, FFPE tissue sections (4–5 µm) were air dried or baked at 60 °C for 30 minutes, and deparaffinization and rehydration were performed according to the standard Leica Bond protocol. Peroxidase blocking and pretreatment with Protease III were performed with the aforementioned kit according to the specified protocol for the automated red/green duplex assay. Hybridization was simultaneously performed with probe 1 (red channel, C1; LS 2.5 Probe-Hs-IFNG, RNascope, 310508) and probe 2 (green channel, C2; 2.5 LS Probe-Hs-NR4A1-C2, RNascope, 851028-C2) supplied at 50× and diluted to 1× in probe diluent (Advanced Cell Diagnostics). After probe hybridization, 10 rounds of amplification and thorough washing steps were performed, followed by green and red chromogen deposition (Leica Biosystems; BOND Polymer Refine Red Detection, DS9390, and Green Chromogen, DC9913) and counterstaining according to the manufacturer’s recommended protocol. Additional probes were used as positive and negative controls (negative controls: 2.5 LS Duplex Control Probes (PPIB-C1, Polr2A-C2)-Human (RNAscope, 320748), 2.5 LS Duplex Negative Control Probe (DapB-C1, DapB-C2) (RNAscope, 320758)). Slides were air dried and mounted using EcoMount (Biocare Medical, EM897L). Probes for NR4A2 (2.5 LS Probe-Hs-NR4A2; RNAscope, 582628) and NR4A3 (2.5 LS Probe-Hs-NR4A3; RNAscope, 575018) were also evaluated.
Whole-slide scanning was performed at ×40 magnification on the Pannoramic MIDI II Digital Scanner from 3DHISTECH (Epredia).
mIF staining
mIF staining was performed on the Leica Bond Rx automated staining platform using the Opal 6-plex Detection Kit (Akoya Biosciences, NEL871001KT) for sequential staining of each marker. Markers were optimized, validated and tested in multiple staining positions subjected to multiple rounds of heat-induced epitope retrieval at pH 9.0 (Leica Biosystems; BOND Epitope Retrieval Solution 2, AR9640) to determine sequence position and antibody stripping efficiency using single-plex chromogenic detection before incorporation into the mIF panel. The final panel used included LAG3 (Leica Biosystems; clone 12H6, RTU Predilute, cat. no. PA0300, lot no. 79548), TOX (Cell Signaling Technology; clone E613Q, 1:1,500 dilution (0.045 µg ml−1), cat. no. 73758S, lot no. 1), CD3 (Leica Biosystems; clone LN10, RTU Predilute, cat. no. PA0553, lot no. 82525), PanCK (Abcam; clone AE1/AE3 + 5D3, 1:500 dilution (2 µg ml−1), cat. no. ab86734, lot no. GR3253264-1), FoxP3 (Cell Signaling Technology; clone D2W8E, 1:200 dilution (0.775 µg ml−1), cat. no. 98377S, lot no. 8) and CD8 (Cell Signaling Technology; clone D8A8Y, 1:200 dilution (0.125 µg ml−1), cat. no. 85336S, lot no. 5) in corresponding positions 1−6. FFPE slides were cut at 4–5-µm thickness on a Leica rotary microtome and baked at 60 °C for 1 hour; deparaffinization, rehydration, peroxidase blocking and antigen retrieval were performed according to the standard Leica Bond immunohistochemistry protocol. Each marker was detected in the order listed above using MACH2 Universal HRP Polymer (Biocare Medical, M2U522L) followed by OPAL dyes 690, 520, 570, 480 and 620 and, finally, OPAL TSA DIG followed by OPAL 780. A heat-induced primary antibody stripping step of 20 minutes at 98 °C in pH 9.0 buffer was performed after detection of each of the first five primary antibodies. Lastly, spectral DAPI was applied, and slides were mounted using ProLong Diamond Antifade Mountant (Life Technologies, P36961). Whole-slide scanning was performed at ×20 magnification on the Akoya Biosciences PhenoImager HT 2.0 spectral imaging system following the manufacturer’s instructions. All primary antibodies were validated for specificity by the respective manufacturers. Validation in the mIF setting was performed by comparing immunofluorescent staining patterns with the patterns obtained by gold standard chromogenic immunohistochemistry on tissue sections known to express the antibody targets.
Digital image analysis
Biomarker quantification for mIF images and RNAscope images was performed using HALO software (v.3.6, Indica Labs). Images were annotated to select tissue regions for analysis. Artifacts, folds, necrotic regions and normal tissue regions, such as normal liver and pancreatic tissue, were excluded from analysis. DenseNET V2 HALO AI classifier was used to train and segment tissues into Tumor (epithelial), Stromal and Glass categories for chromogenic and fluorescent images. Tumor tissue classification was selected based on PanCK staining for mIF images, whereas tumor classification from RNAscope images was categorized based on tissue architecture and nuclear morphology according to RNAscope and hematoxylin and eosin images. The classification and analysis algorithms were trained on random images, and the optimized algorithm was applied to all images to perform batch analysis. Images that needed custom threshold levels were analyzed with a custom algorithm.
mIF analysis
HighPlex FL module v.4.2.14.32 was used for mIF quantification. DAPI nuclear stain was used for detection and segmentation of nuclei. A positivity threshold was set for each marker based on nuclear or cytoplasmic expression and staining intensity such that no false positive or false negative was being quantified. Phenotypes were added according to the marker panel used in the 6-plex mIF. Immune phenotypes were quantified according to epithelial (tumor) and stromal compartments. Object data were saved for each image to acquire the positivity for individual markers and the co-localization of markers for phenotype detection as well as the x and y coordinates of all cells for performing further spatial analysis. The following phenotypes were detected from panel 1: PanCK+ (cancer cells), CD3+ (T cells), CD3+CD8+ (cytotoxic T cells), CD3+LAG3+ and CD8+LAG3+ (exhausted T cells) and CD3+FoxP3+ (regulatory T cells).
Dual ISH analysis
ISH module v4.2.11.14 was used for RNAscope analysis. Green chromogen signal was used for detection of NR4A1 and red chromogen for detection of IFNγ. An exclusion stain was designated to exclude any artifacts. RNAscope Cell Scoring within the ISH module was used for scoring probe copies according to 1+, 2+, 3+ and 4+ scores based on minimum copies per cell of 1, 4, 10 and 16, respectively. Quantification of probes was performed according to tumor and stroma classification previously described. Cells with NR4A1 with fewer than four copies were termed as NR4A1low, and cells with NR4A1 with more than 16 copies were termed as NR4A1high. Cells with no NR4A1 copies were termed as NR4A1negative. Cells that were positive for IFNγ irrespective of copy number were termed as IFNγ+.
Image fusing
Chromogenic RNAscope images were deconvoluted and converted into pseudofluorescent images using the Deconvolution module (v.2.0.1) in HALO software (v.4.0, Indica Labs). The deconvoluted RNAscope image was then registered with its corresponding mIF image using serial stain registration. The registered deconvoluted RNAscope image and mIF image were fused using serial stain fusing to create a composite image of ISH + mIF. The fused images generated were used for demonstrating the levels and spatial proximity of immune phenotypes, such as CD3+CD8+ in relation to NR4A1high or NR4A1low copy cells and expression of IFNγ.
Spatial analysis
Spatial plots were generated using object data to show spatial location of immune phenotypes (CD8+, CD3+CD8+, CD3+LAG3+, CD8+Lag3+ and CD3+FoxP3+) in relation to PanCK+ cells and NR4A1 high or low copy cells. Nearest neighbor and proximity analyses were performed using the HALO Spatial Analysis module. Nearest neighbor analysis was performed on RNAscope images to quantify the distance between IFNγ+ cells and NR4A1negative, NR4A1low copy and NR4A1high copy cells. Proximity analysis was performed on RNAscope images to quantify the percentage of IFNγ+ cells in 10-μm intervals within 50 μm from NR4A1low copy and NR4A1high copy cells. For mIF staining, proximity analysis was performed to measure CD3+ T cells and T cell subsets in 10-μm intervals within 50 μm of PanCK+ cancer cells.
Survival analysis for biomarkers
All molecular biomarker data were analyzed for associations with clinical outcomes using the R programming language. Gene expression and signature analyses were performed by dividing patients into high versus low groups using median cutoffs or optimized thresholds, as specified in the corresponding figures. Optimal thresholds were determined using the bestcut algorithm in the survminer R package65, which identifies thresholds that maximize statistical significance of separation between groups. The parameter min.prop = 0.25 was applied, ensuring that at least 25% of samples fell into one of the two groups and reducing the likelihood of outliers driving the result. Kaplan−Meier survival analyses were conducted, with log-rank P values calculated using the survival and survminer R packages. Visualization of differences between defined groups was performed using ggplot2 and base R plotting functions. Forest plots were generated for NR4A family signature and NR4A family genes (NR4A1, NR4A2and NR4A3) across different clinical trials to determine hazard ratio and CI of each biomarker in relation to each other. Hazard ratios were calculated using continuous Cox regression analysis between scaled biomarker expression levels and survival outcomes.
Data from external studies
For the PRINCE trial, RNA-seq data were downloaded from the publicly available GitHub repository associated with the original publication12 (https://github.com/ParkerICI/prince-trial-data). We used the author-processed data without further reprocessing. Clinical outcomes (OS and PFS) were examined biomarkers following the same procedures described in the Survival analysis for biomarkers section.
MORPHEUS-PDAC37 data were obtained from Roche through a data-sharing agreement. RNA-seq data were processed using the same pipeline described in the RNA-seq preprocessing section for the ARC-8 cohort. Clinical outcomes (OS and PFS) were examined in biomarkers following the same procedures described in the Survival analysis for biomarkers section.
Software
SAS v.9.4 was used for analyses. Nextflow v.21.04 pipeline running nf-core/rnaseq v.3.0 with FASTQC 0.11.9, STAR v.2.6.1d and Salmon v.1.4.0 were used for quality control, alignment and quantification of RNA-seq data. Seurat v.5 and AUCell v.1.30 were used for single-cell RNA-seq analyses. Statistical analyses for biomarker associations and visualizations were conducted in R v.4.5 using the survminer, survival and ggplot packages. Digital image analyses were performed using HALO software v.3.6, and statistical analysis was performed using GraphPad Prism v.10.6.0 (build 890).
Reporting summary
Further information on research design is available in the Nature Portfolio Reporting Summary linked to this article.