

Zfp36l1 and Zfp36l2 in TECs redundantly regulate thymus cellularity
To investigate whether the stabilization of Dll4 mRNA, which has a short half-life because of the presence of AREs within its 3’-UTR (unpublished observation), could delay age-associated thymic involution, we generated a conditional double knockout (DKO) mouse strain in which two ARE binding proteins, Zfp36l1 and Zfp36l2, were specifically deleted in TECs using a Foxn1-cre driver. Contrary to our expectation, one-year-old DKO mice exhibited markedly reduced thymus cellularity, which decreased to less than 10% of that observed in floxed controls (Fig. 1A). Analysis of younger DKO mice revealed that thymus hypoplasia was already evident at three weeks of age (Fig. 1A). Examination of 7-week-old single conditional knockout mice revealed that Zfp36l1 plays a dominant role in TECs, whereas Zfp36l2 provides incomplete compensation. While Zfp36l2 deficiency alone did not affect thymic cellularity, Zfp36l1 single-knockout mice exhibited a consistent trend toward decreased cellularity, although the difference did not reach statistical significance (Fig. 1B).
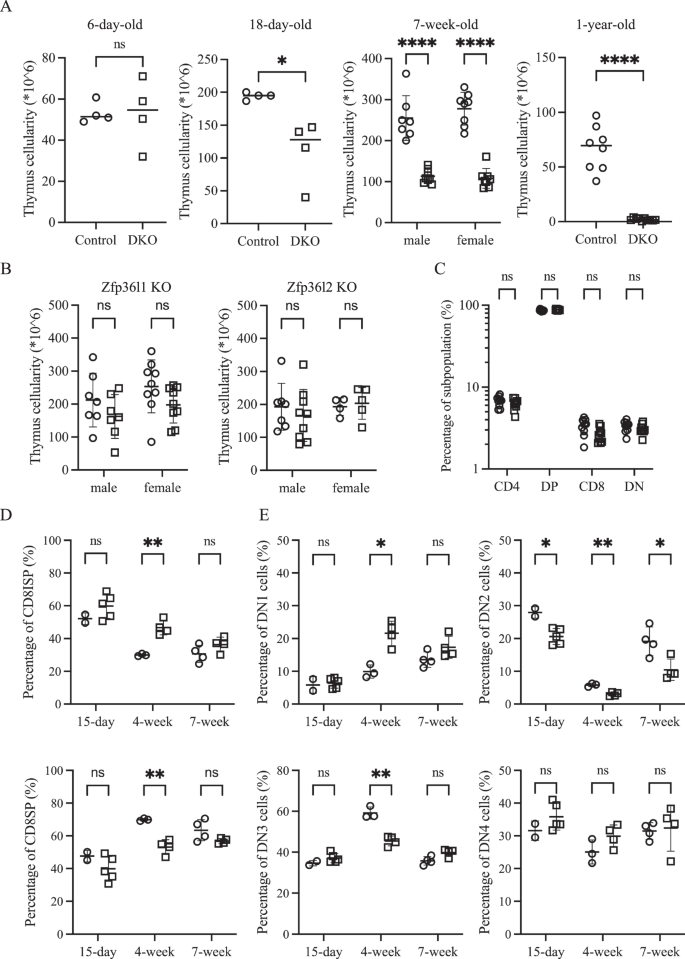
Zfp36l1 and Zfp36l2 in TECs redundantly regulate thymus size. A Total thymus cellularity is compared between floxed control (○) and DKO (□) mice at four different ages, revealing a progressive decrease in DKO mice. B Scatter plots showing thymus cellularity in 7-week-old control mice (○) versus mice deficient in Zfp36l1 (left) or Zfp36l2 (right) (□), highlighting the dominant role of Zfp36l1. C Frequencies of four major thymocyte subsets (based on CD4 and CD8 expression) were compared between 7-week-old control (○) and DKO (□) mice. D The percentages of CD8ISP (top) and CD8SP among CD4–CD8+ thymocytes at three different ages are skewed toward the CD8ISP in DKO mice (□) compared with those in controls (○) at 4 weeks of age. E Scatter plots comparing the frequency of four DN subsets between control (○) and DKO mice (□) at three different ages, with a notable reduction in DN2 and DN3 cells in DKO mice
Despite this profound decline in cellularity, the relative distribution of the 4 major thymocyte subsets, defined by CD4 and CD8 expression, remained largely preserved (Fig. 1C and Supplementary Fig. 1 for gating strategies). However, longitudinal analyses revealed more subtle developmental perturbations. Specifically, in 4-week-old DKO mice, the ratio of CD8 immature single-positive (ISP) cells to mature CD8 single-positive (SP) cells was skewed toward CD8ISP cells (Fig. 1D). Additionally, within the CD4–CD8– double-negative (DN) subset, DKO thymuses exhibited relatively fewer DN2 and DN3 cells and a greater proportion of DN1 cells, while the DN4 cell frequency was comparable to that of the controls (Fig. 1E). With the exception of a persistent reduction in DN2 cells, these differences were not observed at either 15 days or 7 weeks of age.
Loss of Zfp36l1/2 in TECs alters the mTEC phenotype in adult mice
To further characterize the potential effects of the loss of Zfp36l1/2 on TECs, we analyzed TECs that were enzymatically dissociated from seven-week-old thymuses by flow cytometry. TECs, identified as EpCAM+ CD45– cells, were reduced in frequency among total thymic cells by approximately 50% in DKO mice compared with those in controls (Fig. 2A, B). Combined with the decrease in total thymocyte numbers, this led to an ~80% reduction in the number of recovered TECs, with control mice having ~2 × 10⁵ TECs and DKO mice having ~4 × 10⁴ TECs (Fig. 2B).

Zfp36l1 and Zfp36l2 deficiency in TECs leads to a severe reduction in mTECs in adult mice. A Representative flow cytometry pseudocolor plots display the percentages of total TECs and their subpopulations in 7-week-old control (top) and DKO (bottom) mice. B Scatter plots comparing the percentage (left) and absolute number (right) of total TECs between 7-week-old control (○) and DKO (□) mice. C Percentages of four TEC subpopulations are shown for control (○) and DKO (□) mice, revealing an altered mTEC profile in DKO mice. D Absolute numbers of TEC subpopulations were compared between control (○) and DKO (□) mice, and a pronounced reduction in mTECs was detected in DKO mice
Consistent with previous reports that enzymatic preparation preferentially damages cTECs relative to mTECs [22, 23], most recovered TECs were UEA1+Ly51– mTECs (Fig. 2C, D). However, DKO mTECs exhibited an altered surface marker profile, with many becoming atypical UEA1+Ly51+ or UEA1–Ly51– cells, which were less common in control thymuses (Fig. 2C, D). While the increased frequency of UEA1–Ly51– cells likely reflects an expansion of the recently reported age-associated TEC population [24], the accumulation of UEA1+Ly51+ cells may indicate developmental arrest en route to either UEA1+Ly51– mTECs or UEA1–Ly51+ cTECs. Alternatively, UEA1+Ly51+ cells may represent mature mTECs expressing Ly51. Additionally, a significant increase in the proportion of UEA1–Ly51+ cTECs was observed in the thymus of DKO mice (Fig. 2C). Analysis of single-gene knockouts supported the dominant role of Zfp36l1 over Zfp36l2 in TECs (Supplementary Fig. 2).
Preferential loss of cTECs in the neonatal DKO thymus
To determine the developmental stage at which TEC loss initiates, we examined neonatal mice at postnatal day 6 (P6), when total thymic cellularity was comparable between DKO and control mice (Fig. 1A). Nonetheless, compared with that in control mice, the frequency of TECs among total thymic cells in DKO mice was decreased by approximately 75% (Fig. 3A, B), corresponding to a substantial reduction in absolute TEC numbers. Analysis of TEC subsets revealed that UEA1–Ly51+ cTECs, which accounted for nearly half of the TECs in control mice, were markedly reduced in DKO mice, constituting less than 30% of the total TEC population (Fig. 3C). As a result, the proportion of UEA1+Ly51– mTECs increased, although their absolute cell numbers were lower than those in the controls (Fig. 3D). These results indicate that TEC loss initiates before birth, with cTEC showing a earlier reduction than mTEC.

Preferential loss of cTECs in the neonatal DKO thymus. A Representative flow cytometry pseudocolor plots illustrate the percentages of total TECs and their subpopulations in 6-day-old control (top) and DKO (bottom) thymuses. B Scatter plots comparing the percentage (left) and absolute number (right) of total TECs between control (○) and DKO (□) mice at postnatal day 6. C The percentage (left) and absolute number (right) of Ly51+UEA1– cTECs were compared between control (○) and DKO (□) mice, and a marked reduction was detected in DKO mice. D The percentage (left) and absolute number (right) of Ly51–UEA1+ mTECs were compared between control (○) and DKO (□) mice, with DKO mice increasing in number but decreasing in absolute number
Single-cell RNA sequencing (scRNA-seq) reveals abnormal expression levels of cell cycle- and cell fate-related genes in DKO TECs
To elucidate the molecular mechanisms underlying the observed TEC defects in Zfp36l1/2 DKO mice, we performed scRNA-seq on TECs sorted from neonatal thymuses (P6), which permitted us to investigate the effects of Zfp36l1 and Zfp36l2 deficiency on global gene expression in both the cTEC and mTEC subsets.
Unsupervised clustering revealed two distinct groups corresponding to cTECs and mTECs, with more subclusters within each group (Fig. 4A). Gene signatures of individual clusters revealed a clear differentiation and maturation trajectory extending from the top to the bottom of each island, with the respective progenitor cells—cluster 5 for cTECs and clusters 4 and 8 for mTECs—positioned at the top (Fig. 4B). Notably, two of the six signature genes in cluster 5, Frmd6 and Gpm6b, were among the previously identified gene signatures for cTEC-biased early progenitors [25]. Additionally, Ackr4, another signature gene of early progenitors identified in a previous study, exhibited its highest expression in cluster 5 (Fig. 4D). Similarly, six of the fourteen genes that were highly expressed in clusters 4 and 8, namely, Ccl21a, Fst, Mgp, Tagln, Tgfbi, and Sult5a1, corresponded to signature genes associated with mTEC-biased postnatal progenitor cells [25]. In particular, the strong expression of Ccl21a in clusters 4 and 8 aligns with recent findings that the majority of adult mTECs are derived from Ccl21a-expressing cells [26]. In further support of the inferred maturation trajectory, a gradual increase in the expression of Dll4 and Psmb11 was observed from the top to the bottom of the cTEC island, whereas the spatial expression patterns of Fezf2 and Aire across the mTEC island were consistent with progressive differentiation (Fig. 4D). On the basis of these transcriptional profiles, the clusters were annotated as follows: early progenitors (cluster 5), immature cTECs (cluster 6), mature cTECs (cluster 3), postnatal progenitors (PNP, clusters 4 and 8), mTEC1 (cluster 2), mTEC2 (cluster 1), mTEC3 (cluster 0), and transit-amplifying progenitors (cluster 7) (Fig. 4C). Transit-amplifying progenitors are characterized by elevated expression of histones, Cenpf and Prc1, two genes with known functions in cell cycle progression, particularly mitosis.

TECs from 6-day-old control and DKO thymuses exhibit distinct gene expression profiles. A UMAP plots visualizing TEC subpopulations based on transcriptomic profiles from 6-day-old control and DKO thymuses. B A heatmap displays signature genes defining individual TEC clusters. C Cluster annotation based on signature genes. D Feature plots illustrating the expression patterns of six representative TEC genes, Ackr4, Dll4, Psmb11, Ccl21a, Fezf2, and Aire. E Pathway analysis revealed enrichment of the type I IFN signaling pathway in DKO mature cTECs compared with controls
Consistent with the flow cytometry data, neonatal DKO TECs exhibited a pronounced transcriptional bias toward the mTEC lineage, with most cells localized within clusters 0, 1, 2, 4, 7, and 8. The distribution of cells between control and DKO samples differed significantly across all clusters (Supplementary Fig. 3A). RNA velocity analysis further revealed that postnatal progenitors in DKO mice appeared to be more developmentally immature, as they were predominantly located in cluster 4, whereas their control counterparts were primarily found in cluster 8 (Supplementary Fig. 3B). Additionally, most DKO cTECs were positioned at the periphery of clusters 3, 5, and 6, supporting their immature phenotype.
Among the differentially expressed genes, there were numerous transcription factors and several cell cycle–related genes (Supplementary Table 1). Notably, the expression of Tshz2, a putative tumor suppressor that represses cell cycle progression when overexpressed in a normal mammary cell line [27], increased across most clusters in DKO TECs compared with controls. Although the functional impact of its increased expression in TECs remains to be determined, it is plausible that it interferes with cell cycle progression through a mechanism similar to that in mammary cells. Furthermore, the expression of Cdkn1a and Cdkn1c, which encode the cell cycle inhibitors p21 and p57, respectively, was upregulated in multiple clusters of DKO TECs compared with control cells. Specifically, Cdkn1a expression was elevated in early progenitors, immature cTECs, mature cTECs, and postnatal progenitors, whereas Cdkn1c expression was increased in postnatal progenitors, mTEC1, and transit-amplifying progenitors. Together, their upregulation likely slowed cell cycle progression and consequently led to fewer TECs in the thymus of DKO mice.
Higher levels but lower frequencies of FOXN1 expression in embryonic DKO TECs
The elevated expression of negative cell cycle regulators in DKO TECs, along with the observed reduction in TEC cellularity in the neonatal thymus, prompted us to investigate whether the decreased TEC numbers were a result of impaired proliferation during embryonic thymus development. To assess this, we performed EdU pulse-labeling in timed-pregnant mice. However, no significant differences in the percentage of EdU-positive TECs, which represent cells in the S and early G2 phases, were detected between the DKO and control groups at any of the three embryonic time points analyzed: E13.5, E15.5, and E18.5 (Supplementary Fig. 4A, B). Nonetheless, a reduction in the percentage of TECs in DKO thymuses compared with that in controls was evident as early as E15.5 (Figs. 5A, B and Supplementary Fig. 4C). This phenotype mirrors that seen in the iFoxn1 mouse strain, which expresses ectopic Foxn1 in TECs (Supplementary Fig. 4C). Given that Foxn1 mRNA contains an ARE within its 3’UTR (Supplementary Fig. 4D) and that it is a potential direct target of Zfp36l1/2-mediated mRNA decay, we assessed FOXN1 protein levels in E15.5 embryonic TECs by intracellular flow cytometry. Among FOXN1-expressing TECs, DKO cells presented significantly higher FOXN1 protein levels than control cells did (Figs. 5C, D and Supplementary Fig. 4E). Conversely, a greater proportion of DKO TECs lacked detectable FOXN1 expression. The elevated FOXN1 protein levels within the expressing TEC population and the consequent upregulation of the expression of prolymphopoietic FOXN1 target genes such as Dll4, Ccl25, and Cxcl12 may compensate for the reduced number of TECs in supporting thymocyte development during the embryonic and neonatal stages. However, despite elevated FOXN1 protein levels in DKO TECs during fetal development, FOXN1 expression decreased to levels below those observed in control mice by two weeks postnatally (Fig. 5F and Supplementary Fig. 4F).

Increased FOXN1 levels but reduced FOXN1+ TEC frequency in embryonic DKO thymuses. A Representative flow cytometry pseudocolor plots comparing major thymic cell populations (CD45+ thymocytes, CD45–EpCam+ TECs, and CD45–EpCam– non-TECs) between control (top) and DKO (bottom) E15.5 thymuses. B Scatter plots showing total thymic cellularity (left), percentage (middle), and absolute number (right) of TECs between control (○) and DKO (□) E15.5 thymuses. C Representative flow cytometry histograms comparing the percentages of FOXN1-expressing TECs and FOXN1 levels in control (○) and DKO (□) E15.5 thymuses. D Scatter plots comparing the frequencies of FOXN1+ TECs (left), FOXN1– TECs (middle), and the mean fluorescence intensity (MFI) of FOXN1+ cells (right) between control (○) and DKO (□) thymuses at E15.5, revealing a decreased frequency of FOXN1-expressing cells but higher FOXN1 levels in DKO thymuses. E Overlay of flow cytometry histograms showing FOXN1 protein levels in cTECs from 9-day-old and 14-day-old mice. The mean fluorescence intensity (MFI) values are indicated. F A scatter plot of the MFI values of the FOXN1 protein in cTECs
Elevated levels of inflammatory cytokines contribute to premature thymic involution
To investigate whether the notable early thymic involution in DKO mice results from an autonomous deleterious effect of Zfp36l1 and Zfp36l2 deficiency in TECs, we compared the growth of reaggregated thymus organ cultures (RTOCs) composed of stromal cells from (1) floxed control thymus only, (2) Zfp36l1/2-deficient thymus only, or (3) an equal mixture of both genotypes. Although all RTOCs developed normally during the first week (Supplementary Fig. 5A), by the end of the three-week culture period, both RTOCs derived solely from DKO stroma and, more importantly, the mixed chimeric stroma had collapsed, indicating a cell-autonomous deleterious effect on DKO TECs (Fig. 6A). This observation prompted further investigation into the molecular mechanisms underlying this TEC-intrinsic dysfunction.

Elevated inflammatory cytokine levels contribute to early thymic involution in DKO mice. A A scatter plot comparing total cell numbers after 3 weeks of RTOC culture using stromal cells from control (○), DKO (□), or a 1:1 mixture of control and DKO stromal cells (∇); statistical significance was assessed by one-way ANOVA. B Scatter plots showing the percentages of class-switched B cells as defined by B220+CD11c–IgD–Ly6c+ (left) and activated B cells as defined by B220+CD11c–IgD–GL7+ (right) in control (○) and DKO mice (□) at three different ages, with DKO thymic B cells displaying a less active phenotype. C Percentages of cDC1 cells as defined by B220–CD11c+MHCII+SIRPα–XCR1+ (top) and activated cDC1 (acDC1) cells as defined by MHCIIhighCCR7+ cDC1 cells (bottom) in control (○) and DKO mice (□) at three different ages. D Percentages of cDC2 cells as defined by B220–CD11c+MHCII+SIRPα+XCR1– (top) and activated cDC2 (acDC2) cells as defined by MHCIIhighCCR7+ cDC2 cells (bottom) in control (○) and DKO mice (□) at three different ages. E Percentages of very late-stage mature single-positive (SP) cells as defined by CD3+TCRβc+CD69–CD24low/-MHCI+Qa-2+ with CD8SP (top) and CD4SP (bottom) in control (○) and DKO mice (□) at three different ages. G Flow cytometry pseudocolor plots comparing IL6 and TNFa expression in mTECs and cTECs after 4 h of GolgiStop treatment in 9-day-old control (top) and DKO (bottom) mice. F A scatter plot with a paired t test was constructed to compare the percentages of IL6+ mTECs after 4 h of GolgiStop treatment in control (○) and DKO (□) mice from postnatal day 9 to 3 weeks of age, revealing increased IL6 expression in DKO mTECs
Among the genes regulated by the TTP family of RNA-binding proteins, cytokines, including proinflammatory cytokines, represent a well-established class, in addition to transcription factors and cell cycle regulators [18]. mTECs produce type I IFNs [28], and our signaling pathway analysis of the scRNA-seq data suggested that genes related to type I IFN activation were enriched in DKO mature cTECs compared with their control counterparts (Fig. 4E). Both our group and others have shown that type I IFNs contribute to thymic atrophy during chronic LCMV infection and poly(I: C) treatment [13, 29]. On the basis of these findings, we examined whether potentially elevated type I IFN levels contributed to early thymic involution. However, transplantation of type I IFN-resistant Ifnar1-deficient BM did not lead to significant restoration of thymic cellularity in DKO mice (Supplementary Fig. 5B).
Recent studies have shown that intrathymic IFNs activate and license antigen-presenting dendritic cells (DCs) and B cells [30, 31]. Therefore, we examined the activation profiles of thymic DCs and B cells, as well as their impact on thymocyte maturation. Compared with control mice, thymic B cells from adolescent (4–7 weeks), but not infant (postnatal day 15), DKO mice exhibited lower licensing and activation profiles, as indicated by lower frequencies of Ly6c+ or GL7+ cells among IgD– cells (Fig. 6B). In parallel, adolescent DKO mice exhibited an altered thymic DC composition, with a relative increase in the ratio of cDC2 to cDC1 subsets (Fig. 6C, D). Notably, fewer cDC2s upregulated the expression of the activation marker CCR7 at 4 weeks of age, a difference that was no longer apparent at 7 weeks. Conversely, cDC1s from the infant DKO thymus showed increased activation, an effect that was lost in adolescent mice. Consistent with these changes, the maturation of CD8SP thymocytes was impaired in infant and early adolescent DKO mice, as evidenced by reduced frequencies of late-stage mature CD69–CD24low/-MHCIhiQa-2+ cells, which was consistent with a decreased proportion of CD8 T cells in the spleen (Fig. 6E and Supplementary Fig. 5C). In contrast, CD4SP maturation appeared to be unaffected. Although these findings contrast with the expectation that elevated IFN levels uniformly increase DC and B-cell activation, they instead suggest a reshaped thymic microenvironment in which additional inflammatory cues may modulate antigen-presenting cell function.
To explore the possibility of altered cytokine expression levels, neonatal TECs from DKO and control mice were treated with GolgiStop for 4 hours, followed by intracellular staining for IL-6 and TNFα. Compared with control mTECs, DKO mTECs expressed significantly more IL-6 and TNFα, although only the increase in IL-6 was statistically significant. In contrast, cTECs from both genotypes exhibited minimal expression of these cytokines (Fig. 6F, G and Supplementary Fig. 5C, D). Efforts to block the activities of these cytokines with neutralizing antibodies against IFNAR1, IL-6 and TNFα both in vivo and ex vivo failed to prevent premature thymic atrophy in DKO mice or the early collapse of DKO FTOCs when analyzed 18 days later with the regimens tested (data not shown). Given that mTECs express a broad array of cytokines that are absent or minimally expressed by cTECs (Supplementary Table 2) [17], identifying the specific cytokine(s) whose dysregulation drives altered TEC and thymocyte differentiation in the absence of Zfp36l1 and Zfp36l2 remains a significant challenge.