
Construction of Supt6 conditional knockout mice
To generate a Supt6 conditional knockout (KO) mouse model, we engineered mice with floxed Supt6 alleles in which loxP sites flanked exons 12-19. These mice (Supt6fl/fl) were then crossed with Keratin 14 (K14)-CreERT transgenic mice [11] to obtain tamoxifen-inducible, tissue-specific K14-CreERT; Supt6fl/fl mice (Fig. 1A). Throughout the manuscript, K14-CreERT; Supt6fl/fl will be referred to as Supt6 KO unless otherwise specified.

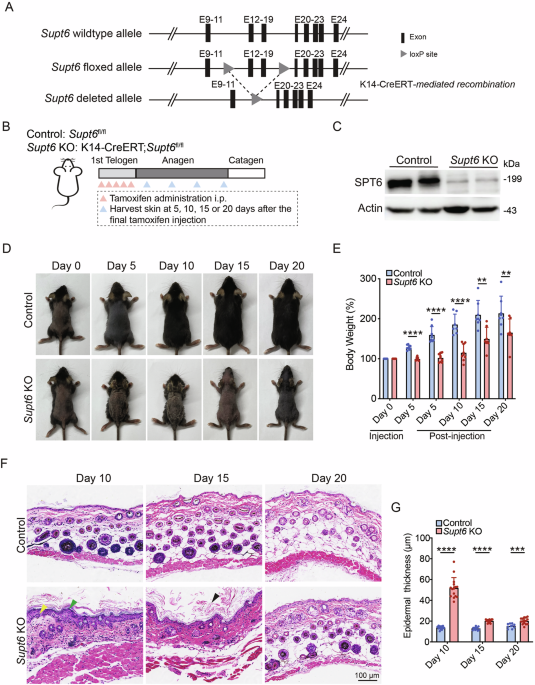
A Schematic representation of the strategy used to generate conditional Supt6 knockout (KO) mice using CRISPR-based genetic ablation and the Cre-loxP system. The gray triangles indicate the loxP site flanking the excised exons (black rectangles) of the Supt6 gene, enabling tissue-specific deletion upon K14-Cre recombinase expression. B Diagram illustrating the experimental timeline of tamoxifen-induced SPT6 deletion via intraperitoneal injection and the corresponding timepoints for harvesting skin samples. C Western blot analysis of SPT6 protein expression in control and Supt6-KO dorsal skin harvested on day 10 after the final tamoxifen injection. D Representative images showing the gross appearance of control and Supt6-KO mice at 0, 5, 10, 15, and 20 days after the final tamoxifen injection. E Relative body weight change (%) of control and Supt6-KO mice at 0 and 5 days after the first tamoxifen injection and at 5, 10, 15, and 20 days after the final tamoxifen injection. Body weight changes are calculated as percentages relative to the initial weight at injection day 0. F H&E staining of dorsal skin from control and Supt6-KO mice was performed at 10, 15, and 20 days after the final tamoxifen injection. The yellow arrowhead indicates epidermal hyperplasia. The green arrowheads indicate parakeratosis. The black arrowhead indicates hyperkeratosis. The scale bar represents 100 μm for H&E staining. G Quantification of the epidermal thickness of control and Supt6-KO mice was performed on days 10, 15, and 20 after the final tamoxifen injection. The mean values are shown with error bars representing the standard deviation (SD). Statistical significance is indicated as follows: **p < 0.01, ***p < 0.001, and ****p < 0.0001. n ≥ 6 per group (t-test)
To induce functional loss of SPT6, 50 mg/kg tamoxifen was administered intraperitoneally once daily for five consecutive days during the first telogen phase to induce SPT6 deletion. Control mice (Supt6fl/fl) received the same dose of corn oil as the vehicle control did. Skin samples were harvested at 5, 10, 15, and 20 days after the final tamoxifen or corn oil injection (Fig. 1B). Efficient tissue-specific deletion of SPT6 was confirmed at both the DNA and protein levels. Genomic PCR detected the expected floxed (~618 bp) and recombined (~457 bp) Supt6 alleles specifically in K14-expressing epithelial tissues (Supplementary Fig. 1A). Efficient deletion was further validated by reduced SPT6 protein levels in dorsal skin samples at 10 days post-tamoxifen injection (Fig. 1C).
Loss of SPT6 disrupts epidermal homeostasis in mouse skin
Notably, within 5 days of initiating tamoxifen treatment, the skin lesions of the Supt6-KO mice began to develop, with prominent skin thickening, particularly in the ear. By day 10 post-tamoxifen injection, the dorsal skin of the Supt6-KO mice exhibited scaling and crusting, which progressed to peeling and alopecia by day 15. These phenotypes were often accompanied by weight loss and signs of emaciation in more severe cases (Fig. 1D, E). To exclude abnormalities in the K14-positive epithelium of the upper digestive tract, we performed hematoxylin and eosin (H&E) staining of the tongue and esophagus, which revealed intact epithelial architecture with no evidence of epithelial erosion, structural abnormalities, or inflammatory infiltration in the Supt6-KO mice compared with the control mice (Supplementary Fig. 1B). The severity of skin lesions varied between mice and correlated with overall survival, depending on the extent and progression of skin pathology. Histological analyses of dorsal skin sections from Supt6-KO mice using H&E staining revealed significant disruption of epidermal homeostasis. Key pathological features included detachment of the stratum corneum, parakeratosis, and hyperkeratosis (Fig. 1F).
Additional findings included epidermal thickening and delayed hair cycle progression in Supt6-KO mice. Quantification revealed a significant 3-fold increase in Supt6-KO epidermis thickness compared with that of control mice at 10 days post-tamoxifen injection (Fig. 1G). Hair follicle analysis revealed preserved staining of the hair follicle stem cell marker SOX9 with no cleaved caspase-3 staining at the telogen phase (day 0 after tamoxifen injection), indicating that the follicle structure remained intact without loss of apoptosis. However, compared with control follicles, early anagen (day 4 after tamoxifen injection) Supt6-KO follicles exhibited reduced proliferation (few Ki67-positive cells), indicating impaired activation of hair follicle stem cells in the early anagen phase (Supplementary Fig. 1C). Interestingly, Ki67 staining in the epidermis began to increase on day 7 after the final tamoxifen injection in the Supt6-KO mice, which coincided with the onset of epidermal hyperplasia (Supplementary Fig. 1D, E). Both the epidermal thickening and the hair cycle delay were reversed by day 20 after the final injection of tamoxifen in the Supt6-KO mice (Fig. 1F, G).
Phenotypically, the pathological features of the Supt6-KO mice were not confined to the dorsal skin but were also observed at other lesion sites, including the ear, palm, and perianal areas (Fig. 2A and Supplementary Fig. 1F). H&E staining of the ear and digital skin confirmed the same histopathological features as those observed in the dorsal skin (Supplementary Fig. 1G).

A Representative images of dorsal and ear skin from Supt6-KO mice at 10 days after the final tamoxifen injection. B Transmission electron microscopy (TEM) of dorsal skin harvested from control (top panel) and Supt6-KO (bottom panel) mice on day 10 after the final tamoxifen injection. The blue arrowheads indicate desmosomes (top left panel), the yellow arrowheads indicate bubbles (bottom left panel), the green arrowheads indicate basement membrane (top and bottom right panel), the red arrowheads indicate nucleoli (top and bottom right panel), and the red asterisk indicates the epidermal side of the skin. The scale bar represents 2 μm for the TEM images. C Immunostaining of Keratin 1 (KRT1) and Keratin 10 (KRT10) in the dorsal skin of control and Supt6-KO mice harvested 10 days after the final tamoxifen injection. The white dashed line denotes epidermis/dermis boundaries. The scale bar represents 50 μm for immunostaining. D Immunostaining of Involucrin (IVL), Loricrin (LOR), and Filaggrin (FLG) in the dorsal skin of control and Supt6-KO mice 10 days after the final tamoxifen injection. The white dashed line denotes epidermis/dermis boundaries. The scale bar represents 50 μm for immunostaining. Quantification of the fluorescence intensity of KRT1/KRT10 (E) and IVL/LOR/FLG (F). G RNA-Seq analysis of control (n = 5) and Supt6-KO (n = 4) skin harvested 10 days after the final tamoxifen injection. Heatmap showing 1740 upregulated (red) and 3241 downregulated (blue) genes on a log2 scale in Supt6-KO skin. The color key from blue to red indicates low to high expression levels. H Top enriched Gene Ontology (GO) terms for the 3241 downregulated genes according to Enrichr. I Top enriched GO terms for the 1740 upregulated genes according to Enrichr. J RT‒qPCR analysis of epidermal differentiation genes in control and Supt6-KO dorsal skin harvested 10 days after the final tamoxifen injection. The mean values are shown with error bars representing the SDs. Statistical significance is indicated as follows: **p < 0.01, ***p < 0.001, and ****p < 0.0001 (t-test). n ≥ 5 per group. All individual dots in the bar graphs represent data from an individual mouse
Transmission electron microscopy (TEM) revealed multiple ultrastructural abnormalities in the Supt6-KO epidermis, including increased epidermal thickness, loss of desmosomes and hemidesmosomes, accumulation of keratohyaline granules, basement membrane disruption, cytoplasmic vacuolation, and increased nucleoli (Fig. 2B and Supplementary Fig. 2A). Quantitative analysis confirmed these observations (Supplementary Fig. 2B), suggesting that epidermal hyperplasia, compromised cell adhesion, and altered differentiation occurred in the Supt6-KO mice. These findings indicate that the loss of SPT6 compromises epidermal structural integrity and barrier organization, contributing to the observed skin pathology.
Interestingly, when SPT6 deletion was induced before the second telogen in mice, no obvious external skin changes were observed (Supplementary Fig. 2C, D). However, H&E staining of dorsal and ear skin still revealed similar abnormalities, including epidermal thickening and stratum corneum defects, which is consistent with earlier time point findings (Supplementary Fig. 2E). These results suggest that SPT6 is essential for maintaining epidermal homeostasis throughout postnatal skin development.
Supt6-KO mice display enhanced epidermal differentiation
To evaluate how deletion of SPT6 affects epidermal differentiation, we analyzed the expression patterns and levels of several intermediate and terminal epidermal differentiation markers by immunofluorescence microscopy. The expression of Keratin 1 (KRT1) and Keratin 10 (KRT10) increased in the Supt6-KO epidermis on day 10 after the final tamoxifen injection (Fig. 2C, E). Although KRT1 expression gradually decreased over time, it remained elevated in the Supt6-KO group compared with the control group (Supplementary Fig. 3A, B). Similar increases in KRT1 and KRT10 expression were also observed in the ear and tail skin of Supt6-KO mice (Supplementary Fig. 3C–F). Additionally, we detected significant increases in Loricrin (LOR) expression in the dorsal, ear, tail, and tongue skin and increased Involucrin (IVL) and filaggrin (FLG) expression in the dorsal, ear, and tail skin of Supt6-KO mice on day 10 (Fig. 2D, F and Supplementary Fig. 3G–N). Consistently, a marked increase in epidermal thickness and elevated expression of KRT1 and LOR were also observed in the dorsal and ear skin of adult Supt6-KO mice (Supplementary Fig. 4A–D).
To gain deeper insights into the molecular alterations induced by SPT6 loss, we performed RNA sequencing (RNA-Seq) on lesional dorsal skin from Supt6-KO mice and matched dorsal skin from control mice, which were harvested on day 10 after the final tamoxifen injection. Differential gene expression analysis revealed 1740 upregulated genes and 3241 downregulated genes in Supt6-KO skin, with a cutoff of ≥ 2-fold change and a p value < 0.05 (Fig. 2G and Supplementary Table 1). Gene Ontology (GO) analysis revealed that the 3241 downregulated genes were significantly enriched for pathways related to cell adhesion, ECM organization, and the Wnt signaling pathway. In contrast, the 1740 upregulated genes were enriched in biological processes, including cell division, keratinocyte differentiation, and the inflammatory response, which is consistent with the pathological phenotypes observed in the Supt6-KO mice (Fig. 2H, I). We further validated the RNA-Seq results by confirming the significantly increased epidermal differentiation-associated mRNA expression of Krt1, Krt10, Ivl, Flg, Lor, Sprr2d, Sprr1b, Sprr2a1, and Lce3a in Supt6-KO skin compared with that in control skin (Fig. 2J).
Delayed wound healing in Supt6-KO mice is associated with suppressed Wnt signaling
Given the essential role of SPT6 in maintaining epidermal homeostasis and the close interplay among inflammation, wound healing, and epidermal function, we next investigated whether SPT6 deletion affects skin wound healing. To address this, we generated a full-thickness excisional wound (6 mm in diameter) on the dorsal skin of control and Supt6-KO mice on day 5 after the final injection of tamoxifen during the 2nd telogen phase of the hair cycle. Wound sizes were monitored and quantified on days 0, 2, 4, and 7 postwounding (Fig. 3A). As expected, compared with control mice, Supt6-KO mice exhibited a significantly delayed wound healing response at all measured time points (Fig. 3B, C). These results indicate that SPT6 is essential for efficient re-epithelialization and proper wound repair in the skin.

A Schematic diagram of tamoxifen-induced SPT6 deletion, wound creation, and wound size measurement time points in control and Supt6-KO mice. B Representative wound images of control and Supt6-KO mice at 0, 2, 4, and 7 days post-wounding. C Quantification of the wound area expressed as a percentage of the initial wound size on day 0, as measured by ImageJ (n = 4). D GSEA indicating downregulation of cell–cell signaling by Wnt in Supt6-KO skin. NES = 6.3, adjusted p value at 0.03. E Heatmap of the expression of 76 genes related to Wnt signaling in control and Supt6-KO skin on a log2 scale. F RT‒qPCR validation of the reduced expression of Wnt signaling-related genes in the dorsal skin of Supt6-KO mice 10 days after the final tamoxifen injection. G Venn diagram showing the overlap between SPT6-bound genes according to ChIP-Seq data (red circle) and Wnt signaling-associated genes downregulated upon Supt6-KO, as shown in Fig. 3E (blue circle). H Gene tracks of SPT6 ChIP-Seq (shown in blue) showing SPT6 binding at the transcription start site of FZD4 and WNT2B. The y-axis shows reads per million, and the blue bars over the gene track represent significant peaks. The mean values are shown with error bars representing the SDs. Each dot represents a single replicate or data from an individual mouse. Statistical significance is indicated as follows: **p < 0.01, ***p < 0.001, and ****p < 0.0001 (t-test). n ≥ 6 per group
Wnt signaling is well known as a critical regulator of the wound healing process [12]. Consistent with these findings, gene set enrichment analysis (GSEA) of the previously mentioned transcriptomic data revealed significant downregulation of Wnt signaling pathways in Supt6-KO skin (Fig. 3D). A total of 76 Wnt-related genes, including key positive regulators of Wnt signaling, such as Wnt ligands, receptors, and coreceptors for Wnt ligands, noncanonical Wnt signaling receptors, and transcriptional regulators involved in Wnt signaling, were found to be dysregulated upon SPT6 deletion (Fig. 3E). These findings were further validated by RT‒qPCR, which confirmed the significant downregulation of crucial Wnt signaling regulators, including Calcoco1, Csnk1d, Fzd4, Ctnnd1, Dkk2, and Wnt2b (Fig. 3F). Interestingly, our SPT6 ChIP-Seq data [13] generated from human keratinocytes demonstrated direct binding of SPT6 to 22 out of 76 regulatory genes associated with Wnt signaling, including FZD4 and WNT2B (Fig. 3G, H). These observations suggest that SPT6 may directly regulate the transcription of Wnt pathway genes through promoter occupancy in the epidermis and that loss of SPT6 disrupts Wnt signaling, impairing the wound healing response.
Transcriptome profiling of Supt6-KO skin reveals psoriasis-like inflammatory signatures
Among the top enriched GO terms, 65 key inflammatory genes, including Il17b, Il1b, Il6, Il18, and Tnf, which are proinflammatory cytokines known to contribute to psoriasis pathogenesis by promoting keratinocyte activation, neutrophil recruitment, and the Th17-mediated immune response, were identified (Fig. 4A) [14]. To further investigate these transcriptomic changes, we performed GSEA of the differentially expressed genes, which revealed significant enrichment of genes related to the inflammatory response and immune response pathways in the skin of the Supt6-KO mice (Fig. 4B and Supplementary Fig. 5A). We further validated the expression of several inflammatory mediators and found significant upregulation of the expression of Il1b, Ccl2, Ccl3, Ccl4, Cxcl2, Cxcl3, S100a8, S100a9, Tnf, and Il6 in Supt6-KO skin (Fig. 4C). To assess immune cell infiltration, we performed H&E and myeloperoxidase (MPO) staining in the epidermis of control and Supt6-KO mice. MPO, a myeloid marker that strongly labels neutrophils, strongly accumulated on the epidermal surface of the dorsal skin of the Supt6-KO mice on day 10 after the final injection of tamoxifen, resembling Munro’s microabscesses, a hallmark of psoriatic lesions (Fig. 4D). A similar phenotype was observed in the dorsal and ear skin of adult Supt6-KO mice (Supplementary Fig. 5B). We also performed immunostaining for the neutrophil marker Ly-6G in dorsal skin from control and Supt6-KO mice harvested on day 5. Ly-6G-positive neutrophils not only accumulated on the surface of the epidermis but also infiltrated the epidermal layer. Intriguingly, this was accompanied by a loss of KRT14 expression in the basal layer of the epidermis in the Supt6-KO samples (Fig. 4E). In line with these findings, the protein levels of IL-1β, CXCL2, and CCL3 were also significantly increased in Supt6-KO skin (Fig. 4F). Motif enrichment analysis of 110 inflammation-related genes revealed NF-κB-p65-Rel binding motifs (Fig. 4G), suggesting the potential involvement of the NF-κB pathway.

A Heatmap displaying the expression of 65 inflammatory genes in control and Supt6-KO skin on a log2 scale. The color key from blue to red indicates low to high expression levels. B GSEA showing upregulation of the inflammatory response in Supt6-KO skin. NES is 1.96, adjusted p value is 1.85E-09. C RT‒qPCR analysis of inflammatory gene expression in control and Supt6-KO skin harvested 10 days after the final tamoxifen injection. D H&E and MPO staining of dorsal skin from control and Supt6-KO mice harvested 10 days after the final tamoxifen injection. The yellow arrowhead indicates epidermal hyperplasia. The green arrowhead indicates Munro’s microabscesses. The black arrowhead indicates hyperkeratosis. The scale bar represents 100 μm for H&E staining and 200 μm for MPO staining. E Immunostaining of Ly-6G and KRT14 in control and Supt6-KO dorsal skin harvested on day 5. Yellow arrowheads indicate Ly-6G-positive staining. The scale bar represents 50 μm for immunostaining. F Enzyme-linked immunosorbent assay (ELISA) analysis of the inflammatory cytokines IL-1β, CXCL2, and CCL3 in control and Supt6-KO skin. Relative protein levels were calculated by dividing the amount of each detected cytokine by the total protein extracted from the tissue and then normalized to that of the control group. G De novo motif analysis of 110 upregulated genes associated with the inflammatory response in Supt6-KO skin. H Pearson correlation analysis between Supt6-KO RNA-Seq and two previously published RNA-Seq datasets (GSE226452 and GSE92967) from imiquimod (IMQ)-treated mouse skin. I H&E staining of dorsal skin harvested from control and Supt6-KO mice 24 h after 3 days of IMQ treatment. J H&E staining of ear (top panel) and dorsal skin (middle panel) harvested from control and Supt6-KO mice at 10 days after the final tamoxifen injection. Agar plate (bottom panel) shows bacterial colonies cultured from the feces of Supt6-KO mice that drank either regular water or antibiotic-containing water, confirming effective microbiota depletion in the antibiotic-treated group. The scale bar represents 200 μm for H&E staining. The mean values are shown with error bars representing the SDs. Each dot in the graph represents a single replicate or data from an individual mouse. Statistical significance is indicated as follows: *p < 0.05, **p < 0.01, and ****p < 0.0001 (t-test). n ≥ 4 per group. All individual dots in the bar graphs represent data from an individual mouse
Next, we compared the differential gene expression profiles of the Supt6-KO mice with those of two publicly available datasets of IMQ-treated mouse skin [15, 16]. IMQ is a well-established model for psoriasis [17, 18]. We observed a strong positive correlation between Supt6-KO lesional skin and IMQ-treated skin (r = 0.85 for GSE226452, p < 0.0001, and r = 0.81 for GSE92967, p < 0.0001) (Fig. 4H). Additionally, we detected a moderate positive correlation between the skin of Supt6-KO mice and the skin of psoriasis patients (r = 0.49 for GSE121212, p < 0.0001) (Supplementary Fig. 5C). Among the 1740 upregulated genes in Supt6-KO skin, 798 genes (~46%) overlapped with the 2516 upregulated genes on day 6 post-IMQ treatment (GSE92967) (Supplementary Fig. 5D). These overlapping genes were significantly enriched in the IL-17 signaling pathway, NOD-like receptor signaling, cytokine–cytokine receptor, and TNF signaling pathways, as shown by the results of the KEGG pathway analysis (Supplementary Fig. 5E). GO analysis revealed enrichment in biological processes such as keratinocyte differentiation, keratinization, the inflammatory response, and cell cycle regulation (Supplementary Fig. 5F). These findings highlight a partial and conserved inflammatory signature between Supt6-KO mice and psoriasis patients, particularly involving genes associated with the inflammatory response, suggesting that this model may be useful for examining inflammation-associated pathways relevant to psoriasis.
We further evaluated the sensitivity of SPT6-deficient skin to inflammatory stimuli by treating both control and Supt6-KO mice with IMQ (62.5 mg per day per mouse on a 2 cm × 2 cm dorsal skin) for 3 days. Strikingly, SPT6 deletion significantly exacerbated IMQ-induced psoriasis-like skin alterations, featuring elongated epidermal rete ridges, increased vascularization, abnormal stratum corneum stacking, and scale formation (Supplementary Fig. 5G and Fig. 4I). These findings indicate that the loss of SPT6 sensitizes the skin to IMQ-induced inflammation, further supporting its role in maintaining epidermal immune homeostasis.
To determine whether the skin inflammation observed in Supt6-KO mice is caused by secondary bacterial infection due to a compromised epidermal barrier, we administered a broad-spectrum antibiotic cocktail in 1% sucrose drinking water while simultaneously inducing SPT6 deletion for five consecutive days of tamoxifen injection. Dorsal and ear skin samples were collected on days 5 and 10 after the final injection of tamoxifen. Notably, compared with Supt6-KO mice given 1% sucrose regular water, Supt6-KO mice given antibiotic water developed a skin phenotype, with no apparent differences between the two groups, despite effective bacterial depletion (Fig. 4J). In parallel, periodic acid–Schiff (PAS) staining revealed no evidence of fungal structures in Supt6-KO skin (Supplementary Fig. 5H). qPCR analysis of fungal skin scrapings revealed minimal fungal DNA, with no significant differences between control and Supt6-KO mice (Supplementary Fig. 5I), and fungal culture on Sabouraud dextrose agar (SDA) and potato dextrose agar (PDA) yielded comparable colony numbers in both groups (Supplementary Fig. 5J). Viral qPCR screening for five common mouse skin viruses, namely, ECTV (ectromelia virus), MPV-1 (mouse parvovirus type 1), mouse papillomavirus (MusPV1/MmuPV1), murine cytomegalovirus (MCMV), and murine gammaherpesvirus 68 (MHV68), revealed only mouse papillomavirus (MusPV1/MmuPV1), with comparable Ct values between groups (Supplementary Fig. 5K). Moreover, to test whether the skin surface microbiota contributes to the phenotype, we performed microbiota transfer experiments by repeatedly swabbing the dorsal skin of control and Supt6-KO donors and transferring them to Supt6-KO recipients. Supt6-KO recipients receiving control or Supt6-KO microbiota developed indistinguishable skin phenotypes (Supplementary Fig. 5L). In addition, epidermal RNA-Seq revealed no enrichment of interferon-stimulated gene signatures or pathogen-associated transcriptional responses, suggesting that viral infection was not involved. Collectively, these results indicate that microbial infection is unlikely to be the primary driver of inflammation in Supt6-KO mice and support a predominantly cell-intrinsic inflammatory mechanism.
Single-cell RNA-Seq analysis revealed altered epidermal subpopulations and disrupted differentiation dynamics in Supt6-KO mice
To determine how SPT6 depletion in basal keratinocytes alters epidermal subpopulations and promotes inflammatory gene expression, we performed scRNA-Seq on the dorsal epidermis of control and Supt6-KO mice on day 5 after the final tamoxifen injection, which corresponds to early phenotype onset (Fig. 5A). After quality filtering, we retained 7632 cells from control mice and 10293 cells from Supt6-KO mice for downstream analyses.

A Schematic representation of the single-cell RNA sequencing (scRNA-Seq) workflow. A total of 7632 cells from control mice and 10293 cells from Supt6-KO mice were retained for downstream analyses. B t-Distributed Stochastic Neighbor Embedding (t-SNE) plot of eight keratinocyte subclusters, including three basal (Bas-1, -2, and -3), three intermediate (Interm-1, -2, and -3), one hair follicle subpopulation (HF), and one terminal differentiated (Diff) cell subpopulation. C Percentage distribution of keratinocyte subclusters in control (teal) and Supt6-KO mice (red). Monocle2 pseudotime trajectory analysis of epidermal keratinocyte subclusters. Cells are ordered along pseudotime from red to blue (D) and colored by genotype (E). F Subset trajectories of subcluster 5 (5-Bas-2) in control and Supt6-KO epidermis. G&H Pseudotemporal gene expression dynamics in control (G) and Supt6-KO (H) epidermis. A heatmap (left) displays the expression of genes along the pseudotime trajectory. Each row represents a gene, normalized to its peak value. The blue to red color gradient indicates low to high gene expression levels. Line plot (middle) shows the smoothed average expression trends of gene clusters over latent time. The number of genes per cluster is indicated in the lower left corner of each plot. The top GO terms (right) enriched in each cluster reflect the dominant biological processes associated with the dynamic expression patterns
Integrated analysis of control and Supt6-KO samples using Seurat revealed six major cell types based on canonical marker gene expression: keratinocyte_basal (Krt14, Col17a1, and Fcgbp), keratinocyte_suprabasal (Krt1, Flg, and Lor), dividing cells (Birc5 and Pclaf), hair follicle-associated cells (Krt17 and Krt79), melanocytes (Pax3 and Kit), and immune cells (Ptprc and Cd207) (Supplementary Fig. 6A, B). As expected, Supt6 expression was markedly reduced in Supt6-KO epidermis, particularly in basal, suprabasal, and dividing keratinocyte populations (Supplementary Fig. 6C), confirming efficient deletion in the major epidermal cell types. Cell type composition analysis revealed increased proportions of dividing cells and keratinocyte_suprabasal cells, with decreased numbers of hair follicle-associated, keratinocyte_basal, and immune cells in the Supt6-KO epidermis (Supplementary Fig. 6D). The reduced immune cell proportions on day 5 in the isolated epidermis precluded detailed analysis but indicated that the loss of SPT6 may initiate the keratinocyte-intrinsic inflammation that precedes immune cell recruitment.
Compared with those in the control epidermis, the G2/M score in the Supt6-KO epidermis was elevated overall (Supplementary Fig. 6E, F). Specifically, both basal and suprabasal keratinocytes exhibited increased G2/M scores (Supplementary Fig. 6G). Similarly, the proportion of cycling cells (in the G2/M + S phase) increased in both populations, and the expression of the proliferation marker Cdk4increased (Supplementary Fig. 6H, I), confirming the enhanced proliferative activity of the Supt6-KO keratinocytes.
To minimize the cofounding effects of cell cycle gene expression, the dividing cells were excluded from downstream analyses, as previously recommended [19]. Further subclustering of keratinocytes and hair follicle-associated cells revealed eight distinct populations: three basal (Bas-1, Bas-2, Bas-3), three intermediate (Interm-1, Interm-2, Interm-3), one hair follicle-associated (HF), and one differentiated (Diff) subcluster, each defined by distinct marker gene expression patterns (Fig. 5B and Supplementary Fig. 6J). Quantitative analysis revealed the most prominent increase in the proportions of subclusters 4 (Interm-3) and 5 (Bas-2) and a marked decrease in subcluster 6 (Bas-3) in the Supt6-KO epidermis (Fig. 5C). Consistently, the G2/M score was significantly elevated in subclusters 4 and 5 of the Supt6-KO epidermis (Supplementary Fig. 6K).
To characterize the dynamic changes in keratinocyte states, we performed pseudotime analysis using Monocle2. Basal keratinocytes expressing canonical progenitor markers (Itgb1 and Col17a1) were designated as the trajectory starting point, whereas terminally differentiated keratinocytes enriched for late differentiation markers (Lce1b and Lce1a1) were assigned as terminal states. Monocle2 reconstructed a continuous differentiation trajectory from basal progenitors to terminally differentiated keratinocytes, with branching at intermediate stages. Although control and Supt6-KO cells exhibited a similar global trajectory topology, the control epidermis showed a gradual and orderly progression transition along pseudotime. In contrast, compared with WT cells, Supt6-KO cells displayed a pronounced shift in pseudotime distribution across subclusters, particularly within Bas-2 and Interm-3 (Fig. 5D–F and Supplementary Fig. 7A, B), which is consistent with the enhanced and premature differentiation dynamics observed upon Supt6 depletion.
To validate the above findings, we performed complementary pseudotime inference approaches. Slingshot analysis independently confirmed a smooth lineage transition from undifferentiated progenitors to terminally differentiated keratinocytes in control cells, whereas the accumulation of Bas-2 and Interm-3 subclusters along the trajectory was similar in Supt6-KO cells, despite ultimately reaching terminal differentiated states (Supplementary Fig. 7C). In parallel, CytoTRACE analysis revealed significantly reduced differentiation potential across most Supt6-KO subclusters (except Bas-2), indicating decreased transcriptional plasticity and premature commitment toward differentiated fates (Supplementary Fig. 7D, E). Collectively, these complementary analyses demonstrate that SPT6 loss disrupts the coordinated progression of keratinocytes from basal through intermediate differentiation states, resulting in aberrant trajectory dynamics and altered epidermal homeostasis.
To identify key molecular changes during cell state transitions, we performed pseudotemporal dynamics analysis and identified approximately 300 pseudotime-dependent genes in each dataset that clustered into four expression patterns (Fig. 5G, H). Cells were ordered along pseudotime from start to endpoints using the same biological criteria as in the Monocle2 analysis above. Distinct gene expression patterns between the control and Supt6-KO epidermis were observed. The expression of cell proliferation-associated pathways, including Hippo signaling, decreased with increasing pseudotime in the control epidermis (Cluster 2), whereas in the Supt6-KO epidermis, these pathways exhibited a biphasic pattern, initially decreasing but then increasing (Cluster 1). Conversely, the expression of inflammation-associated pathways, including JAK-STAT and TNF signaling, progressively increased along pseudotime in the Supt6-KO epidermis, in contrast to the transient upregulation (increase then decrease) observed in the control epidermis. Similarly, cell differentiation-associated pathways showed sustained upregulation along pseudotime in the Supt6-KO epidermis (Cluster 4). These contrasting gene expression patterns along pseudotime suggest that SPT6 loss promotes a transcriptional program characterized by inflammation and aberrant differentiation dynamics.
To characterize the cell‒cell communication landscape between keratinocyte subpopulations, we performed ligand‒receptor interaction analysis using CellPhoneDB 2.0 [20], which predicts enriched interactions from scRNA‒Seq data using a curated repository of ligand‒receptor pairs. This analysis revealed a significant overall reduction in predicted cell‒cell interactions in the Supt6-KO epidermis. Notably, subcluster 5 (Bas-2) showed markedly reduced interactions with subclusters 2, 4, and 6 (Fig. 6A, B), which is consistent with the compromised cell adhesion structures observed by TEM analysis and the downregulation of cell adhesion genes revealed by bulk RNA-Seq analysis. Despite global cell‒cell communication reduction, specific pathways showed altered activity in Supt6-KO epidermis. Interactions between ephrin ligands (Efna1/3) and Eph receptors (Epha1/2/4) were upregulated, whereas App–Tnfrsf21 interactions were decreased, particularly in subclusters 4 (Interm-3) and 5 (Bas-2) (Supplementary Fig. 7F, G), suggesting the selective rewiring of intercellular communication networks.

CellPhoneDB analysis of keratinocyte subcluster interactions in control (A) and Supt6-KO (B) mouse epidermis. The heatmap displays the predicted strength of ligand–receptor–mediated communication between keratinocyte subclusters. The color intensity represents the interaction strength, with red indicating the strongest predicted interactions. Ranked regulon-specific score (RSS) from SCENIC analysis in keratinocyte subclusters 5 (5-Bas-2) (C) and 4 (4-Interm-3) (D). E SCENIC heatmap of transcription factor activity in keratinocyte subclusters 4 and 5. The color key from blue to red indicates low to high expression levels. The number in parentheses represents the number of genes in the regulon. F Regulon activity in control (teal) and Supt6-KO (red) epidermis across corresponding keratinocyte subclusters. Box plots showing the expression distributions of the Cebpd, Jund, Atf3, Lhx2, Rel, and Klf4 regulons. G GSEA of genes enriched in keratinocyte subcluster 5 (5-Bas-2). Dot plot summarizing the top activated and suppressed pathways enriched in 5-Bas-2, with the NES on the x-axis. Dot size indicates the number of genes enriched in each pathway, while color reflects statistical significance (adjusted p value), with red indicating greater significance. H GSEA of genes enriched in subcluster 4 (4-Interm-3). The dot plot displays the top activated and suppressed pathways enriched in 4-Interm-3, with the NES on the x-axis. Dot size indicates the number of genes enriched in each pathway, while color reflects statistical significance (adjusted p value), with red indicating greater significance. Statistical significance is indicated as follows: *p < 0.05, **p < 0.01, and ****p < 0.0001 (t-tests were performed for comparisons between two groups)
Finally, to identify transcriptional regulators underlying cell fate specification in keratinocyte subclusters 4 and 5, we performed single-cell regulatory network inference and clustering (SCENIC) to infer TF regulon activity on the basis of the coexpression of their downstream target genes [21]. SCENIC analysis revealed enrichment of core regulatory TFs, including Cebpd, Jund, Lhx2, Sox9, Cebpb, and Atf3, in subcluster 5 (Bas-2) and Rel, Nfkb1, Ehf, Grhl1, Rcor1, Klf3, Klf4, and Hif1a in subcluster 4 (Interm-3) (Fig. 6C–E). Among these genes, Lhx2 [22] and Sox9 [23] are involved in hair follicle and epidermal stem cell regulation. In addition, Cebpd [24], Klf4 [5], Klf3 [25], Grhl1 [26], Ehf [27], and Rcor1 [28] promote epidermal differentiation, supporting the phenotypic changes observed in Supt6-KO skin. Conversely, Rel [29], Hif1a [30], Cebpb [31], Jund [32], and Nfkb1 [33] are TFs associated with the inflammatory response in the skin, further aligning with the inflammatory gene expression signature detected by bulk RNA-Seq in SPT6-deficient skin.
Notably, the expression of multiple enriched regulons—including Cebpd, Jund, Atf3, Rel, Hif1a, and Klf4—together with their downstream target genes was upregulated in the Interm-3 and Bas-2 subclusters of the Supt6-KO epidermis compared with those in the control epidermis, whereas Lhx2 expression was reduced in Bas-2 in the Supt6-KO epidermis (Fig. 6F and Supplementary Fig. 7H). GSEA of the DEGs in these subclusters revealed activation of keratinocyte differentiation, epidermal cell differentiation, and keratinization pathways in the Supt6-KO epidermis. Additionally, immune response pathways were significantly activated in subcluster Bas-2 (Fig. 6G, H). These findings corroborated our bulk RNA-Seq results and demonstrated that SPT6 loss drives the selective expansion and transcriptional reprogramming of specific basal and spinous keratinocyte subpopulations characterized by enhanced differentiation and inflammatory signatures. Given the prominent upregulation of NF-κB–associated regulons and their target genes in these expanded subclusters, we sought to investigate the mechanistic link between SPT6 loss and NF-κB pathway activation.
SPT6 suppresses inflammatory signaling in keratinocytes via the NF-κB pathway
To elucidate the molecular mechanism by which SPT6 suppresses inflammation in keratinocytes, we performed siRNA-mediated knockdown of SPT6 (SPT6i) in proliferating keratinocytes, followed by polyinosinic-polycytidylic acid (poly(I: C)) stimulation and transcriptomic profiling via RNA-Seq. Poly(I: C) is a synthetic analog of double-stranded RNA (dsRNA) and has been widely used to model inflammation caused by tissue damage and viral infection [10, 34]. Compared with control siRNA-treated cells, SPT6i cells treated with poly(I: C) presented 2239 upregulated genes and 2261 downregulated genes (Fig. 7A and Supplementary Table 2). KEGG pathway analysis of the upregulated genes revealed significant enrichment of inflammation-related signaling pathways, including cytokine‒cytokine receptor interactions, TNFα signaling, and the NF-κB signaling pathway (Fig. 7B). GSEA further confirmed the activation of TNFα signaling via NF-κB and the inflammatory response in SPT6-depleted cells upon poly(I: C) stimulation (Fig. 7C and Supplementary Fig. 8A). We validated these findings by RT‒qPCR and confirmed robust increases in the expression of key inflammatory genes, such as IL19, CCL3, CCL4, CXCL2, CXCL3, TNF, IL6, and CXCL8, in SPT6i cells treated with poly(I: C) (Fig. 7D). These results suggest that SPT6 plays a critical role in repressing inflammatory gene expression and maintaining immune homeostasis in human keratinocytes under stress conditions.

A Proliferating primary human keratinocytes were transfected with scrambled control (Control) or SPT6 (SPT6i) siRNAs (n = 2) for 3 days, followed by 4 h of treatment with high-molecular-weight poly(I: C) before being harvested for RNA-Seq. A volcano plot displays the significantly differentially expressed genes when the cutoff was a ≥ 2-fold change and a p value ≤ 0.05. B KEGG analysis of 2239 upregulated genes in SPT6i- and poly(I: C)-treated keratinocytes. The dot plot displays the top enriched pathways, with the enrichment ratio on the x-axis. Dot size indicates the number of genes enriched in each pathway, while color reflects statistical significance (adjusted p value), with red indicating greater significance. C GSEA indicating the upregulation of hallmark gene signatures associated with TNF α signaling via NF-κB in SPT6i cells. NES at 2.13, adjusted p value at 0.0. D RT‒qPCR of the inflammatory genes IL19, CCL3, CCL4, CXCL2, CXCL3, TNF, IL6, and CXCL8 in control and SPT6i cells after poly(I: C) treatment. E De novo motif analysis of 436 upregulated genes associated with the inflammatory response upon SPT6i + poly(I: C) treatment. F Immunostaining of p65 in control cells treated with poly(I: C) or SPT6i cells treated with poly(I: C) alone or in combination with QNZ. The scale bar represents 50 μm for immunostaining. G RT‒qPCR analysis of inflammatory gene expression in control cells treated with poly(I: C) and in SPT6i cells treated with poly(I: C) alone or in combination with QNZ. “A” comparison between Control+Poly(I: C) and SPT6i+Poly(I: C). “B” and “b” comparison between SPT6i+Poly(I: C) and SPT6i+Poly(I: C) + QNZ. “C” comparison between Control+Poly(I: C) and SPT6i+Poly(I: C) + QNZ. Capitalized “ABC” indicates p < 0.01, and lowercase “b” indicates p < 0.05. H H&E staining of dorsal skin harvested from Supt6-KO mice 7 days after tamoxifen induction, with or without QNZ treatment. The scale bar represents 200 μm for H&E staining. I Immunostaining of Ly-6G and KRT14 in dorsal skin harvested from Supt6-KO mice 7 days after the final tamoxifen injection, with or without QNZ treatment. The scale bar represents 50 μm for immunostaining. The mean values are shown with error bars representing the SDs. Each dot in the graph represents a single replicate or data from an individual sample. Statistical significance is indicated as follows: *p < 0.05, **p < 0.01, ***p < 0.001, ****p < 0.0001 (one-way ANOVA followed by Tukey’s multiple comparison for 3 groups, and a t-test was performed for comparisons between two groups). n ≥ 4 per group
To identify transcriptional regulators influenced by SPT6 in the context of inflammatory activation, we first performed de novo motif enrichment analysis on the promoters of 436 inflammation-associated upregulated genes from the SPT6i+Poly(I: C) RNA-Seq dataset. This analysis revealed a significant overrepresentation of NF-κB-p65-Rel binding motifs (Fig. 7E).
To determine whether SPT6 suppresses inflammation through inhibition of the NF-κB signaling pathway, we treated SPT6i cells with 5 μM QNZ, a potent and selective NF-κB inhibitor [35, 36]. Compared with control+poly(I: C) cells, SPT6i+poly(I: C) cells displayed increased nuclear localization of p65, which was markedly reduced upon QNZ treatment (Fig. 7F and Supplementary Fig. 8B). The expression of the inflammatory genes shown in Fig. 7D was also partially rescued by QNZ treatment in SPT6i+Poly(I: C) cells (Fig. 7G). To further confirm that NF-κB signaling was activated in vivo, we administered QNZ to Supt6-KO mice for 3 days prior to Cre induction. QNZ treatment alleviated skin inflammation, as evidenced by decreased formation of Munro’s microabscesses and reduced Ly-6G immunostaining in Supt6-KO mice on day 7 after the last tamoxifen injection (Fig. 7H, I).
SPT6 binds to RELA at its enhancer region and inhibits its positive feedback loop at the transcriptional level
Intersection analysis between genes upregulated upon SPT6i and poly(I: C) stimulation and those directly bound by SPT6 revealed 721 overlapping genes (Supplementary Fig. 8C). These genes were significantly enriched for GO terms related to the establishment of the skin barrier, skin epidermis development, and positive regulation of the inflammatory response (Supplementary Fig. 8D). KEGG pathway analysis further revealed enrichment of TNFα signaling via NF-κB, the UV response, and IL-2/STAT5 signaling (Supplementary Fig. 8E).
To determine whether p65 expression is elevated in SPT6i cells, we measured changes in overall p65 levels following SPT6 knockdown. This upregulation was validated using RT‒qPCR and western blot analysis (Fig. 8A–C). Next, we investigated whether SPT6 regulates RELA (which encodes the p65 protein) transcriptionally by comparing our previously generated SPT6 ChIP-Seq data with publicly available p65 ChIP-Seq data from KB cells, an epithelial cell line [13, 37]. Notably, we detected significant overlap between the binding peaks of SPT6 and p65 at an enhancer region downstream of the RELA transcription termination site. This region is marked by H3K27ac and H3K4me1 histone modifications, which are characteristic of active enhancers, as identified in proliferative keratinocytes (ENCODE database). Additionally, motif analysis using JASPAR revealed strong enrichment of the p65 motif within this enhancer region, with a relative score of 0.800986 (Fig. 8D).

A RELA mRNA expression in control and SPT6i cells treated with poly(I: C) was measured by RT‒qPCR. B, C Western blot analysis and quantification of SPT6, p-p65, and p65 expression in control and SPT6i cells treated with poly(I: C). D Gene track of the RELA gene. The SPT6 ChIP-Seq signal and peaks are shown in dark blue. H3K27ac ChIP-Seq signals and peaks are shown in red. H3K4me1 ChIP-Seq signals and peaks are shown in green. The p65 ChIP-Seq signal and peaks are shown in gray. The y-axis shows the number of reads per million, and the colored bars above the signal tracks denote peak calls. The p65 binding motif predicted by JASPAR (motif ID: MA0107.1; relative score: 0.800986) is displayed at the bottom of the track. E ChIP‒qPCR of p65 binding at the RELA enhancer and promoter region in control and SPT6i cells treated with poly(I: C). F Schematic diagram of the proposed mechanism. The mean values are shown with error bars representing the SDs. Each dot in the graph represents a single replicate or data from an individual sample. Statistical significance is indicated as follows: *p < 0.05, **p < 0.01, ***p < 0.001, and ****p < 0.0001 (one-way ANOVA followed by Tukey’s multiple comparison for 3 groups, and a t-test was performed for comparisons between two groups). n ≥ 3 per group
On the basis of these findings, we hypothesized that SPT6 regulates p65 binding at this enhancer region to prevent the formation of a positive transcriptional feedback loop. To test this hypothesis, we performed ChIP‒qPCR using a p65 antibody in both control and SPT6i cells treated with poly(I: C). Our results revealed a significant increase in p65 binding at both the promoter and enhancer regions in SPT6-depleted cells (Fig. 8E). Together, these findings support a model in which SPT6 constrains NF-κB-driven transcriptional programs, thereby limiting the magnitude of the inflammatory response in basal keratinocytes (Fig. 8F).