
SPF and GF Lgr5-GFP mice
We used a knock-in Lgr5EGFP−IRES−CreERT2 mouse model (Lgr5-GFP) in which green fluorescent protein (GFP) expression is driven by endogenous Lgr5 regulatory sequences11. Lgr5-GFP mice were backcrossed to the C57BL/6J strain for more than 20 generations to ensure a genetically identical background. Conventional Lgr5-GFP mice were maintained under SPF conditions in the Texas Children’s Hospital animal facility. To establish a GF Lgr5-GFP mouse colony, SPF breeders were used to generate litters that were delivered by caesarean section into a GF isolator and fostered by GF BALB/c mothers. Faecal samples were analysed weekly for 6 months using 16S sequencing to verify GF status, and monthly thereafter. The GF colony was maintained in the Gnotobiotic Mouse Facility at Baylor College of Medicine. Mice were kept on a 12-h light/dark cycle at 20–22 °C with 30–70% humidity. All mice were fed an identical autoclaved chow diet (LabDiet 5V0F) to minimize dietary confounding. Both male and female mice were age and sex matched for all experiments. All animal procedures were conducted in accordance with the NIH Guide for the Care and Use of Laboratory Animals and were approved by the Baylor College of Medicine Institutional Animal Care and Use Committee (protocol no. AN-6775).
Gut microbiota transfer
GF Lgr5-GFP mice were conventionalized by GMT at 3, 8 or 12 weeks of age. Luminal contents were collected from the colons of 2 age-matched SPF donor mice, suspended in 1 ml sterile phosphate-buffered saline (PBS) and centrifuged at low speed to remove insoluble materials. GF recipient mice were inoculated orally with 200 µl of freshly prepared microbiota suspension. Following inoculation, mice were transferred to the SPF facility and maintained under standard housing conditions. Colonic epithelial cells were collected at indicated time points for DNA methylation and expression analyses.
Low-dose penicillin treatment
Maternal and early-life antibiotic exposure was performed using a subtherapeutic penicillin regimen56,57. Pregnant Lgr5-GFP mice received either regular drinking water or water containing penicillin G sodium salt (Sigma-Aldrich, P3032) at 6.67 mg l−1, corresponding to ~1 mg kg−1 body weight. Water was replaced weekly. Treatment continued throughout gestation and lactation to ensure pup exposure via maternal milk. After weaning, offspring remained on the same treatment until 8 weeks of age.
Dextran sulfate sodium-induced colitis
To assess susceptibility to colitis, SPF Lgr5-GFP mice were treated with LDP until 8 weeks of age, followed by a 1-week antibiotic washout. Age-matched untreated mice served as controls. All mice received either 1 cycle or 3 cycles of 2.5% (w/v) DSS (molecular weight 36,000–50,000, MP Biomedicals, 9011-18-1) in drinking water as previously described5. Each cycle consisted of 5 days of DSS treatment followed by 5 days of recovery with regular water. Water consumption was recorded daily per cage, and bottles were replaced every 2 days. Because no sex-based differences were observed (Supplementary Fig. 1), data from both sexes were pooled for analysis.
Azoxymethane–DSS-induced colitis-associated tumorigenesis
To induce colitis-associated colorectal cancer, 9-week-old mice were given a single intraperitoneal (i.p.) injection of AOM (10 mg kg−1; Sigma-Aldrich, A5486) followed by 3 cycles of 2.5% DSS as described above. Age-matched mice without LDP pretreatment served as controls. At 19 weeks of age, mice were euthanized, and tumour number and size were recorded. Colon tissues were collected for histological examination.
Assessment of DSS-induced disease activity
During DSS treatment, disease progression was monitored daily by measuring body weight, stool consistency and rectal bleeding. Occult blood was detected using Hemoccult Faecal Occult Blood Slides (Beckman-Coulter, SK-61130). Colitis severity was scored according to established criteria58,59: weight loss (0 = none; 1 = 1%–5%; 2 = 5%–10%; 3 = 10%–20%; 4 = >20%); stool consistency (0 = normal; 1 = soft; 2 = loose; 3 = semi-liquid; 4 = diarrhoea); and bleeding (0 = normal; 1 = Haemoccult positive; 2 = Haemoccult positive and visual bleeding; 3 = gross bleeding). The disease activity index (DAI) was calculated as the sum of these three parameters. A subset of mice were euthanized at 7 days after inital DSS treatment, and colon length and histopathology were evaluated.
Neutralization of IFNγ in mice
To block IFNγ signalling, mice received i.p. injections of Ultra-LEAF purified anti-mouse IFNγ antibody (clone XMG1.2, BioLegend, 505847) at 10 mg kg−1 body weight. The antibody was administered immediately after weaning or in adulthood. Control mice received Ultra-LEAF purified Rat IgG1 κ isotype control antibody (clone RTK2071, BioLegend, 400457) at the same dose. A total of 4 injections were given to ensure sustained cytokine blockade. Colonic epithelial cells were collected 5 weeks after the first injection for downstream analyses.
Organoid culture and treatment
Organoids were established from mouse colons60,61. Briefly, colons were dissected and incubated in ethylenediaminetetraacetic acid (EDTA) to dissociate epithelial crypts. The crypts were washed 4 times with cold washing buffer (comprising Ham’s F-12 Nutrient Mix, 5% fetal bovine serum (FBS), 15 mM HEPES, 2.5 µM Rock-inhibitor Y-27632, 2 mM L-glutamine, 1% penicillin/streptomycin, 0.25 µg ml−1 amphotericin B, 50 µg ml−1 gentamicin and 100 μg ml−1 Primocin) and filtered through a 70 µm strainer. The resulting cell suspension was embedded in Matrigel Matrix (Corning, 356231) and plated into pre-warmed 24-well plates. Cultures were maintained in WRNE medium containing Wnt3A, R-spondin 3 and Noggin. Medium was replaced every 3 days and organoids were passaged every 5–7 days.
For IFNγ treatment, GF-derived organoids were incubated with recombinant mouse IFNγ (R&D Systems, 485-MI-100) at 0.1 ng ml−1 for 0, 24, 48, 72 or 96 h before collection. For single-agent treatment, organoids were treated for 48 h with 0.1 ng ml−1 IFNγ, 5 ng ml−1 TNF (R&D Systems, 410-MT-010), 2.5 μg ml−1 LPS (Thermo Fisher, 00-4976-03), 2 mM sodium butyrate (Sigma-Aldrich, 303410) or 0.08 μM DAC (Sigma-Aldrich, A3656). For combination treatments, organoids were pretreated with 0.08 μM DAC followed by 0.1 ng ml−1 IFNγ for 48 h.
To assess trained memory responses, naïve and IFNγ-primed organoids were initially treated with vehicle or 0.1 ng ml−1 IFNγ across 3 consecutive passages. Organoids were then washed and cultured in IFNγ-free medium for 7 days before restimulation with 0.1 ng ml−1 IFNγ or 5 ng ml−1 TNF. Organoids were collected at 0, 3, 6, 12, 24, 36 and 48 h post restimulation. Early-passage organoids were derived from 15-week-old SPF, GF and GMT mice and maintained in IFNγ-free medium for 20 days, then treated with 0.1 ng ml−1 IFNγ and collected at the same time points for downstream analyses.
Histology and immunohistochemistry (IHC)
Small intestines and colons were fixed in 4% paraformaldehyde, paraffin embedded, sectioned and stained with haematoxylin and eosin (H&E) following standard protocols at the Cellular and Molecular Morphology Core, Texas Medical Center Digestive Diseases Center. IHC was performed as described previously62 using primary antibodies against Ki-67 (Thermo Fisher, MA5-14520, 1:100) and CD3 (Abcam, ab16669, 1:100). Alcian blue (AB) (pH 2.5) staining (Vector Labs, H-3501) was conducted following manufacturer instructions. Crypt length, the average number of Ki-67+ cells and the average number of AB+ cells per crypt–villus unit were quantified microscopically at ×20 magnification from at least 20 randomly selected crypts per sample.
Isolation of Lgr5+ ISCs and EpCAM+ IECs
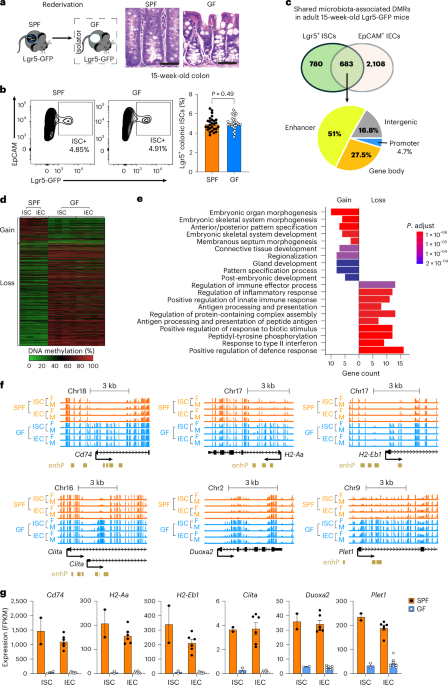
Colonic crypts were isolated as described above for organoid culture. Crypt-derived epithelial cells were dissociated into a single-cell suspension using TrypLE Express Enzyme (Thermo Fisher, 12605010) and filtered through a 40 µm strainer. Cells were stained with PE-conjugated anti-mouse CD326 (EpCAM) (Biolegend, clone G8.8, 118206, 1:200) and, when indicated, APC-conjugated anti-mouse CD24 (Biolegend, clone 30-F1, 138505, 1:100) for fluorescence-activated cell sorting. ISCs (EpCAM+/GFP+) and IECs (EpCAM+/GFP− or EpCAM+/GFP−/CD24+) were sorted using a BD Aria Fusion cell sorter (BD Biosciences). Wild-type (WT) mice lacking the Lgr5-GFP knock-in served as negative controls (see gating strategy, Supplementary Fig. 2a).
Colonic intraepithelial lymphocyte isolation
Colonic IELs were isolated following a modified protocol63,64. Briefly, colons were dissected, flushed with cold calcium/magnesium-free Hanks’ balanced salt solution (HBSS) containing 2% FBS, cut longitudinally and minced into small pieces. Tissue fragments were incubated in EDTA-dithiothreitol (DTT) buffer (HBSS, 2% FBS, 1 mM EDTA and 1 mM DTT) for 30 min at 37 °C with gentle shaking. Crypts were mechanically released by pipetting and filtered through a 70 µm strainer. IELs were enriched using 40%/80% discontinuous Percoll (Sigma-Aldrich, GE17-0891-02) gradient centrifugation.
Flow cytometry analysis
Colon epithelial cells were strained for viability using the Zombie Aqua Fixable Viability kit (BioLegend, 423101, 1:200) and blocked with anti-mouse CD16/CD32 (BioLegend, clone S17011E, 156603, 1:100). Surface staining was performed using fluorophore-conjugated antibodies against PE/Cyanine7 anti-mouse CD326 (EpCAM) (BioLegend, clone G8.8, 118215, 1:200), Brilliant Violet 650 anti-mouse I-A/I-E (MHC-II) (BioLegend, clone M5/114.15.2, 107641, 1:100) and PE/Dazzle 594 anti-mouse CD45 (BioLegend, clone 30-F11, 103145, 1:100) to exclude haematopoietic cells. MHC-II expression was quantified in live CD45−EpCAM+ epithelial cells (Supplementary Fig. 2b).
For intracellular IFNγ staining in IELs, isolated IELs were stimulated with Cell Activation Cocktail containing Brefeldin A (BioLegend, 423303). Cells were stained for viability and surface markers including CD45 (PE/Dazzle 594, BioLegend, clone 30-F11, 103145, 1:100), TCRβ (BUV395, BD, clone H57-597, 569248, 1:100), CD3 (PerCP/Cy5.5, BioLegend, clone 17A2, 100217, 1:50), CD4 (APC/Cy7, BioLegend, clone RM4-5, 100525, 1:50), CD8a (Alexa Fluor 700, BioLegend, clone 53-6.7, 100729, 1:200), EpCAM/CD326 (PE/Cy7, BioLegend, clone G8.8, 118215, 1:200), CD19 (Brilliant Violet 785, BioLegend, clone 6D5, 115543, 1:100) and CD11b (Brilliant Violet 421, BioLegend, clone M1/70, 101235, 1:50). Cells were then fixed, permeabilized and stained for PE anti-mouse IFNγ (BioLegend, clone XMG1.2, 505807, 1:50). Samples were acquired on a BD Symphony A5 flow cytometer and data were processed using FlowJo software (Supplementary Fig. 2c).
Whole-genome bisulfite sequencing analysis
WGBS was performed as previously described14,61 using sorted Lgr5+ ISCs (EpCAM+/GFP+) and EpCAM+/GFP− IECs from the colons of SPF and GF Lgr5-GFP mice at weaning (3 weeks old) and in adulthood (15 weeks old). To obtain sufficient material for stem cell samples, we pooled cells from multiple animals of the same sex. Genomic DNA (500 ng) was treated with sodium bisulfite using the EZ DNA Methylation-Direct kit (Zymo Research, D5021). The bisulfite-modified DNA was amplified using adaptor-specific primers, and fragments of 200–500 bp were isolated. The quantity and size of the libraries were measured with PicoGreen and the Agilent 2100 Bioanalyzer. Each library was sequenced using 150 bp paired-end reads, resulting in an average sequencing depth of ~30× for both female and male mice in each group and in the replicates (Supplementary Table 3). The reads were mapped to the mouse genome (mm10) using BSMAP. The average methylation ratio for each CpG site was calculated as the number of unconverted CpGs divided by the total reads covering that site.
The gene annotation and genomic positions of CpG islands (CGIs) and transposable elements (LINE, SINE and LTR) in mouse (mm10/GRCm38) were fetched using the Table Browser tool in the UCSC Genome Browser (http://genome.ucsc.edu). Gene promoter regions were defined as 1 kb upstream of transcription start sites (TSS). Gene body regions were defined as the region from the TSS to the transcription termination site (TTS). The methylation levels of these genomic features (promoters, gene bodies, CGIs, transposons) were calculated using the ‘avgmod’ module in BASALkit65 (https://www.github.com/JiejunShi/BASAL).
The mouse enhancers were defined on the basis of the annotations of ENCODE candidate cis-regulatory elements (cCREs)17 and downloaded from the UCSC Genome Browser website (https://hgdownload.soe.ucsc.edu/gbdb/mm10/encode3/ccre/encodeCcreCombined.bb). There are five cCRE classes: promoter-like signature (PLS), proximal enhancer-like signature (pELS), distal enhancer-like signature (dELS), DNase-H3K4me3 and CTCF-only. The promoter-proximal enhancers (enhP) in this study refer to pELS in cCREs.
DMRs were analysed using Metilene (v.0.2-862)66 in ‘de novo’ mode with the option ‘-m 5’ to identify regions containing at least five CpGs. A mean methylation difference cut-off of 0.15 was applied for both hypermethylated and hypomethylated DMRs. DMR-associated genes were defined as those with promoters or gene bodies overlapping a DMR. Shared DMRs were defined as regions exhibiting more than 50% reciprocal overlap, reflecting concordant microbiome-mediated epigenetic changes in ISCs and IECs.
RNA-seq analysis
RNA-seq was performed as previously described14 using 200 ng RNA extracted from colonic ISCs and IECs. Before sequencing, RNA quality was assessed using an Agilent 2100 Bioanalyzer with the Agilent RNA 6000 Nano kit. Library preparation and RNA-seq were performed by Novogene. BOWTIE2 software67 was used for efficient realignment of RNA sequences, and gene expression levels for each sample were calculated with RSEM68. For differentially expressed gene analysis, we used DEseq2 (ref. 69) to rank genes by log2 fold change (>1.5) and adjusted the P values on the basis of multiple testing corrections (Bonferroni).
Metagenomic whole-genome sequencing analysis
Luminal microbial samples were collected from the intestinal tract. For GMT groups, caecal contents were used, while faecal samples from the colon were collected for LDP groups. Microbial DNA was extracted using the QIAamp PowerFecal Pro DNA kit (Qiagen, 51804) and quantified with a Qubit Fluorometer. Library preparation and metagenomic sequencing were performed by Novogene. Genomic DNA (200 ng) was fragmented (~350 bp), end repaired, adapter ligated, PCR amplified and quality assessed. Libraries with effective concentration >3 nM were sequenced on an Illumina NovaSeq X Plus platform using 150 bp paired-end reads with ≥20 million reads (~6 Gb data) per sample.
Raw reads were trimmed and quality filtered using fastp (v.0.23.1), and host-derived sequences were removed by aligning to the mouse genome with Bowtie2 (v.2.5.4). Taxonomic classification across bacteria, archaea, fungi and viruses was performed with Kraken2 (v.2.1.3) and refined using Bracken (v.2.9). Functional annotation was carried out using DIAMOND (v.2.1.9) against the UniProt database and mapped to Gene Ontology databases. Alpha and beta diversity were calculated using the vegan and ade4 R packages. Differential abundance analysis at species and functional levels was conducted using metagenomeSeq, with significance determined by permutation tests and Benjamini–Hochberg FDR correction (FDR < 0.05).
Quantitative DNA methylation analysis
Quantitative bisulfite pyrosequencing was used to assess DNA methylation, following protocols established in previous studies70,71. For clonal bisulfite sequencing, post-bisulfite PCR products were cloned into the TA vector pCR4-TOPO (Invitrogen, K457501). Plasmid DNA was extracted from 15–20 clones using a QIAprep Spin Miniprep kit (QIAGEN, 27106) and sequenced at the Sequencing Core Facility at Baylor College of Medicine. Primer sequences and sequencing assays are provided in Supplementary Table 4.
Quantitative gene expression analysis
Gene expression was measured by quantitative PCR with reverse transcription (RT–qPCR) using TaqMan assays from Thermo Fisher. The mouse genes analysed were Dnmt1 (Mm01151063_m1), Dnmt3a (Mm00432881_m1), Dnmt3b (Mm01240113_m1), Dnmt3l (Mm00457628_g1), Tet1 (Mm01169087_m1), Tet2 (Mm00524395_m1), Tet3 (Mm00805756_m1), Cd74 (Mm01262763_m1), H2-Aa (Mm00439211_m1), H2-Eb1 (Mm00439221_m1), Ciita (Mm00482914_m1), Duoxa2 (Mm00470560_m1) and Plet1 (Mm01170995_m1). Target gene expression was normalized to Actb (Mm00607939_s1) expression using an ABI Step OnePlus Detection System.
Quantification of intestinal bacterial populations by real-time PCR
Bacterial genomic DNA was extracted from faecal samples collected from mice with and without LDP treatment at 4 weeks of age, using the QIAamp Fast DNA Stool mini kit (QIAGEN, 51604) following manufacturer instructions. Quantitative PCR was performed using the ABI Step OnePlus Detection System with PowerUp SYBR Green Master Mix (Applied Biosystems, A25776). The following primer sets were used as described previously72,73,74,75,76: universal bacteria primers (5′-CGGCAACGAGCGCAACCC-3′ and 5′-CCATTGTAGCACGTGTGTAGCC-3′), segmented filamentous bacteria (SFB) primers (5′-GACGCTGAGGCATGAGAGCAT-3′ and 5′-GACGGCACGGATTGTTATTCA-3′), Bacteroides–Prevotella primers (5′-GAAGGTCCCCCACATTG-3′ and 5′-CAATCGGAGTTCTTCGTG-3′), Clostridium cluster XIVab primers (5′-GAWGAAGTATYTCGGTATGT-3′ and 5′-CTACGCWCCCTTTACAC-3′) and Lactobacillus primers (5′-AGCAGTAGGGAATCTTCCA-3′ and 5′-ATTYCACCGCTACACATG-3′). Relative abundances of individual bacterial species were normalized on the basis of the total bacterial load.
CpGfree-enhancer Lucia reporter assay
To measure the effect of DNA methylation in enhancer elements, we used the reporter plasmid pCpGfree-promoter-Lucia vector (InvivoGen, pcpgf-promlc) and a firefly luciferase pGL3 promoter (CMV) vector77. Putative enhancer regions were amplified from mouse genomic DNA and cloned into the pCpGfree-promoter-Lucia vector, which had been digested with ApaI/BamHI for Cd74, H2-Aa, Ciita, Duoxa2 and Plet1, or with ScaI/BamHI for H2-Eb1. All primer sequences used for generating plasmids for the Lucia reporter assays are listed in Supplementary Table 5. Plasmids were methylated using the CpG methyltransferase M.SssI (New England Biolabs, M0226L) according to manufacturer instructions. Plasmid DNA (10 μg) was incubated overnight at 37 °C with 160 μM S-adenosylmethionine (SAM) and 20 U of M.SssI. An additional 160 μM SAM and 20 U M.SssI were then added, followed by a 6-h incubation. Unmethylated plasmids were prepared similarly but without M.SssI.
The purified plasmids were quantified and co-transfected transiently into HEK-293T cells along with a firefly luciferase plasmid using Lipofectamine 3000 Transfection Reagent (Invitrogen, L3000008) following manufacturer protocol. After 24 h, cells were lysed, and Lucia and firefly luciferase activities were measured in a GloMax Discover plate reader (Promega) using the Dual-Luciferase Reporter Assay System (Promega, E1910). Lucia activity was normalized to firefly activity.
Statistical analysis
All statistical analyses were performed using GraphPad Prism v.9 (RRID:SCR_002798). Quantitative DNA methylation and expression results are expressed as mean ± s.e.m. Significance was determined using Student’s t-test with a two-tailed distribution or two-way ANOVA, and P < 0.05 was considered statistically significant.
Reporting summary
Further information on research design is available in the Nature Portfolio Reporting Summary linked to this article.