
Data acquisition
Clinical and patient data from BC were downloaded from The Cancer Genome Atlas (TCGA). The TCGA-BRCA dataset included 1207 BC samples and 113 normal tissues (https://portal.gdc.cancer.gov/). The associated clinical markers included pathologic stage, TNM stage, patient age, and gender. The gene expression data used in this study were specifically sourced from the Breast Invasive Carcinoma (BRCA) project within the TCGA database, accessed and downloaded in December 2023.
Survival analysis and diagnostic assessment
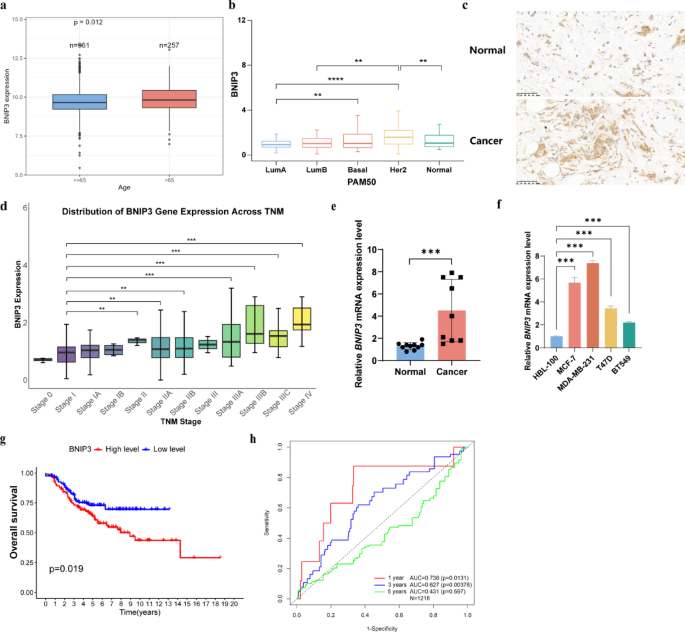
Utilizing data from TCGA, patients with BC were categorized into high and low BNIP3 expression groups based on the median BNIP3 expression level. The relationship between BNIP3 expression and survival outcomes in BC was assessed using Kaplan–Meier survival curves and log-rank tests. The Kaplan‐Meier (KM) plot for survival curve analysis was performed using TCGA datasets from GEPIA30. Receiver Operating Characteristic (ROC) curves were generated using the “pROC” and “timeROC” R packages. A Cox proportional hazards regression analysis was conducted, incorporating variables such as TNM stage, patient age, gender, and BNIP3 expression levels. All analyses were performed in R, with the package pROC used to generate ROC curves and calculate AUC values. ROC curves plot sensitivity versus 1 − specificity across probability thresholds ranging from 0.0 to 1.0. The AUC represents the area under the ROC curve, where a value of 1.0 indicates perfect prognostic accuracy of BNIP3, and a value of 0.5 indicates performance no better than random. Kaplan–Meier survival curves were generated for each group, and P-values for the log-rank test are indicated.
Enrichment analysis
The package “ClusterProfiler”31 was used for gene ontology (GO) enrichment and the Kyoto Encyclopedia of Genes and Genomes (KEGG) pathway analysis32 of BNIP3-related genes. We used GSEA software33 and analyzed the differences in signaling pathways between the high BNIP3 and low BNIP3 groups in BC. P < 0.05 was considered significant.
Analysis of immune cell infiltration
The estimation of stromal and immune cell infiltration in malignant tumor tissues was performed using the STromal and Immune cells Estimation (ESTIMATE)34. Wilcoxon’s test was utilized to compare differences between BNIP3 expression levels and tumor microenvironment (TME) groups. The Cell-type Identification By Estimating Relative Subsets Of RNA Transcripts (CIBERSORT)35 R script quantified the relative proportions of infiltrating immune cells. We subsequently plotted box plots for 22 immune cell types and created correlation lollipop plots using the Spearman method.
Tumor mutation profiles and drug sensitivity screening
The TCGA-BRCA Somatic mutation datawere collected from the UCSC Xena (https://gdc.xenahubs.net), and the expression information of BNIP3 was extracted, and the samples were divided into high-expression and low-expression groups according to the median value. The R package maftools was used to determine the significantly mutated genes and build a somatic mutation landscape between the low- and high-risk groups. The Tumor mutation burden (TMB) was calculated using “maftools”.
We first downloaded the IC50 values for a number of drugs from Genomics of Drug Sensitivity in Cancer (GDSC; https://www.cancerrxgene.org/)36. The R package “pRRophetic” was utilized to predict the drug IC50 in the different BNIP3 risk groups. This algorithm can calculate the IC50 of chemotherapeutic drugs according to the gene expression matrix information and then accurately predict drug sensitivity37. The mean IC50 values for each chemotherapeutic drug were calculated in both BNIP3 expression groups. The IC50 values between the two groups were compared using the Wilcoxon Rank Sum test, with a significance threshold set at 0.05.
Collection of patient samples
Tumor specimens (10 breast cancer tissues and matched adjacent normal tissues) were collected from patients at Changzhou Cancer Hospital. The specific case information can be found in Supplementary Table S1. The research protocol was approved by the Medical Ethics Committee of Changzhou Cancer Hospital (Approval No. 2024(SR)004). All procedures were performed in accordance with the ethical standards of the institutional committee and with the Declaration of Helsinki.Written informed consent was obtained from all participating patients prior to specimen collection.
Immunohistochemistry staining
Immunohistochemistry (IHC) was performed to evaluate BNIP3 expression in formalin-fixed paraffin-embedded (FFPE) tissue sections from BC patients and matched normal controls. Tissue sections (4–5 μm thick) were prepared and baked at 60 °C for adhesion. Antigen retrieval was conducted using citrate buffer (pH 6.0), followed by blocking of endogenous peroxidase activity with 3% hydrogen peroxide in methanol. Sections were incubated overnight at 4 °C with a primary antibody against human BNIP3 (1:200 dilution; Cat# BA0897, Boster Biological Technology). After washing, sections were incubated with a secondary HRP-conjugated antibody (Cat# SA0001, Boster Biological Technology) for 1 h at room temperature, visualized using 3,3′-diaminobenzidine (DAB; Cat# D001, Solarbio Life Sciences), and counterstained with hematoxylin (Cat# G1010, Solarbio Life Sciences). The staining intensity and percentage of positive cells were scored independently by two pathologists blinded to the clinical data. A semiquantitative scoring system was applied based on two parameters: the proportion of positive cells (scored as 1: 0–24%; 2: 25–49%; 3: 50–74%; 4: 75–100%) and the staining intensity (scored as 0: no staining; 1: weak; 2: moderate; 3: strong)38. The final immunohistochemical score was calculated by combining these two scores; specifically, a combined score of ≥ 4 was defined as positive staining, while scores below this threshold were considered negative39. Negative controls, in which the primary antibody was omitted, were included to confirm staining specificity.
Cell culture and plasmid construction
BC cell lines MCF-7 (#YC-D006, Ubigene, China) and MDA-MB-231 (#YC-D005, Ubigene) were received for the study. L-15 media with 10% FBS (Catalog Number: UBG-12345) was used to sustain the cells. The cultures were incubated in a humidified environment with 5% CO2 at 37 °C.
To construct cell lines that stably knockdown BNIP3 expression, we selected shRNA lentiviral particle (item No.: GKLV05947) for human BNIP3 gene and corresponding non-targeted control shRNA lentiviral particle (item No.: GKLV00001) provided by Shanghai Chemical Technology Co., LTD. Lentiviral particles were produced by co-transfecting 10 µg of either shBNIP3 or shCtrl plasmid together with the packaging plasmids psPAX2 (7.5 µg) and pMD2.G (2.5 µg) into HEK293T cells using the calcium phosphate precipitation method. The viral supernatant was collected 48 h post-transfection, filtered through a 0.45 µm PVDF filter, and used immediately for infection or stored at − 80 °C. For infection, MCF-7 and MDA-MB-231 cells were seeded in 6-well plates at a density of 2 × 10⁵ cells per well. Upon reaching 60–70% confluence, the culture medium was replaced with 1 mL of fresh viral supernatant containing 8 µg/mL Polybrene (Sigma-Aldrich). After 24 h of incubation, the viral supernatant was removed and replaced with complete growth medium. After 72 h of post-infection, the transduced cells were subjected to selection using 2 µg/mL puromycin (InvivoGen) for MCF-7 cells and 1.5 µg/mL puromycin for MDA-MB-231 cells. The selection medium was changed every 2 days until all cells in the non-infected control plate had died (approximately 7–10 days). The resulting polyclonal populations of puromycin-resistant cells were then used for subsequent experiments. The knockdown efficiency at both the mRNA and protein levels was confirmed in the cell linesby qRT-PCR and Western blot.
qRT-PCR
Total RNA was isolated from BC cell lines (MCF-7 and MDA-MB-231) or BC tissues using TRIzol reagent (Invitrogen, #15596026). Briefly, cells or homogenized tissues were lysed with 1 mL of TRIzol. After adding 200 µL of chloroform and phase separation by centrifugation, the aqueous RNA-containing phase was transferred to a new tube. RNA was precipitated with an equal volume of isopropyl alcohol, washed with 75% ethanol, and finally dissolved in nuclease-free water. RNA concentration and purity were assessed using a NanoDrop 2000 spectrophotometer (Thermo Fisher Scientific), and samples with an A260/A280 ratio between 1.9 and 2.1 were used for subsequent analysis. Complementary DNA (cDNA) was synthesized from 1 µg of total RNA using the PrimeScript™ RT kit and gDNA Eraser (Takara Bio Inc., Kusatsu, Japan), according to the manufacturer’s protocol. This two-step process included a 2-min incubation at 42 °C with gDNA Eraser to remove genomic DNA contamination, followed by reverse transcription. qRT-PCR was performed using the SYBR® Premix Ex Taq™ kit (Takara Bio Inc.) on a ABI7500 PCR system (Thermo Fisher Scientific). Each 20 µL reaction mixture contained 10 µL of SYBR Premix Ex Taq, 0.8 µL of each forward and reverse primer (10 µM), 2 µL of cDNA template, and 6.4 µL of nuclease-free water. The thermal cycling conditions were as follows: initial denaturation at 95 °C for 30 s; 40 cycles of 95 °C for 5 s and 60 °C for 34 s; followed by a melt curve analysis step (95 °C for 15 s, 60 °C for 1 min, and 95 °C for 15 s) to confirm amplification specificity. The housekeeping gene ACTB was used as an endogenous control for normalization. The relative mRNA expression levels were calculated using the comparative 2−ΔΔCt method. All primer sequences are provided in Supplementary Table S2.
Western blot
Cells were lysed using RIPA buffer (Beyotime, China) supplemented with protease and phosphatase inhibitors. The protein concentration was quantified with a BCA assay kit (Pierce, USA) according to the manufacturer’s protocol. Equal amounts of protein samples were separated by SDS-PAGE and subsequently transferred onto PVDF membranes (Millipore, USA). After blocking with 5% non-fat milk for 1 h at room temperature, the membranes were incubated overnight at 4 °C with the following primary antibodies: anti-BNIP3 (Proteintech, 68091–1-Ig, 1:5000) and anti-Tubulin (Abcam, EP1332Y, 1:5000). Following incubation with horseradish peroxidase (HRP)-conjugated secondary antibodies, immunoreactive bands were detected using an enhanced chemiluminescence (ECL) detection system (Tanon, China). Tubulin was used as a loading control.
BNIP3 knockdown by siRNA
To achieve BNIP3 knockdown, three different siRNAs (Ubigene, China) were initially tested in MCF-7 and MDA-MB-231 cells. After evaluating their effectiveness, the siRNA with the highest knockdown efficiency was selected for further experiments. MCF-7 and MDA-MB-231 cells were seeded in 6-well plates at a density of 5 × 10⁵ cells per well 1 day prior to transfection to ensure 70–80% confluence at the time of transfection. Cells were transfected with 50 nM of siRNAs using Lipofectamine 2000 (#11668019, Thermo Fisher Scientific) according to the manufacturer’s instructions. Briefly, siRNA and Lipofectamine 2000 were diluted separately in Opti-MEM® I Reduced Serum Medium (Gibco). These solutions were mixed gently and incubated for 20 min at room temperature to allow complex formation. The mixture was then added dropwise to the cells, and the plates were incubated at 37 °C in a CO2 incubator. After 48 h, the efficiency of gene knockdown was verified by qRT-PCR. A scrambled RNA was used as negative control. siBNIP3 sequence was as follows:
-
siBNIP3-1: GGAAGATGATATTGAAAGA
-
siBNIP3-2: GAACTGCACTTCAGCAATA
-
siBNIP3-3: GGAACACGAGCGTCATGAA
CCK-8 experiment
Cells were seeded into 96-well plates at a density of 5 × 10³ cells per well and cultured overnight to allow attachment. After treatment, 10 µL of CCK-8 reagent (Dojindo, Japan) was added to each well followed by incubation at 37 °C for 2 h. The absorbance at 450 nm was measured using a microplate reader (BioTek Synergy H1, USA). All experiments were performed in at least three independent replicates. Data were analyzed using GraphPad Prism version 10.1.2, and cell viability was expressed as a percentage relative to the control group.
Animal experiment
Ethical approval for the study was granted by the Shanghai Tenth People’s Hospital Animal Experiment Ethics Committee (Approval Number: SHDSYY-2024-3031-1). All methods were carried out in accordance with relevant guidelines, and were adhered to the ARRIVE guidelines to ensure ethical and methodological rigor. Ten 6-week-old female nude mice (14–16 g) were obtained from Shanghai Sipple-Bikai Laboratory Animal Co., Ltd. The mice were housed under pathogen-free conditions at 22 ± 2 °C and 50% humidity. For the MDA-MB-231 xenograft tumor model, mice were randomly assigned to two groups prior to the experiment: the shNC group and the shBNIP3 group. MDA-MB-231 cells with BNIP3 knockdown (shBNIP3 cells) or negative control cells (shNC cells) (4 × 10⁶ cells per mouse suspended in PBS) were injected subcutaneously into the right axilla of the mice. Mice were maintained for 30 days post-injection, with data collection commencing 5 days after tumor implantation. Tumor volume was estimated based on the length and width measurements. The survival of mice in each group was monitored for 20 days, and survival curves were plotted to evaluate the effect of BNIP3 knockdown on mouse survival. Anesthesia was inhaled preoperatively with 1% isoflurane. Mice were euthanized with excessive isoflurane after operation and tumors were excised, photographed, and weighed. Any deceased mice were appropriately disposed of by incineration.
Glucose uptake assay
MCF-7 and MDA-MB-231 cells were seeded in 96-well black-walled plates at a density of 8 × 10³ cells per well and allowed to adhere for 24 h. To assess glucose uptake, the culture medium was replaced with glucose-free DMEM and the cells were serum-starved for 4 h. Subsequently, the cells were incubated for 1 h at 37 °C with serum-free medium containing 100 µM of the fluorescent glucose analog 2-NBDG (Cayman Chemical, #11046). Following incubation, the cells were washed twice with PBS to remove excess 2-NBDG. The fluorescence intensity was immediately measured using a Thermo Scientific Varioskan LUX Multimode Microplate Reader (Thermo Fisher Scientific) with excitation and emission wavelengths set at 485 nm and 535 nm, respectively. The relative fluorescence units (RFU) were normalized to the total protein content per well, quantified by a BCA assay, and the results are expressed as a percentage of the control group.
Lactate production measurement
Lactate levels in the cell culture supernatant were determined as an indicator of glycolytic flux. Briefly, MCF-7 and MDA-MB-231 cells were seeded in 12-well plates at 2 × 10⁵ cells per well. After 24 h of attachment, the cells were treated according to the experimental design for a duration of 48 h. At the end of the treatment period, the culture media were collected. The lactate concentration was quantified using a Lactate Assay Kit (Sigma-Aldrich, MAK064) according to the manufacturer’s instructions. The absorbance was measured at 570 nm using the microplate reader mentioned above. The lactate concentration (nmol/µL) in each sample was calculated from a standard curve and normalized to the total cellular protein content.
Extracellular acidification rate (ECAR) analysis
To evaluate glycolytic function, the extracellular acidification rate (ECAR) was measured using a Seahorse XF96 Analyzer (Seahorse XFe96, Agilent). Cells were seeded in XF96 cell culture microplates (Agilent, #101085-004) at a density of 5 × 10³ cells per well and incubated overnight at 37 °C to allow for complete adhesion. Prior to the assay, the growth medium was replaced with Seahorse XF DMEM medium (pH 7.4, Agilent, #103575-100) supplemented with 10 mM glucose (Agilent, #103577-100), 1 mM sodium pyruvate (Agilent, #103578-100), and 2 mM L-glutamine (Agilent, #103579-100). The cells were then incubated for 60 min in a non-CO2 incubator at 37 °C to allow for temperature and pH equilibration. The Glycolysis Stress Test was performed by sequentially injecting the following compounds through the instrument’s injection ports to achieve the indicated final concentrations: 10 mM glucose (to assess glycolytic response), 1 µM oligomycin (Agilent, #103015-100, to inhibit mitochondrial ATP production and reveal glycolytic capacity), and 50 mM 2-deoxy-D-glucose (2-DG, Sigma-Aldrich, #D8375, to inhibit glycolysis). The ECAR (mpH/min) was measured in real-time under standard conditions (37 °C). Key glycolytic parameters, including basal glycolysis, glycolytic capacity, and glycolytic reserve, were calculated from the resultant kinetic data using the Agilent Wave Desktop software (version 2.6.0). An increase in ECAR is indicative of an elevated glycolytic rate.
Statistical analysis
Correlation coefficients were calculated using either Spearman or Pearson analysis, as appropriate. The chi-square test and Wilcoxon test were employed to evaluate differences between groups, and P-values were compared and adjusted multiple times using the Benjamini Hochberg method to control for false discovery rate (FDR). All data are presented as mean ± standard deviation (SD) from at least three independent experiments. A P-value of < 0.05 was considered statistically significant. All statistical analyses were conducted using R (version 4.0.3).