
YF-SUD induces durable protection against lethal VSV-based SUDV GP challenge
We first evaluated the protective efficacy of YF-SUD in an Ifnar−/− mouse model using a validated rVSV-SUDV GP challenge system31,32,33.
As a vaccine candidate, we used YF-SUD29, a live-attenuated YF17D-based vector expressing SUDV GP inserted in-frame at the E-NS1 junction and post-translationally cleaved from the polyprotein (Extended Data Fig. 1a). SUDV GP expression was confirmed by immunostaining on BHK21J cells infected with YF-SUD, showing predominantly cytosolic localization and colocalizing with YFV antigens30 (Extended Data Fig. 1b). YF-SUD replicated comparably to parental YF17D (Extended Data Fig. 1c) and the transgene remained stable over at least three consecutive in vitro passages (Extended Data Fig. 1d). Consistent with other transgenic YF17D constructs29,34, YF-SUD showed delayed neurovirulence in BALB/c pups relative to YF17D (Extended Data Fig. 1e), suggesting in vivo stability of the insert.
Wild-type mice are poorly permissive to both live YF17D-based vaccines35 and SUDV infection36, likely because of species-specific differences in innate antiviral pathways. Vaccine efficacy of YF-SUD was, hence, assessed in susceptible Ifnar−/− mice using a surrogate virus for lethal challenge, namely a recombinant vesicular stomatitis virus (rVSV) expressing SUDV GP (hereafter VSV-SUD), as established for EBOV29,32. The VSV-SUD construct (Extended Data Fig. 2a) replicated rapidly in vitro, reaching titers up to 107 50% tissue culture infectious dose (TCID50) 1 day after infection (dpi) in Vero E6 cells (Extended Data Fig. 2b) and induced surface expression of SUDV GP on infected cells (Extended Data Fig. 2c).
Infection of Ifnar−/− mice with 100 plaque-forming units (PFU) of VSV-SUD caused rapid weight loss and progressive clinical deterioration (deferred grooming, loss of righting reflex, hunched posture, vertebral segmentation, reduced mobility and limping), reaching humane endpoint within 3–4 dpi (Extended Data Fig. 2d–f and Supplementary Table 1). Systemic disease was accompanied by thrombocytopenia, consistent with consumptive coagulopathy and leukopenia, particularly lymphopenia (Extended Data Fig. 2g). These features mirror pathology reported for rVSV-based constructs37,38 and the acute, moribund course of filovirus infection in mice, nonhumans and humans36,39,40, as well as other hemorrhagic fevers41.
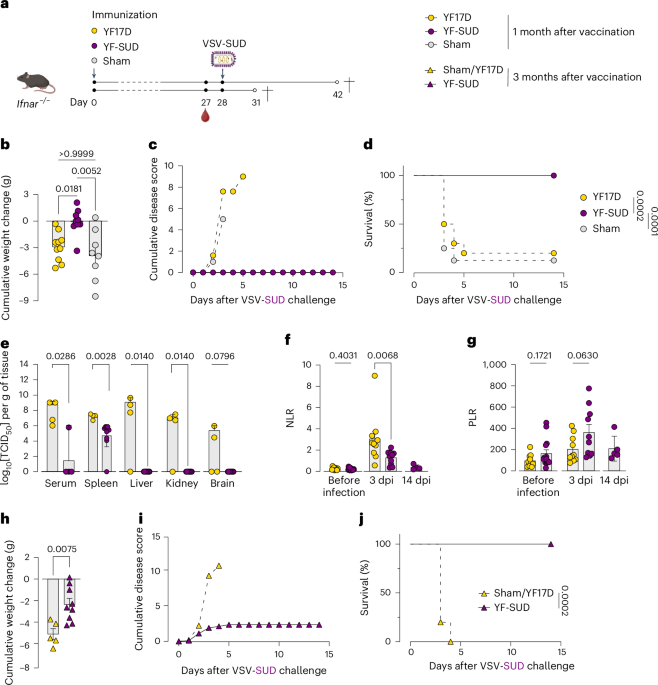
Ifnar−/− mice were vaccinated with a single dose of 250 PFU of YF-SUD or YF17D (empty vector control)29 or assay medium (sham) and infected with VSV-SUD 28 days after vaccination (Fig. 1a). Whereas all YF17D-immunized and sham-immunized mice developed rapid weight loss (>10%) and disease score, YF-SUD-vaccinated mice experienced minimal weight loss (<5% reduction compared to before challenge) and their disease scores remained low (Fig. 1b,c and Extended Data Fig. 3a), resulting in complete survival, in contrast to 80–90% mortality in YF17D-vaccinated and sham-vaccinated groups (Fig. 1d).

a, Schematic representation of challenge study design. Created in BioRender; Broeckhoven, E. https://BioRender.com/fqqrqvn (2025). b–d, Cumulative weight loss (b), cumulative disease score (c) and Kaplan–Meier curve (d) of YF17D-vaccinated (n = 10), YF-SUD-vaccinated (n = 10) and sham-vaccinated (n = 8) groups following VSV-SUD challenge 1 month after vaccination. e, Viral loads in serum, spleen, liver, kidney and brain at 3 dpi in YF17D-vaccinated (n = 4) or YF-SUD-vaccinated (n = 9) Ifnar−/− mice. f,g, NLR (f) and PLR (g) in preinfection groups (YF17D, n = 14; YF-SUD, n = 15) and infected groups (YF17D 3 dpi, n = 10; YF-SUD 3 dpi, n = 10; YF-SUD 14 dpi, n = 5). h–j, Cumulative weight loss (h), cumulative disease score (i) and Kaplan–Meier curve (j) of YF-SUD-vaccinated (n = 9) or YF17D/sham-vaccinated (n = 5) mice following VSV-SUD infection at 3 months after vaccination. Data are presented as the mean ± s.e.m., except for viral loads, which are presented as the geometric mean ± 95% confidence intervals. Statistical significance was determined using a two-sided log-rank test for survival curves (d,j), two-sided Mann–Whitney U-test for viral loads and NLR/PLR (e–h) and two-sided Kruskal–Wallis test with Bonferroni correction for cumulative weight loss (b). P values are indicated above the error bars.
Source data
At 3 dpi, YF17D controls displayed systemic high viral titers (up to 109 TCID50 per g of tissue), while virus was not detected in the liver, kidney and brain of YF-SUD-vaccinated mice and only transiently detected in the spleen. Notably, these viral loads were ~100-fold lower compared to YF17D-vaccinated controls (Fig. 1e). Viral loads in the spleen continued to increase in the YF17D-vaccinated mice (by ~10-fold) but were rapidly controlled in YF-SUD-vaccinated mice between 2 and 3 dpi (Extended Data Fig. 3b).
Challenge-induced lymphopenia was observed in all groups (Extended Data Fig. 3c,d), with elevated neutrophil-to-lymphocyte ratios (NLR), as a diagnostic marker for severity of infection42,43, at 3 dpi. However, NLR remained significantly lower in YF-SUD-vaccinated mice compared to YF17D controls (P = 0.0068) and returned to preinfection baseline by 14 dpi (Fig. 1f and Extended Data Fig. 3e). Thrombocytopenia was also less pronounced in YF-SUD-vaccinated mice, resulting in a lower (albeit not significant) platelet-to-lymphocyte ratio (PLR) (P = 0.06; Fig. 1g and Extended Data Fig. 3f).
To assess durability, mice were challenged 3 months after vaccination. YF-SUD-immunized mice showed significantly less weight loss and no overt disease (Fig. 1h,i), remaining protected from lethal VSV-SUD infection (Fig. 1j). Together, a single low dose of YF-SUD confers durable, nonsterilizing protection against a vigorous surrogate SUDV-like systemic viral infection.
SUDV GP-specific nonneutralizing antibodies engage through Fc-effector functions
Abundant IgG2c-secreting cells were detected 28 days after vaccination in both YF-SUD-vaccinated and YF17D-vaccinated mice (Fig. 2a), consistent with previous reports of YF17D-induced responses against E protein35,44. Given that high levels of binding IgG antibodies (bAbs) have been established as CoP for EBOV across different vaccine platforms19, we characterized the SUDV GP-specific humoral immune response in the sera of vaccinated mice. YF-SUD induced predominantly IgG2c antibodies at 1 month, with low titers of IgG2b and IgG1, resulting in a high IgG2c/IgG1 ratio, indicative of a T helper 1 (TH1)-skewed antiviral immune response (Fig. 2b,c). IgG3 levels were below the detection limit (Fig. 2b). Seroconversion to SUDV GP-specific bAbs occurred within 7 days, while titers increased until 21 days and remained stable up to 3 months after vaccination (Fig. 2d), with sustained circulating IgG2c-secreting B cells.

a, IgG2c-specific SFU by circulating plasma cells 28 days after vaccination (YF-SUD, n = 9; sham, n = 5; YF17D, n = 9). b, IgG isotyping (total IgG, IgG1, IgG2b, IgG2c and IgG3) of circulating antibodies 28 days after vaccination in YF17D (n = 7) and YF-SUD (n = 8) groups. Data are presented as a heat map, with columns representing individual mice and rows representing individual IgG isotypes. The color-coded bar represents the antibody titer. c, IgG2c/IgG1 ratio, indicating TH1-skewed antibody responses (before infection, n = 8; 3 dpi, n = 4). d, Total IgG antibody kinetics during the first month after vaccination (YF17D/sham, n = 4 each; YF-SUD, n = 8) and at 3 months after vaccination (YF17D/sham, n = 4 each; YF-SUD, n = 8). e, PVNT50 of replication-competent VSV-SUD by serum of vaccinated mice 28 days after vaccination (YF17D, n = 9; YF-SUD, n = 10). The dotted line indicates the limit of detection. f, Representative histograms of neutrophil phagocytosis assay using SUDV GP-coated beads, coincubated with YF17D serum or YF-SUD serum with or without latrunculin A (gated on CD3−CD11b+Ly6G+ cells). g, Phagocytic score of ADNP of SUDV GP-coated beads and OVA-coated beads by serum 28 days after vaccination (YF17D, n = 8; YF-SUD, n = 9; YF-OVA, n = 5); h–j, Cumulative weight change (h), disease score progression (i) and Kaplan–Meier survival curve (j) of Ifnar−/− and Ifnar−/−Fcgr1−/− mice vaccinated with 250 PFU of YF17D (n = 8 and n = 6, respectively) or YF-SUD (n = 8 and n = 7, respectively) following VSV-SUD infection (100 PFU). k–m, Experimental setup (k; created in BioRender; Broeckhoven, E. https://BioRender.com/2g78di9 (2025)), cumulative weight change (l) and Kaplan–Meier survival curve (m) of recipients of a serum transfer with YF17D or YF-SUD serum (n = 5 per group) followed by a VSV-SUD infection (100 PFU). Data are presented as the mean ± s.e.m. Statistical significance was determined using a two-sided log-rank test for survival curves (j,m), two-sided Mann–Whitney U-test (a,c,e,l) and two-sided Kruskal–Wallis test with Bonferroni correction for cumulative weight loss and ADNP (g,h). P values are indicated.
Source data
Although neutralizing antibodies (NAbs) are often considered essential for vaccine efficacy45, only three of ten vaccinated mice had detectable SUDV GP-specific NAbs before challenge, despite uniform protection (Fig. 2e). Notably, no rapid recall response was observed. Specifically, bAb titers did not increase significantly within 3 dpi (Extended Data Fig. 4a) and NAbs remained largely undetectable even at 2 weeks after infection (Extended Data Fig. 4b). These findings are in line with the observation that human survivors of EBOD frequently do not develop detectable NAbs up until months after infection, indicating that filoviruses may use unique mechanisms to evade classical NAb-mediated immunity46. Likewise, at least in our mouse model, protection could not be attributed to rapid humoral recall or de novo antibody responses.
Antibody effector functions, including antibody-dependent neutrophil phagocytosis (ADNP) and natural killer (NK) cell activation have been linked to protection against filovirus infection47. We, therefore, evaluated ADNP ex vivo using whole blood from naive mice. Fluorescent beads coated with SUDV GP or ovalbumin (OVA) as an irrelevant antigen control were incubated with sera from YF-SUD-vaccinated animals and subsequently added to the whole blood. Sera from YF-SUD-vaccinated animals significantly increased the frequency of phagocytosing neutrophils (CD3−CD11b+Ly6G+; Extended Data Fig. 4e) and promoted uptake of multiple SUDV GP-coated beads (Fig. 2f). By contrast, sera from YF17D-vaccinated controls did not enhance specific bead uptake (Fig. 2g and Extended Data Fig. 4f). Antigen specificity was confirmed using OVA-coated beads and anti-OVA serum from YF-OVA-vaccinated mice (Fig. 2g and Extended Data Fig. 4c,d), demonstrating that bead accumulation was mediated by antigen-specific antibodies. Latrunculin, an inhibitor of actin polymerization that prevents phagocytosis48, inhibited internalization but not surface binding, confirming active Fc-mediated phagocytosis (Fig. 2f,g; Extended Data Fig. 4f).
To assess functional relevance, we generated Ifnar1 and Fcgr1 double-knockout) (Fcgr1 DKO) mice, ablated of FcγR-mediated effector functions because of impaired expression of FcγRI, FcγRIII and FcγRIV on granulocytes and lymphocytes49 (Extended Data Fig. 4g). YF-SUD induced comparable SUDV GP-specific IgG responses in Fcgr1 DKO and Ifnar−/− mice, with similar frequencies of IgG1-secreting and IgG2c-secreting B cells (Extended Data Fig. 4h–j) and no detectable NAbs (Extended Data Fig. 4i). Thus, FcγR deficiency did not measurably alter the magnitude or subclass distribution of the YF-SUD-elicited humoral response. Despite impaired FcγRs signaling, YF-SUD-vaccinated Fcgr1 DKO mice were protected from challenge without weight loss or clinical disease (Fig. 2h–j). To assess whether other immune components compensate FcγR deficiency, we performed serum transfer into naive Ifnar−/− mice before challenge (Fig. 2k). Recipients of serum from either YF17D-immunized or YF-SUD-immunized donors showed comparable weight loss and reached humane endpoint (Fig. 2l,m), corroborating the results observed in Fcgr1 DKO mice. Altogether this indicates that, whereas YF-SUD induces SUDV GP-specific antibodies capable of mediating ADNP, antibody-mediated effector functions may be redundant for protection, similar to a debatable antiviral activity commonly associated with NAbs.
Enhanced NK cell priming and resistance to functional exhaustion in YF-SUD-vaccinated mice
In the absence of detectable NAbs and FcγR-mediated effector functions, we next examined the cellular compartment, including NK cells and distinct T cell subsets, which are recognized mediators of antiviral immunity (including during EBOV infection)50, for their contribution to vaccine-induced protection against lethal challenge. Deep phenotyping of splenic CD45+ cells revealed no significant differences in overall B cell and T cell frequencies between YF-SUD-vaccinated and YF17D-vaccinated mice before challenge (Fig. 3a and Extended Data Fig. 5a,b). Following infection, proliferating NK cells, γδ T cells and regulatory T (Treg) cells increased in both groups (Fig. 3a).

a, Relative frequency of proliferating immune cells in the YF17D and YF-SUD groups at before and after (3 dpi) infection. The frequency of each population is depicted by circle size, while the color-coded bar indicates the frequency of proliferating cells (Ki67+). b, UMAP representation of NK cell subpopulation distribution based on NKG2D and NKG2A expression (gated on CD3−CD19−NK1.1+ lymphocytes). c, Representative contour plots and frequency of NK cells subpopulations, stratified by the expression of NKG2D and NKG2A surface markers, before and after (3 dpi) infection. d,e, Frequency of NKG2D+ NK cells expressing IFNγ, perforin, granzyme B and CD107a (d) or PD1 (e) in vaccinated mice before and after infection (gated on live CD3−CD19−NK1.1+NKG2D+ cells). For d,e, n = 7 for YF17D groups and n = 8 for YF-SUD groups. Data are presented as the mean ± s.e.m. Statistical significance was determined using a two-sided Mann–Whitney U-test (c,e) or two-sided Kruskal–Wallis test for multiple comparisons (d). P values are indicated.
Source data
YF-SUD-vaccinated mice showed greater NK cell expansion than YF17D-vaccinated mice, which was further increased at 3 dpi (Extended Data Fig. 5b,c). Before infection, most NK cells (>80%) expressed the activating receptor NKG2D+, involved in cytotoxicity effector functions, with approximately 50% coexpressing also the inhibitory NKG2A receptor (Fig. 3b,c). Challenge reduced NKG2D+ frequencies and led to accumulation of a previously negligible NKG2D−NKG2A− subset in both groups, whereas the NKG2A+ fraction within NKG2D+ NK cells remained unchanged (Fig. 3b,c).
As most NK cells were NKG2D+ before infection, we assessed cytotoxic potential ex vivo without additional stimulation. Both vaccinated groups exhibited low levels of IFNγ and granzyme B but elevated perforin expression with CD107a surface upregulation, indicative of degranulation activity (Fig. 3d and Extended Data Fig. 5d). In YF-SUD-immunized mice, the NK cell cytolytic profile remained before and after infection (all P > 0.05). By contrast, NK cells from YF17D-vaccinated mice showed increased IFNγ (P < 0.01), reduced perforin (P = 0.0431) and granzyme B (P = 0.1617) and an approximately threefold increase in CD107a+NKG2D+ NK cells (P = 0.0276), alongside increased expression of programmed cell death protein 1 (PD1) (P = 0.0059) (Fig. 3e), consistent with activation and partial exhaustion.
Antigen-independent stimulation using concanavalin A (ConA) restored NKG2D expression and IFNγ production in NK cells from YF17D-vaccinated mice, indicating phenotypic reversibility, whereas NK cells from YF-SUD-vaccinated mice maintained stronger activation responses (Extended Data Fig. 5e).
Despite increased PD1 in YF17D controls (P = 0.0059; Fig. 3e), the NKG2D+NKG2A+ subset retained cytolytic capacity (Extended Data Fig. 5f), whereas the infection-induced NKG2D−NKG2A− subset displayed low perforin and granzyme B despite elevated IFNγ and CD107a (Extended Data Fig. 5g,h). Overall, our results suggests that vaccination with YF-SUD primes NK cells for an enhanced cytokine secretion and may potentiate their cytotoxic function while challenge of antigen-naive mice induces transient overactivation with features of exhaustion.
Effector CD8⁺ T cell responses induced by YF-SUD vaccination are dispensable for protection against lethal challenge
To further assess cellular mechanism of protection, we analyzed CD8+ T cells. For this, antigen-experienced CD44+CD8+ T cells were classified as short-lived effector cells (SLECs; KLRG1+CD127−) or memory precursors (MPs; KLRG1−CD127+) (Fig. 4a and Extended Data Fig. 6a). Before infection, most memory CD8⁺ T cells exhibited an MP phenotype, which was significantly increased in YF17D-vaccinated mice. Although overall frequencies were lower, YF-SUD-vaccinated mice showed a relatively higher proportion of SLECs (Fig. 4b). As expected, expression of early activation (CD69) and proliferation (Ki67) markers returned to homeostatic levels by day 28 (Fig. 4c).

a, Representative dot plot of KLRG1 and CD127 gating within the antigen-experienced (CD44+) CD8+ population. b, Frequency (%) of SLECs (CD8+CD44+KLRG1+CD127−) and MPs (CD8+CD44+KLRG1−CD127+) in YF17D and YF-SUD vaccinated mice before infection (no inf) and at 3 dpi. c,d, Activation (CD69+) and proliferation (Ki67+) status (c) and representative contour plots (d) of CD8+ SLECs and MPs for all groups at each time point. e, Heat map of the frequency (%) of CD8+ T cells expressing perforin, granzyme B, CD107a, IL-2, IFNγ or TNF. For b–e, n = 7 for YF17D groups and n = 8 for YF-SUD groups. f,g, IFNγ-specific (green) and IL-2-specific (red) SFU per 106 splenocytes after SUDV GP peptide stimulation in vaccinated mice 1 month after vaccination (f; YF17D, n = 8; YF-SUD, n = 9) and at 3 dpi (g; YF17D, n = 10; YF-SUD, n = 11). h, Schematic representation of T cell depletion experiment: vaccinated Ifnar−/− mice received anti-T cell-depleting antibodies (anti-CD4 and anti-CD8) at 25 and 27 days after vaccination and 1 day after VSV-SUD infection or anti-NK depleting antibody at 26 and 27 days after vaccination and 2 days after infection. Mice were followed up until humane endpoint or experimental endpoint at 14 dpi. Created in BioRender; Broeckhoven, E. https://BioRender.com/5bexope (2025). i,j, Cumulative weight loss (i) and Kaplan–Meier survival curve (j) of YF-SUD-vaccinated mice depleted of NK cells (n = 6), CD4+ (n = 9), CD8+ (n = 8) and CD4+CD8+ T cells (n = 8) compared to nondepleted (n = 7) and YF17D-vaccinated (n = 8) controls. Data are presented as the mean ± s.e.m. Statistical significance was determined using a two-sided Mann–Whitney U-test (b,c,f,g), two-sided Kruskal–Wallis test for multiple comparisons (i) or two-sided log-rank test for survival data (j). P values are indicated.
Source data
CD8+ MPs remained unchanged in both vaccinated groups after the challenge (Fig. 4b). CD8+ T cells from YF17D-vaccinated mice showed a modest yet significant increase in proliferation, whereas CD69 upregulation was lower in YF-SUD-vaccinated mice. Conversely, CD8+ SLEC proliferation was prominent only in YF-SUD-vaccinated mice (Fig. 4c,d). This resulted in a nonsignificant increase in CD44+CD62L+ central memory T (TCM) cells at 3 dpi, with no differences in the effector memory (CD44+CD62L−; TEM) and naive compartments (Extended Data Fig. 6c).
Ex vivo stimulation with SUDV GP peptides induced minimal cytokine production before infection in both groups, with slightly higher granzyme B and IFNγ in YF-SUD-vaccinated mice (Fig. 4e). At 3 dpi, granzyme B increased in both groups, while IFNγ upregulation was restricted to a subset of YF-SUD mice (Fig. 4e).
FluoroSpot analysis confirmed higher frequencies of SUDV-specific IFNγ-secreting T cells in YF-SUD-vaccinated mice at 1 month after vaccination (P < 0.0001; Fig. 4f), increasing up to fourfold after the challenge (Fig. 4g). Interleukin-2 (IL-2)-secreting T cells were also significantly elevated before infection in the YF-SUD group (P = 0.005) but did not further expand after challenge (Fig. 4f,g). ConA stimulation induced comparable IFNγ and IL-2 responses across groups (Extended Data Fig. 6d,e), indicating antigen-specific modulation.
In summary, these compiled data suggest that CD8+ T cells and NK cells may not be sufficient for protection against lethal challenge. To directly test functional relevance, NK cells, CD8+ T cells, CD4+ T cells or both CD8+ and CD4+ T cells were depleted before challenge (Fig. 4h). Effective depletion of NK cells and other targeted populations was confirmed at the time of infection or at humane endpoint (Extended Data Fig. 7b,c). NK or CD8+ T cell-depleted mice remained protected, with no clinical signs and 90–100% survival (Fig. 4i,j and Extended Data Fig. 7a). By contrast, CD4+ T cell depletion, alone or combined with CD8+ T cell depletion, resulted in loss of vaccine-induced protection and a mortality indistinguishable from that of YF17D control mice (Fig. 4j).
Antigen-experienced and naive CD4⁺ T cells orchestrate protective effector responses
To examine whether CD4+ T cells orchestrate protective immunity, we performed congenic adoptive transfer experiments. Ifnar−/−Ly5.1 mice were vaccinated with YF-SUD and Ifnar−/−Ly5.2 mice were vaccinated with YF17D; splenocytes were mixed (1:1), labeled with CellTrace violet (CTV) and transferred into naive Ifnar−/−Ly5.2 recipients before VSV-SUD challenge (Extended Data Figs. 8a and 9a). B cells (B220+) from either donor group did not expand upon challenge (P = 0.1562; Extended Data Fig. 8b). By contrast, CD4+ and CD8+ T cells derived from YF-SUD-vaccinated donors proliferated significantly more than those from YF17D-vaccinated mice (P = 0.0312; Extended Data Fig. 8c,d).
When CD4+ T cells were depleted from vaccinated donors before transfer, proliferation of primed CD8+ T cells remained intact in recipients (Extended Data Figs. 8e and 9b) and robust B cell proliferation was observed (Extended Data Fig. 8f). These findings suggest that, in the absence of primed CD4+ T cells, naive host CD4+ T cells responding to challenge may provide bystander help to B and CD8+ T cells.
To assess sufficiency, purified primed CD4+ T cells were transferred into naive Ifnar−/− mice. This did not confer protection, as recipients developed severe disease and 80% succumbed (Extended Data Fig. 8g–i).
Collectively, these data demonstrate that, although NK cells and SUDV GP-specific CD8+ T cells expand and acquire effector function following vaccination, they are neither required nor sufficient for protection. Instead, CD4+ T cells have a central and indispensable role in coordinating protective SUDV-specific immunity during an acute infection.
CD4+ effector cells and Treg cells orchestrate balanced antiviral immunity in YF-SUD-vaccinated mice
We next defined the phenotypic and functional characteristics of protective CD4+ T cells in YF-SUD- and YF17D-vaccinated Ifnar−/− mice. Before challenge, CD4+ TCM frequencies were comparable, whereas YF17D vaccination preferentially generated CD4+ TEM cells (P = 0.0012) and CD4+ MPs (P = 0.0003) and YF-SUD vaccination favored CD4+ SLEC differentiation (P = 0.0003) (Fig. 5a and Extended Data Fig. 10a).

a, Frequency of CD4+ TCM cells, TEM cells and SLECs (CD4+KLRG1+CD127−) in mice vaccinated with either YF-SUD or YF17D, before and at 3 dpi with VSV-SUD. b–d, Representative contour plot (b) and percentage of activated (CD69+; c) and proliferating (Ki67+; d) CD4+ T cells present in the spleen from vaccinated mice before infection and at 3 dpi. e, Cytokine-expressing CD4+ T cells in vaccinated mice 1 month after vaccination and at 3 dpi, measured by intracellular staining of IFNγ, TNF, IL-2, IL-4, IL-5, IL-6, IL-10 and IL-17. f, Schematic representation of T cell depletion experiment: vaccinated Ifnar−/− mice received anti-IFNγ antibodies 4 h before infection (27 days after vaccination) and 2 days after VSV-SUD infection. Mice were followed up until humane endpoint or experimental endpoint at 14 dpi. Created in BioRender; Broeckhoven, E. https://BioRender.com/cgptbae (2025). g,h, Cumulative weight change (g) and Kaplan–Meier survival curve (h) of YF-SUD-vaccinated mice depleted of IFNγ (n = 7) compared to nondepleted (n = 7) and YF17D-vaccinated (n = 8) controls. i–k, Frequency and representative image of Treg cells (CD4+CD25+) in vaccinated groups before infection and at 3 dpi (i), as well as their proliferation (j) and exhaustion (k) status. For a–k, n = 7 for YF17D groups and n = 8 for YF-SUD groups. Data are presented as the mean ± s.e.m. Statistical significance was determined using a two-sided Mann–Whitney U-test (a,c,d,j,k), two-sided Kruskal–Wallis test for multiple comparisons (g,i) or two-sided log-rank test for survival data (h). P values are indicated.
Source data
At 3 dpi, CD4+ compartment dynamics diverged, clearly discriminating primary responses in YF17D controls from anamnestic responses in YF-SUD vaccinated mice. Although TCM and TEM frequencies declined in both groups, more prominently in YF17D controls, YF-SUD-vaccinated mice showed expansion of CD4+ SLECs (P = 0.0003) with contraction of CD4+ MPs (P = 0.0003) (Fig. 5a and Extended Data Fig. 10c). Nevertheless, despite the vigorous challenge infection, the majority of CD4+ T cells remained phenotypically naive in both groups, with a relative increase in naive cells in YF17D-vaccinated mice (Fig. 3a–c and Extended Data Fig. 10b,c).
Following challenge, YF17D-vaccinated mice exhibited broader CD4+ T cell activation (CD69+CD4+ Tnaive cells, P = 0.45; CD69+CD4+ TCM cells, P = 0.0003; CD69+CD4+ TEM cells, P = 0.0008; CD69+CD4+ SLECs, P = 0.003; CD69+CD4+ MPs, P = 0.003) (Fig. 5b,c and Extended Data Fig. 10c). Conversely, CD4+ T cells of YF-SUD-vaccinated mice displayed increased proliferation across memory subsets (Ki67+CD4+ TCM cells, P = 0.066; Ki67+CD4+ TEM cells, P = 0.022; Ki67+CD4+ SLECs, P = 0.15; Ki67+CD4+ MPs, P = 0.14) (Fig. 5b,d and Extended Data Fig. 10c).
Overall, these findings suggest, that in the YF17D vector control group, CD4+ MPs (that is, with no specificity for SUDV GP) undergo broad bystander activation without conferring protection, whereas YF‑SUD generates CD4+ SLECs and MPs, forming a reservoir of proliferating, recall‑competent CD4+ T cells favoring SUDV GP-specific responses. These differences and dynamics were confined to the spleen, as circulating CD4+ memory frequencies were comparable between groups and unchanged after infection (Extended Data Fig. 10d).
Upon ex vivo stimulation with a SUDV GP peptide pool, CD4+ T cells from YF-SUD-vaccinated mice produced significantly more IFNγ at 3 dpi (P = 0.005; Fig. 5e; gating strategy in Extended Data Fig. 10e), without induction of tumor necrosis factor (TNF), IL-2, IL-4, IL-5, IL-10 or IL-17. A cytotoxic CD4+NKG2D+ subset was enriched after YF-SUD vaccination but reduced threefold after YF17D vaccination at 3 dpi (Extended Data Fig. 10f). In YF17D, this subset exhibited increased proliferation and PD1 expression (P = 0.0022 and P = 0.0012, respectively; Extended Data Fig. 10g), whereas, in YF-SUD, mice expressed granzyme B, IFNγ and TNF (Extended Data Fig. 10g,h), indicating a shift from conventional helper function toward cytotoxic or innate-like effector activity in the CD4+ compartment.
To directly test the requirement for IFNγ, vaccinated mice were treated with a neutralizing anti-IFNγ antibody 4 h before infection and at 2 dpi (Fig. 5f). IFNγ blockade abrogated protection. All vaccinated mice exhibited rapid weight loss by 3 dpi and succumbed comparably to placebo controls (Fig. 5g,h), establishing IFNγ as a nonredundant mediator of protective immunity.
In addition to changes in the effector compartment of CD4+ T cells, a marked increase in CD25+ Treg cells in the YF-SUD group at 3 dpi was observed (P = 0.0002 versus YF17D at 3 dpi and P = 0.07 versus YF-SUD before infection) (Fig. 5i and Extended Data Fig. 10i, j). Proliferating CD25+FOXP3+ Treg cells increased approximately twofold (P = 0.09), without changes in exhaustion marker expression (Fig. 5j,k). Cytokine profiling of this Treg cell population (gated on CD4+FOXP3+ cells), revealed a decrease in the TH17–Treg cell population in YF17D (P = 0.009 at 3 dpi) but no differences in TH1 (T-bet) or TH2 (IL-4) profiles (Extended Data Fig. 10k). These data indicate that YF-SUD vaccination promotes coordinated regulatory expansion alongside effector differentiation. Preservation of the TH17–Treg cell axis in YF-SUD-vaccinated mice may permit effective antiviral cytotoxicity while limiting excessive immune activation, in contrast to the dysregulated response observed in YF17D controls51,52.
Together, these data define an IFNγ-dependent, TH1-polarized CD4+ response characterized by cytotoxic differentiation and coordinated Treg cell expansion as the central mediator of protection.
Dissonance between statistical correlates and experimentally determined mechanisms of protection
To integrate cellular, functional and physiological correlates of immunity, we performed principal component analysis (PCA) incorporating spectral flow-cytometry-derived immune signatures alongside body weight loss as a measure of disease severity. The first principal component (PC1) segregated infected from uninfected mice, driven by NK cell activation, CD8+ effector responses and body weight loss. PC2 further discriminated YF-SUD-vaccinated from YF17D-vaccinated mice on the basis of cytokine responsiveness and NK or T cell proliferation. Notably, three of eight YF-SUD-vaccinated mice clustered with unchallenged controls, indicative of sterilizing immunity (Fig. 6a).

a, PCA of immune and clinical parameters shown as distribution of experimental group and challenge. b, ROC curve analysis of body weight change at 3 dpi as predictive value for survival. c, Correlation network analysis of body weight change and immune parameters only interactions with Spearman’s ρ ≥ 0.7 and FDR ≤ 0.05 are shown. d, Simple linear regression of Treg cells with body weight change and CD4+NKG2D+PD1+ cells with body weight change.
Source data
As spectral flow cytometry samples were collected before terminal disease outcomes, we evaluated body weight loss as a surrogate for survival. Receiver operating characteristic (ROC) curve analysis of eight independent challenge experiments (n = 103 mice) showed that ≥7.51% body weight loss at 3 dpi predicted lethality with high accuracy (Fig. 6b; AUC = 0.94, sensitivity = 0.94 and specificity = 0.8). Using this threshold, all eight YF-SUD-vaccinated mice were predicted to survive, whereas seven of eight YF17D-vaccinated mice were predicted to succumb.
Using body weight loss as a proxy for mortality, we performed univariate correlation and network analysis to identify immune parameters associated with disease or protection. Consistent with depletion experiments (Fig. 4h–j), increased frequencies of CD4+ TCM and TEM cells, particularly the NKG2D+ cytotoxic CD4+ subset, correlated strongly with preservation of body weight and survival. Treg cells also trended positively with survival (ρ = 0.66 and false discovery rate (FDR) = 0.058; Fig. 6c,d), suggesting a possible role in restraining immunopathology. Conversely, exhaustion signatures within the cytotoxic CD4+ compartment strongly correlated with disease severity (ρ = −0.94, FDR = 2 × 10⁻⁴; Fig. 6d).
Interestingly, frequencies of granzyme B+ double-negative NK cells and TNF+CD8+ TCM cells showed a strong positive correlation with body weight loss (Fig. 6c), despite being dispensable for protection (Fig. 4h–j). By contrast, a distinct cluster characterized by CD4+ T cell proliferation and IFNγ production, previously identified as required for protection (Fig. 5j,k), showed poor correlation with body weight changes (Fig. 6c). These findings underscore a disconnect between immunological features statistically associated with disease progression and those causally mediating protection, highlighting that mechanistic effectors of immunity may not be readily inferred from physiological indicators of disease severity.