
Ethics
All medical research involving human participants was reviewed and approved by the Biomedical Research Ethics Committee of Peking University First Hospital (Ethics License No. 2025-036). All animal experiments were approved by the Ethics Committee of Peking University Health Science Center under license number J202199.
Patients and tissue samples
Patients with type 2 diabetes mellitus (T2DM) and renal biopsy-confirmed DKD (n = 39) diagnosed at Peking University First Hospital from January 1, 2009, to December 31, 2019, were recruited for this study. T2DM and DKD were defined as previously described46. Patients with other known renal diseases were excluded. Clinical and pathological data were obtained from the electronic medical records of the patients at the hospital. The Chronic Kidney Disease Epidemiology Collaboration (CKD-EPI) equation was used to calculate the estimated glomerular filtration rate (eGFR)47. Renal biopsy samples were collected to detect C5aR2 protein expression in the kidney. Healthy control kidney samples (n = 9) were obtained from the non-tumorous poles of kidneys resected during tumor nephrectomy in individuals with no history of diabetes or other kidney diseases and were pathologically confirmed to be normal renal tissue. All renal biopsy samples were independently scored by two experienced pathologists who were blinded to the clinical and demographic data. Any discrepancies in scoring were rereviewed to reach a consensus.
The kidney endpoint was defined as a 40% reduction in the eGFR or ESKD. The definition of ESKD was consistent with that in previous studies48. Patients who did not reach the endpoint at the last visit were censored during the analysis. All medical research involving human participants was reviewed and approved by the Biomedical Research Ethics Committee of Peking University First Hospital (Ethics License No. 2025-036).
Experimental animals
C5ar2−/− mice were purchased from GemPharmatech Co., Ltd., and generated by Nanjing BioMedical Research Institute of Nanjing University (NBRI) via clustered regularly interspaced short palindromic repeats (CRISPR)-Cas9 genome engineering. To generate these mice, we transcribed sgRNA in vitro and microinjected Cas9 or sgRNA into the fertilized eggs of C57BL/6J mice. These correctly targeted mice verified by PCR and sequencing were mated with C57BL/6J mice to obtain a mouse model that could be stably inherited. The coding region of exon 2 of the C5ar2-201 (ENSMUST00000098792.9) transcript, spanning approximately 1.1 kb in length, was selected as the knockout region, and genotyping was performed by PCR of tail DNA using gene-specific primers (Supplementary Fig. S1a, b). qRT-PCR analysis confirmed the absence of C5ar2 expression in C5ar2−/− mice (Supplementary Fig. S1c). For the experiments involving C5ar2−/− mice, littermate WT mice with normal gene expression at 6–8 weeks of age were used. Male diabetic db/db (C57BL/6J-LepRdb/db) mice and their nondiabetic m/m (C57BL/6J-LepR+/+) littermates were purchased from GemPharmatech Co., Ltd.
All the mice were maintained under specific pathogen-free conditions at the Laboratory Animal Center of Peking University First Hospital. All animal experiments were approved by the Ethics Committee of Peking University Health Science Center under license number J202199.
Animal experiments
Four-week-old WT mice and C5ar2−/− mice were fed a high-fat diet (HFD) (60% fat; Beijing Keao Xieli Feed Co., Ltd., China) for 4 weeks, followed by intraperitoneal injections of STZ (S0130; Sigma‒Aldrich) dissolved in 50 mM sodium citrate buffer (pH 4.5; Solarbio) at a dose of 60 mg/kg for 5 consecutive days. Afterward, the mice were fed an HFD for a total of 20 weeks. Mice fed a standard-fat diet (SFD, 10% fat) served as nondiabetic controls. One week after the STZ injections, fasting blood glucose levels were measured, and only mice with sustained hyperglycemia (fasting blood glucose concentration >16.7 mmol/L) were included in the diabetic group for subsequent studies.
In the PTEC-specific PSS2 overexpression study, DKD was induced in four groups of C5ar2−/− and WT mice via the STZ/HFD protocol described above. One week after the STZ injections, one group of diabetic C5ar2−/− mice and one group of diabetic WT mice received tail vein injections of AAV9 vectors carrying Pss2 under the Ksp-cadherin promoter (AAV9-Ksp-Pss2). The other two groups were injected with control AAV9 vectors (AAV9-Ksp-Ctrl). Three weeks after virus infection, kidney tissues were collected to confirm PSS2 overexpression via western blotting and qRT-PCR.
For treatment studies in db/db mice, 8-week-old db/db mice were subcutaneously administered P59 (1 mg/kg, 3 mg/kg, or 5 mg/kg in PBS containing 0.05% (v/v) DMSO) or vehicle (PBS containing 0.05% (v/v) DMSO) every 24 h for 10 weeks. Age-matched m/m mice from the same litter treated with vehicle served as nondiabetic controls. For subsequent MAM fraction extraction, one group of m/m mice and one group of db/db mice were treated with 3 mg/kg P59, whereas the other two groups received vehicle subcutaneously every 24 h for 10 weeks.
P59 synthesis
P59 was synthesized according to Croker et al. by SciLight Biotechnology, LLC (Beijing, China), with an acetylated N-terminus and a purity of > 98%37. The C-terminus of the peptide was left unmodified. Purity was confirmed by analytical high-performance liquid chromatography (HPLC) and liquid chromatography‒mass spectrometry (LC‒MS) analysis.
Laboratory data assessments
The body weights of the mice were measured to an accuracy of 0.01 g. Fasting blood glucose, total cholesterol, and triglyceride levels were quantified via a GM3000 Chemistry Analyzer (Promega Biotech Co., Ltd.). The urinary albumin concentration was determined with a mouse ALB ELISA kit (E99-134; Bethyl Laboratories). Urinary creatinine levels were determined with a creatinine assay kit (DICT-500; BioAssay Systems). The uACR was calculated as the ratio of the urinary albumin concentration (μg) to the urinary creatinine concentration (mg).
Cell culture and treatment
The TCMK-1 cell line was purchased from Fu Heng Biotechnology (China) and cultured in basic essential medium (PM150411, Procell). HK-2 human renal proximal tubule cells (ATCC, Rockville, MD) were cultured in DMEM/F-12 medium (CM-0109; Procell, Wuhan, China). HEK293T cells (ATCC) were cultured in complete cell medium (CM-0005; Procell, Wuhan, China). All cells were maintained at 37 °C in a humidified atmosphere containing 5% CO2.
PRTECs were isolated from 3- to 4-week-old male mice. Bilateral kidneys were harvested, and the renal cortex was minced thoroughly with surgical scissors, followed by centrifugation at 1500 rpm for 5 min. After the supernatant was discarded, type II collagenase solution (Worthington Chemical, USA) was added. The suspension was filtered through 70-μm and 40-μm cell strainers, and digestion was terminated by the addition of DMEM/F-12 (Gibco, USA) supplemented with 10% FBS (Gibco, USA). The cell suspension was centrifuged at 150 × g for 10 min, and the cell pellet was resuspended in fresh medium and cultured at 37 °C with 5% CO2.
On the day before transfection, the TCMK-1 cells were cultured to approximately 60% confluence. Targeted mouse C5ar2, Pss1, and Pss2 siRNAs (RiboBio) were transfected into cells via Dona Transfection Reagent (DN001; D-Nano Therapeutics, China) according to the manufacturer’s instructions. A nontargeting siRNA (RiboBio) was used as the negative control in parallel cultures. At 24 h post-transfection, the cells were treated with HG/HF (final concentration of 30 mM glucose and 300 μM saturated free fatty acid palmitate [16:0]) for 48 h and then harvested49. A blank group (medium only) was used as the normal control. Mannitol and bovine serum albumin (M/B) were used as osmotic controls, with the M/B group maintained at a physiological glucose concentration of 5.5 mM and supplemented with 24.5 mM mannitol to ensure osmotic balance.
To investigate the effect of P59 on HG/HF-induced damage in TCMK-1 cells, the cells were treated with HG/HF and 100 μM P59 for 48 h. To overexpress PSS2, TCMK-1 cells were infected with lentivirus (Shanghai Genechem Co., Ltd.). Puromycin selection was applied to establish a stable cell line. The overexpression of PSS2 was confirmed by western blotting analysis (Supplementary Fig. S6k).
Cell Counting Kit-8 (CCK-8) assay
TCMK-1 cells were seeded in 96-well plates at a density of 1.5 × 10³ cells/mL and subsequently treated as described above. Cell culture medium (100 μL per well) and CCK-8 reagent (CK001; LABLEAD Trading Co., Ltd., Beijing, China) were added, and the mixture was incubated at 37 °C for 2 h. Absorbance was measured at 450 nm via a microplate reader (GM3000; Promega Biotech Co., Ltd.). Each condition was performed in triplicate. The formula for determining cell viability was as follows: cell viability (%) = (experimental group/control group) × 100%. The experiment was independently repeated three times.
Histological analysis
In the kidney tissues of patients, the scoring of glomerular and tubulointerstitial lesions was consistent with the definitions used in a previous study50.
In mouse kidney tissues, twenty glomeruli from each renal section were analyzed at 200× magnification. The glomerular area was measured by tracing the periphery of the glomerular tuft. Mesangial matrix expansion was defined as the area with positive PAS staining devoid of nuclei and is expressed as a ratio of the total glomerular area. Positive staining signals were quantified via Image-Pro Plus V6.0 (Media Cybernetics, Bethesda, MD). The tubulointerstitial injury index was assessed by evaluating tubular dilatation, atrophy, and tubular cell loss. The results of the quantitative assessment of interstitial damage are consistent with the definitions used in a previous study51.
TEM and MAM analysis
Briefly, renal cortical tissues from mice were sliced into three sections and immediately immersed in precooled 3% glutaraldehyde at 4 °C for fixation. Further processing was performed at the Electron Microscopy Laboratory of Peking University First Hospital. Ultrathin sections were randomly obtained from three tissue slices from each mouse, and 15 representative nonoverlapping electron micrographs of the glomeruli were captured via a Hitachi 7700 transmission electron microscope at a magnification of ×12,000. The GBM thickness and foot process width were measured via Image-Pro Plus software V6.052,53,54.
For MAM analysis, 15 additional high-magnification (20,000×) TEM images per mouse were acquired from renal cortical regions to assess mitochondria‒ER interactions. Mitochondria in clear proximity to the ER were identified and analyzed using Amira software (Thermo Fisher Scientific). The length of the ER membrane running parallel to the mitochondrial outer membrane at a distance of less than 30 nm was measured and defined as the MAM length. The MAM contact ratio was calculated by normalizing the MAM length to the mitochondrial perimeter. All analyses were performed in a blinded manner, with at least 50 mitochondria evaluated per group.
IHC and IF
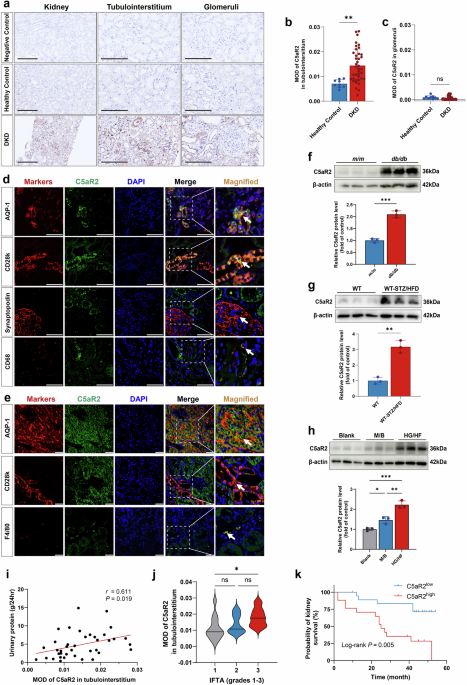
For immunohistochemical staining, paraffin-embedded kidney sections were stained with antibodies against C5aR2 (1:100; sc-515734; Santa Cruz Biotechnology), α-SMA (1:1000; ab32575; Abcam), F4/80 (1:100; MCA497; Bio-Rad), ADRP (1:200; ab52356; Abcam), TGF-β (1:200; ab170874; Abcam), PSS1 (1:200; ab157222; Abcam), and PSS2 (1:200; ARP49961_P050; Aviva Systems Biology Corporation). Ten nonoverlapping fields per kidney section were captured at 200× magnification for systematic quantification. Protein expression levels were determined by measuring either the integrated optical density (IOD) or the mean optical density (MOD = IOD/area) using Image-Pro Plus 6.0 software. For immunofluorescence colocalization studies, kidney sections were simultaneously probed with: (1) anti-C5aR2 (1:100; sc-515734; Santa Cruz Biotechnology), (2) the proximal tubule marker AQP-1 (1:200; ab168387; Abcam; a marker for PTECs), and (3) the distal tubule marker calbindin-D28K (1:100; 14479-1-AP; Proteintech; a marker for distal renal tubular epithelial cells). The samples were subsequently incubated with the species-matched fluorescent secondary antibodies Alexa Fluor 488-conjugated goat anti-mouse IgG (1:200; A32723; Invitrogen) and Alexa Fluor 594-conjugated donkey anti-rabbit IgG (1:200; A21207; Invitrogen). The nuclei were counterstained with 4’,6-diamidino-2-phenylindole (DAPI) before imaging.
Live-cell confocal microscopy and analysis
To visualize and quantify MAM formation in live cells, we performed high-resolution confocal microscopy followed by three-dimensional analysis. In brief, TCMK-1 cells were transfected with a sec61β-GFP plasmid to fluorescently label the ER. At 24 h post-transfection, the mitochondria were stained with Mito Orange (PKMO-1; Genvivo Biotechnology Co., Ltd., Nanjing, China) for 15 min. Live-cell imaging was immediately carried out using a Leica STELLARIS confocal microscope (Leica Microsystems, Germany) equipped with an environmental chamber maintained at 37 °C and 5% CO₂.
Z-stack images were acquired at 0.35-μm intervals throughout the entire cell volume. Three-dimensional visualization, colocalization analysis, and orthogonal projections were performed using Imaris 10.2 software (Oxford Instruments). The extent of ER–mitochondria colocalization was quantitatively assessed by calculating Pearson’s correlation coefficient between the green (ER) and red (mitochondria) channels to enable direct morphological assessment of ER–mitochondria contact sites.
Western blotting assay
Total protein was extracted from cultured TCMK-1 cells or mouse kidney tissues via radioimmunoprecipitation assay (RIPA) buffer (32010A; Bestbio, Shanghai, Co., Ltd.) or by isolation of organelles. The samples were separated on a 10% SDS-PAGE gel and transferred to PVDF membranes. The membranes were blocked with 5% skim milk and then incubated with primary antibodies against C5aR2 (sc-515734; Santa Cruz Biotechnology), PSS1 (ab157222; Abcam), PSS2 (ARP49961_P050; Aviva Systems Biology Corporation), MFN2 (12186-1-AP; Proteintech), XBP-1s (143F; BioLegend), p-EIF2α (28740-1-AP; Proteintech), EIF2α (11170-1-AP; Proteintech), CHOP (15204-1-AP; Proteintech), COX IV (11242-1-AP; Proteintech), calnexin (10427-2-AP; Proteintech), ERK1/2 (4695; Cell Signaling Technology), p-ERK1/2 (4370; Cell Signaling Technology), HA (ab9110, Abcam), FLAG (ab213519, Abcam), α-tubulin (HRP-80762; Proteintech), and β-actin (Ac028; ABclonal). The membranes were subsequently incubated with HRP-conjugated secondary antibodies (SA00001; Proteintech). Proteins were visualized via an ECL Chemiluminescent Substrate Kit (WBKLS0500, Millipore) and quantified via ImageJ software with the Fiji plugin (NIH, Bethesda, MD, USA).
qRT-PCR analysis
Total RNA was extracted from cells or mouse kidney tissues via the SteadyPure Quick RNA Extraction Kit (AG21023; Accurate Biotechnology, Hunan, Co., Ltd.). Two micrograms of RNA were reverse transcribed into cDNA via the PrimeScript RT Reagent Kit (RR037A; Takara Biomedical Technology, Beijing, Co., Ltd.). qRT-PCR analysis was performed using SYBR Green Master Mix (A25742; Applied Biosystems; Thermo Fisher Scientific) with 2 μL of cDNA and forward and reverse primers. Relative gene expression was calculated after normalization to 18S rRNA and compared to that of control samples. The primers used for the qRT-PCR assays are listed in Supplementary Table S7.
Protein docking analysis
Protein docking analysis was performed using the ZDOCK 3.0 program. All docking analyses were based on experimentally determined structural fragments retrieved from the Protein Data Bank (PDB) database: MFN2 (PDB ID: 6JFK, GTPase domain fragment), PSS1 (PDB ID: 9B4F, catalytic core region fragment), and PSS2 (PDB ID: 9N0X, catalytic core region fragment).
Co-IP
Co-IP was performed using the Pierce Crosslinking Magnetic Co-IP Kit (88805; Thermo Fisher Scientific). For endogenous protein interaction analysis, TCMK-1 cells were lysed, and 500 μg of protein was incubated with anti-FLAG, anti-MFN2, or anti-IgG antibodies on magnetic beads overnight at 4 °C. For MFN2 truncation mutant binding assays, HEK293T cells were co-transfected with FLAG-tagged MFN2 (full-length or truncation mutants) and HA-tagged PSS1 or PSS2 plasmids. At 48 h post-transfection, the cells were lysed and immunoprecipitated using anti-FLAG or anti-HA antibodies. The beads were subsequently washed, eluted with low-pH buffer, and heated at 95 °C with 5× SDS-PAGE sample loading buffer. Protein samples were separated via 10% SDS-PAGE and analyzed by Western blotting assay.
ChIP assay
The ChIP assay was performed via the SimpleChIP Enzymatic Chromatin IP Kit (9003S; Cell Signaling Technology). Briefly, TCMK-1 cells were harvested via a cell scraper after 20 min of incubation in cold lysis buffer. DNA was immunoprecipitated from sonicated cell lysates via an anti-c-FOS antibody (2250; Cell Signaling Technology). The promoter-specific primers for mouse Pss2 used in subsequent PCR amplification are listed in Supplementary Table S7.
Transcription factor prediction and dual-luciferase reporter assays
The prediction of c-FOS as a transcription factor of Pss1 and Pss2 was completed at the University of California, Santa Cruz (UCSC; https://genome.ucsc.edu/) Genome Browser Home. Mouse Pss1 and Pss2 promoters (spanning −2000 to +100 bp) or their variants were subsequently synthesized, cloned, and inserted into the GV238 vector (Shanghai Genechem Co., Ltd.). To detect the promoter activity of the Pss1 and Pss2 plasmids, the reporter plasmid and CV702-c-Fos plasmid were transfected into TCMK-1 cells in 12-well plates for 24 h via Lipofectamine 3000. Dual-luciferase reporter assays were performed via the Luc-Pair Duo-Luciferase HS Assay Kit (Promega Biotech Co., Ltd.) according to the manufacturer’s instructions. Firefly luciferase activity was normalized to Renilla luciferase activity for each sample.
Analysis of lipid deposition
For Nile Red staining, the cells were processed as described above. The cells in the 24-well plates were fixed with 4% paraformaldehyde for 10 min, rinsed twice with PBS, and stained with Nile Red (0.1 μg/mL; HY-D0718; MedChemExpress) for 30 min. The coverslips were sealed with anti-fade mounting medium containing DAPI, and the samples were observed and photographed via a fluorescence inverted microscope. Image-Pro Plus software V.6.0 was used to evaluate the positive staining of lipids. Positive signals were normalized to the total number of nuclei (DAPI) counted per well. The Nile Red staining conditions for frozen mouse kidney samples were identical to those described above for cell staining. Positive signals were normalized to the total tissue area of each image.
The Oil Red O staining procedure followed the instructions of the Oil Red O Staining Kit (G1261; Beyotime Biotechnology). The cells were stained with Oil Red O working solution for 20 min, after which the nuclei were counterstained with hematoxylin staining solution. The samples were then observed and photographed under a microscope. Image-Pro Plus software V.6.0 was used to evaluate the positive staining of lipids. Positive signals were normalized to the total number of nuclei (stained with hematoxylin) counted per well. The Oil Red O staining conditions for frozen mouse kidney samples were identical to those described above for cell staining. Positive signals were normalized to the total tissue area of each image.
Cell fraction isolation
Subcellular isolation was performed on freshly isolated mouse kidney tissues as previously described55. Briefly, the tissues were finely minced and homogenized in Buffer 1 (225 mM mannitol, 75 mM sucrose, 0.5% BSA, 0.5 mM EGTA, and 30 mM Tris-HCl, pH 7.4) via a Dounce homogenizer. The homogenate was subsequently centrifuged at 740× g for 5 min at 4 °C. The supernatant was further centrifuged at 9000× g for 10 min to obtain a crude mitochondrial pellet from the ER-enriched supernatant. The supernatant was reserved for ER isolation, while the crude mitochondrial pellet was resuspended in Buffer 2 (225 mM mannitol, 75 mM sucrose, 0.5% BSA, and 30 mM Tris-HCl; pH 7.4) and centrifuged at 10,000× g for 10 min at 4 °C.
The resulting pellet was resuspended in Buffer 3 (225 mM mannitol, 75 mM sucrose, and 30 mM Tris-HCl, pH 7.4) and centrifuged again at 10,000× g for 10 min at 4 °C. The crude mitochondrial pellet was resuspended in mitochondrial resuspension buffer (MRB; 250 mM mannitol, 5 mM HEPES, pH 7.4, and 0.5 mM EGTA).
For MAM isolation, the crude mitochondrial fraction was subjected to ultracentrifugation at 95,000× g for 30 min at 4 °C in Percoll medium (225 mM mannitol, 25 mM HEPES, pH 7.4, 1 mM EGTA, and 30% (vol/vol) Percoll). The MAM layer and mitochondrial pellet were carefully collected and resuspended in MRB.
The MAM and mitochondrial suspensions were centrifuged at 6300× g for 10 min at 4 °C. The supernatant was then centrifuged at 20,000× g for 30 min at 4 °C, followed by ultracentrifugation at 100,000× g for 1 h at 4 °C. The isolated subcellular fractions were resuspended in lysis buffer supplemented with protease and phosphatase inhibitors. Proteins were resolved by 10% SDS-PAGE and analyzed by immunoblotting.
In situ PLA
The protein‒protein interactions were analyzed using Duolink PLA (Sigma-Aldrich; DUO92002/4) according to standard protocols. In brief, cells were seeded on 6-mm coverslips in 48-well plates, washed with PBS, and fixed with 4% paraformaldehyde. Following blocking, primary antibody incubation was carried out at 4 °C overnight. After washing, species-matched PLA probes were applied. Subsequent ligation and amplification reactions were conducted according to the manufacturer’s guidelines, with final mounting in Duolink medium with DAPI nuclear stain (DUO82040; Sigma-Aldrich). Fluorescence signals were captured using an inverted fluorescence microscope system.
The primary antibodies used included mouse anti-VDAC1 (1:100; 66345-1-Ig; Proteintech), rabbit monoclonal anti-IP3R1 (1:100; 19962-1-AP; Proteintech), mouse anti-FLAG (1:100; 66008-4-Ig; Proteintech), and rabbit anti-MFN2 (1:100; 12186-1-AP; Proteintech). The fluorescence signals were quantified via Image-Pro Plus software V.6.0.
Quantification of PS
To quantify the PS levels in the isolated MAM fraction, we used a PS assay kit (ab273295; Abcam). This assay is based on an enzymatic reaction in which PS is hydrolyzed to produce phosphatidic acid and L-serine. The released L-serine reacts with a specific probe to generate a stable fluorophore. The assay was performed according to the manufacturer’s instructions.
Mitochondrial OCR measurement
The mitochondrial OCR was measured via a Seahorse XF96 analyzer (Agilent Technologies). After the cells were seeded in XF96 microplates and cultured overnight, experimental treatments were applied. Before the OCR was measured, the cells were washed with PBS and equilibrated for 1 h in prewarmed (37 °C) XF assay medium (102353-100; Agilent Technologies) supplemented with 1× GlutaMAX (Gibco, 35050), 1 mM sodium pyruvate (Sigma‒Aldrich, S8636), and 25 mM glucose (Sigma‒Aldrich, G7528), with the pH adjusted to 7.4. The sensor cartridge, prehydrated in XF calibrant, was loaded with mitochondrial modulators at the following specified concentrations: 1 μM oligomycin (103595-100; Agilent Technologies), 1 μM FCCP (103595-100; Agilent Technologies), 0.5 μM rotenone (103595-100; Agilent Technologies), and 0.5 μM antimycin A (103595-100; Agilent Technologies). Post-assay normalization was performed using DAPI nuclear staining to correlate the OCR with the cell count. Data acquisition and analysis were conducted using Seahorse Wave software.
RNA-seq analysis
Total RNA was extracted from mouse renal cortex tissue via the SteadyPure Quick RNA Extraction Kit (AG21023; Accurate Biotechnology, Hunan, China). RNA integrity was assessed via a 2100 Bioanalyzer (Agilent Technologies), and only samples with an RNA integrity number (RIN) ≥ 7 were selected for downstream analysis. Transcriptome sequencing and subsequent bioinformatic analysis were performed by OE Biotechnology, Inc. Libraries were constructed via the TruSeq Stranded mRNA LT Sample Prep Kit (Illumina) following the manufacturer’s protocol and sequenced on an Illumina HiSeq 2500 platform, generating paired-end reads of 125 bp or 150 bp.
The raw count matrix was normalized via DESeq2 (version 1.32.0) to identify DEGs. Significantly DEGs were defined as those with P < 0.05 and an absolute log2-transformed fold change > 1. GSEA was performed to identify significant pathways, with the normalized enrichment score (NES) and false discovery rate (FDR) used as key metrics.
Lipidomic analysis
Total lipids were extracted from mouse renal cortex tissue via a previously modified method5. The samples were immediately sealed, flash-frozen, and stored at −80 °C until lipid extraction. Lipid profiling was performed by OE Biotech Co., Ltd., via liquid chromatography‒tandem mass spectrometry (LC‒MS/MS). Data acquisition was conducted on a Q Exactive Orbitrap mass spectrometer coupled with an UltiMate 3000 ultra-performance liquid chromatography system (Thermo Fisher Scientific). Lipid identification and quantification were performed via LipidSearch software (version 4.1.16; Thermo Fisher Scientific).
KEGG enrichment analysis was performed on the basis of the terms in the KEGG database, with significant results filtered according to the following criteria: P < 0.05 and an absolute log2-transformed fold change > 1. LION analysis was performed via the LINT-web platform (Fudan University, Shanghai, China). LION analysis was used to compare significantly altered lipids to the total lipid set to identify enriched LION terms, with significance thresholds set at P < 0.05 and an absolute log2-transformed fold change >1. The lipidome dataset was subjected to heatmap analysis for visualization of lipid species, and box-whisker plots were generated to summarize lipid class distributions.
scRNA-seq analysis
Unique molecular identifier (UMI) count matrices were processed with the Seurat R package (version 4.0.0)56. Following the preliminary filtering by Cell Ranger, additional stringent quality control was applied to exclude potential low-quality or artifactual cells. Specifically, cells were removed if they met any of the following criteria: (1) < 114 detected genes, (2) < 500 UMIs, (3) mitochondrial UMI counts exceeding four times the median mitochondrial content across all cells, or (4) hemoglobin gene proportion > 5%. The DoubletFinder package (version 2.0.3) was employed to identify singlets for downstream analyses57. The gene expression values were subsequently normalized via the normalizeData function.
The top 2000 highly variable genes were calculated via the Seurat function FindVariableGenes, and data scaling was performed with ScaleData. Principal component analysis (PCA) was conducted to reduce dimensionality via the RunPCA function. The true dimensionality of the data was estimated via ElbowPlot, DimHeatmap, and JackStrawPlot. Cell clustering was then performed via FindNeighbors and FindClusters, followed by visualization via UMAP with the RunUMAP function. The full Seurat workflow used in this study is consistent with the official tutorial (https://satijalab.org/seurat/articles/pbmc3k_tutorial.html). The sequencing and bioinformatic analyses were performed by OE Biotech Co., Ltd. (Shanghai, China).
Cell type annotation and cluster marker identification
Following nonlinear dimensionality reduction via UMAP, the cells were projected into a two-dimensional space and grouped on the basis of shared transcriptional profiles. To identify characteristic genes for each cluster, the FindAllMarkers function from Seurat was employed. Cluster annotation was then performed by evaluating the expression patterns of established canonical markers corresponding to known cell types. For PTEC subpopulation classification, we implemented a refined stratification system in which healthy S1/2 segments were defined by elevated expression of segment-specific markers, including solute carrier family 5 member 12 (Slc5a12) and solute carrier family 34 member 1 (Slc34a1), combined with minimal expression of injury-associated genes. Injured S1/2 segments maintained their segmental identity markers (Slc5a12 and Slc34a1), with moderately increased injury-related gene expression. Injured S3 segments demonstrated characteristic solute carrier family 22 member 6 (Slc22a6) expression with elevated injury marker levels. The failed-repair PT cell population was characterized by diminished segment-specific transporter expression, accompanied by persistently high expression of injury response genes, including doublecortin domain-containing 2A (Dcdc2a) and proliferation markers such as the proliferation marker Ki-67 (Mki67)58,59. To assess gene expression patterns across clusters, average expression levels were calculated via the average expression function. DEGs were screened via the FindMarkers function (test.use = wilcox). A P value < 0.05 and a |log2fold change| > 0.58 were set as the thresholds for significant differential expression. GO enrichment analysis of the DEGs was performed via R software (version 4.0.3) on the basis of the hypergeometric distribution.
Reagents, antibodies, and primers
Detailed information regarding all antibodies and primers used in this study is provided in Supplementary Tables S7 and S8.
Statistical analysis
The statistical methods, tools, and significance thresholds for each analysis are specified in the corresponding figure legends. Normally distributed continuous variables are expressed as the mean ± standard deviation (SD), and nonnormally distributed continuous variables are presented as the median (interquartile range, IQR). Categorical variables are presented as absolute counts and percentages. Statistical comparisons included chi-square tests for categorical data, unpaired Student’s t-tests for normally distributed continuous variables in two-group comparisons, and Mann‒Whitney U tests for nonnormally distributed continuous variables. Multiple group comparisons were analyzed via one-way analysis of variance (ANOVA) with Tukey’s post hoc tests. Statistical significance was defined as P < 0.05 (*), P < 0.01 (**), P < 0.001 (***), and P < 0.0001 (****). All analyses were performed via SPSS (version 26.0; IBM Corp., Armonk, NY), R (version 4.4.3; R Development Core Team, Vienna, Austria), and GraphPad Prism (version 10.0; GraphPad Software, San Diego, CA).