
Screening of DEGs in AMI
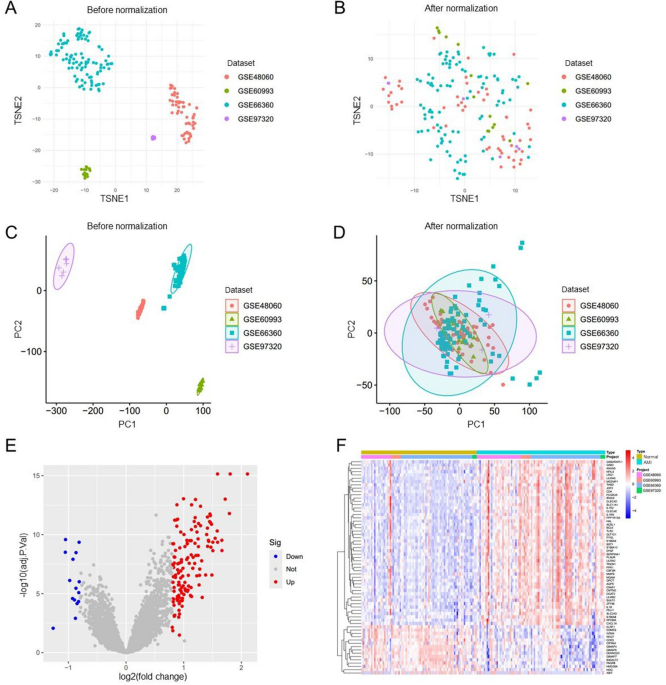
Following the standardization of the original data from the four data sets, t-SNE and PCA mappings were created, demonstrating that batch differences were effectively eliminated and the data remained stable (Fig. 1A-D). Next, the DEGs within the training cohort were analyzed utilizing the limma package after addressing batch effects. In comparison to the control group, 157 genes showed significant expression changes in the AMI patients group, featuring 142 genes up-regulated and 15 down-regulated. These DEGs were then represented in both a volcano plot and a cluster heatmap (Fig. 1E, F).

Normalization of the dataset and analysis of differential gene expression. (A-D) Normalization and batch effect correction in four microarray datasets GSE48060, GSE60993, GSE66360, and GSE97320. (E, F) Volcano map of differentially expressed genes (DEGs) after screening (adjusted p < 0.05 and |log2FC|>0.8) (E) and cluster heatmap of DEGs (F) between acute myocardial infarction (AMI) and control samples using the merged dataset (AMI = 90, control = 81) derived from GSE48060, GSE60993, GSE66360, and GSE97320.
Identification of differentially expressed obesity-related genes and enrichment analysis
The overlap of 157 genes with differential expression and those associated with human obesity indicated the identification of 18 differentially expressed obesity-related genes (DE-ORGs), which include IL1RN, SERPINA1, TLR2, NFKBIA, PYGL, IL1B, MMP9, DGAT2, TLR4, NLRP3, ITLN1, CEBPB, CD163, ALDH2, STEAP4, IRS2, SLC7A7, and PTGS2 (Fig. 2A). The heatmap indicated that these 18 genes formed a cluster characterized by elevated expression in AMI samples while exhibiting lower expression in control samples, as evaluated using the training database (Fig. 2B). To further explore the pathophysiological roles of these DE-ORGs, enrichment analyses were conducted using clusterProfiler, involving Gene Ontology (GO), Kyoto Encyclopedia of Genes and Genomes (KEGG), and Disease Ontology (DO). The GO analysis showed that the DE-ORGs were predominantly implicated in the response to lipopolysaccharide, inflammatory responses, and membrane rafts (Fig. 2C). KEGG analysis revealed that these DE-ORGs participated in various signaling pathways, such as those related to lipids and atherosclerosis, the IL-17 signaling pathway, and the TNF signaling pathway. Moreover, they also played roles in the NF-kappa B signaling pathway and toll-like receptor signaling pathway (Fig. 2D). Additionally, the DO analysis indicated that the 18 DE-ORGs were primarily enriched in conditions such as pancreatitis, fatty liver disease, and lipid storage disease (Fig. 2E). Considering the strong association between pancreatitis, lipid metabolism disorders, and cardiovascular disease31,32,33, these findings underscored a significant link between DE-ORGs and AMI, emphasizing that DE-ORGs primarily regulate inflammatory responses and lipid storage.

Differentially expressed obesity-related genes (DE-ORGs) and functional enrichment. (A) Identification of 18 DE-ORGs by overlapping the 157 differentially expressed genes with 1556 obesity-related genes. (B) Expression heatmap of 18 DE-ORGs in AMI patients and controls. (C) GO enrichment analysis of DE-ORGs. (D) KEGG enrichment analysis of DE-ORGs. (E) DO enrichment analysis of DE-ORGs.
Diagnostic features biomarkers were determined by machine learning
A total of three machine learning algorithms were utilized to identify diagnostic signature biomarkers within the 18 DE-ORGs mentioned above. By applying LASSO analysis, we discovered 9 feature genes: IL1RN, SERPINA1, TLR2, NFKBIA, IL1B, MMP9, ITLN1, ALDH2, and PTGS2 (Fig. 3A, B). Support vector machine (SVM) is supervised machine learning method widely used for classification and regression tasks. To mitigate the risk of overfitting, a recursive feature elimination (RFE) algorithm was employed to extract the most relevant genes from the meta-data cohort. Subsequently, SVM-RFE was utilized to identify the features with the highest discriminative power. The SVM-RFE algorithm indicated that the model’s prediction error was minimized when n = 16, enhancing its predictive capacity (Fig. 3C, D). Consequently, we identified sixteen feature genes including IL1B, ITLN1, NFKBIA, PTGS2, MMP9, TLR2, IL1RN, ALDH2, SLC7A7, CEBPB, TLR4, IRS2, CD163, PYGL, NLRP3, and DGAT2. Random forest analysis revealed that the model reached a stable state at ntree = 500 (Fig. 3E). Following this, we selected genes with importance scores exceeding 5, leading us to eight genes: MMP9, SERPINA1, IL1RN, TLR2, IRS2, NFKBIA, ITLN1, and DGAT2 (Fig. 3F). Finally, we intersected the findings of the three machine learning algorithms (Fig. 3G), resulting in the identification of five key genes: IL1RN, TLR2, NFKBIA, MMP9, and ITLN1. The distribution of these genes among differentially expressed genes is depicted in Fig. 3H. An analysis of protein-protein interactions suggests that these selected candidate genes can create an interaction network that revolves around IL1RN (Fig. 3I).

Identification of diagnostic signature genes. (A, B) The variation curve of regression coefficient (A) and root mean square (RMS) error (B) as a function of Log (λ) in Lasso regression. (C, D) The results of support vector machine-recursive feature elimination (SVM-RFE) algorithm, with the broken line chart showing the number of genes corresponding to the lowest error rate (C) and the highest accuracy (D) for AMI. (E) Identification of the AMI-specific genes using random forest approach, illustrating the impact of the number decision trees on the error rate; the x-axis represents the number of decision trees, while the y-axis denotes the error rate. (F) The most importance genes selected by random forest, with the x-axis indicating the importance index and the y-axis listing the genes. (G) Venn diagram of five candidate genes. (H) Distribution of five candidate genes in a volcano map of differentially expressed genes (DEGs) between AMI and control samples. (I) Protein-protein interaction network based on candidate genes.
Obesity-related genes model for diagnosis of AMI and validation
The five identified genes were utilized to develop a diagnostic model employing a binary logistic regression algorithm within the training cohort. The feature value is calculated using the formula: feature value = -23.3899 + 1.3338 * IL1RN + 0.4214 * TLR2 + 0.6228 * NFKBIA + 0.3462 * MMP9 + 0.6269 * ITLN1. The ROC curve generated from the diagnostic model for acute myocardial infarction (AMI) was employed to assess the model’s diagnostic performance. The results indicated that the area under the curve (AUC) for this model was 0.924 in the training dataset and 0.825 in the validation dataset, reflecting a high level of diagnostic accuracy (Fig. 4A, B). Subsequently, a nomogram was developed utilizing the “rms” package to forecast the occurrence of AMI, incorporating IL1RN, TLR2, NFKBIA, MMP9, and ITLN1. The “Points” were illustrated independently as scores for the five key DE-ORGs, while the “Total Points” represented the cumulative score of these DE-ORGs (Fig. 4C). To evaluate the nomogram’s predictive performance, the AUC was utilized, demonstrating superior predictive accuracy when compared to the five previously mentioned DE-ORGs (Fig. 4D and Supplementary Figure S1A-E). The calibration curve revealed a minimal discrepancy between the actual and predicted incidences of AMI (Fig. 4E). Additionally, the Decision Curve Analysis (DCA) illustrated that the diagnostic model performs effectively, yielding significant net benefits (Fig. 4F). Lastly, we assessed the expression levels of IL1RN, TLR2, NFKBIA, MMP9, and ITLN1 in both AMI and healthy controls using the validation dataset GSE59876. Notable alterations were observed in the expression of IL1RN, TLR2, NFKBIA, and MMP9 between the AMI and control cohorts, whereas ITLN1 did not show significant variation (Fig. 4G). RT-qPCR was conducted to further validate the expression levels of the diagnostic biomarkers, and the findings confirmed that the expression levels of IL1RN, TLR2, NFKBIA, MMP9, and ITLN1 were in agreement with those of the training sets (Fig. 4H and Supplementary Figure S1F-J).

Development and validation of a diagnostic model for predicting AMI. (A, B) ROC curves for the diagnostic model in both the training cohort (A) and the validation cohort (B). (C) Nomogram designed for predicting AMI within the training cohort. (D) The ROC curves of the diagnostic model, revealing AUC of 0.933 for the training set and 0.882 for the testing set. (E, F) Calibration curve (E) and DCA curve (F) of the nomogram model in the training cohort. (G) Validation of the expression of diagnostic biomarkers using the GSE59867 dataset (AMI = 111, control = 49). (H) Diagnostic biomarkers validated in peripheral blood samples from AMI patients (n = 5) and controls (n = 5) through RT-qPCR.
Correlation analysis between immune cells and high-risk and low-risk populations
The samples in the training dataset were categorized into low-risk (n = 85) and high-risk (n = 86) groups based on the median feature value obtained from the diagnostic model. A total of six immune cell subsets exhibited distinct infiltration patterns between these two groups, including resting memory CD4 T cells, gamma delta T cells, resting NK cells, monocytes, activated mast cell, and neutrophils (Fig. 5A). The heatmap depicting differential immune cell expression was generated using the “pheatmap” package in R (Supplementary Figure S2A). The relationship between immune cells and genes of the diagnostic model was assessed across different risk groups. The genes IL1RN, TLR2, NFKBIA, and MMP9 demonstrated a significant positive correlation with neutrophils in both risk categories. Additionally, genes IL1RN, TLR2, and NFKBIA exhibited positive correlations with activated mast cells, while IL1RN, TLR2, NFKBIA, and MMP9 revealed a notable negative correlation with memory resting CD4 T cells and gamma delta T cells within the high-risk group (Supplementary Figure S2B, C). Moreover, a significant variance was detected among thirteen immune functions, the most pronounced of which was related to CCR, CD8 + T cells, cytolytic activity, macrophages, MHC class I, neutrophils, NK cells, parainflammation, T cell co-inhibition, T cell co-stimulation, Th1 cells, Th2 cells, and tumor-infiltrating lymphocytes (TIL) (Fig. 5B). The correlation analysis between diagnostic marker genes and immune function categories was performed using the Spearman method. In the high-risk group, IL1RN and TLR2 displayed a notably positive correlation with macrophages and immature dendritic cells (iDCs), while showing a significant negative correlation with T cell co-stimulation, Th2 cells, Th1 cells, helper T cells, checkpoints, and type II interferon (IFN) responses (Fig. 5C, D). Additionally, the findings from the GSEA enrichment analysis revealed that the high-risk group showed significant enrichment in pathways such as chemokine signaling, FC-gamma-R-mediated phagocytosis, leishmania infection, and Toll-like receptor signaling, while ribosome enrichment was most pronounced in the low-risk group (Fig. 5E). This observation implies that these immune functions could play crucial roles during key moments in the pathophysiology of AMI.

Correlation of immune cells and immune functions with high- and low-risk groups. (A, B) Differential analysis of immune cell infiltration (A) and 29 immune functions (B) across these groups. (C, D) Heatmap of the correlation between diagnostic genes and 29 immune functions in the low-risk group (C) and the high-risk group (D). (E) GSEA results for the pathways in the high-risk group. ** p < 0.01, *** p < 0.001; ns, no significant.