
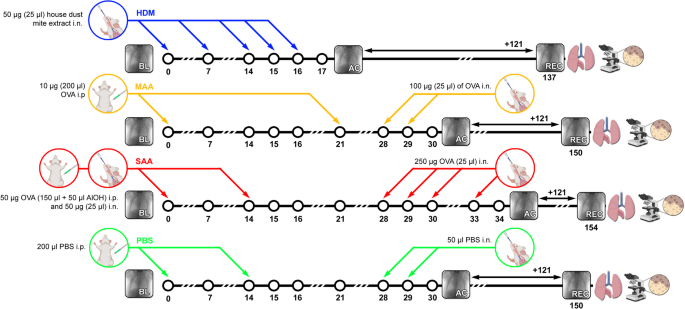
To compare the long-term effects of different mouse models of allergic inflammation, we assessed the lung function of untreated (healthy), vehicle treated (PBS) and the different allergen treated (SAA, MAA, HDM) mice directly after challenge (acute allergic phase, ac), then let the mice recover for about 4 months before measuring lung function again (recovered phase, rec) (Fig. 1).
XLF analysis reveals long-term decay in lung function of SAA and HDM mouse models
X-ray-based lung function (XLF), a simple non-invasive low-dose 2D cinematic x-ray imaging procedure was performed to assess lung function (Fig. 2). In XLF imaging, the average X-ray attenuation over the chest area is continuously monitored, reflecting the respiratory cycle of the mouse. During the expiratory phase, particularly the descending limb of each breathing event, a quadratic exponential decay function is fitted to quantify the rate of lung deflation, defined as the decay rate. When compared to healthy mice, XLF showed a reduced decay rates for both SAA and HDM at the acute phase and to similar degrees, albeit non-significant (Fig. 3). Interestingly, also the PBS treated group showed a small reduction in the decay rate (Fig. 3). MAA—the mild OVA induced allergic airway inflammation model—showed no significantly different decay rate compared to the control group at the acute AAI stage.

Quantitative comparison of the calculated decay rate in the fitted quadratic decay functions, measured by XLF. The acute asthmatic mice, particularly those in the SAA-ac group, exhibited a reduction in the time constant, indicating a prolonged expiration phase, and were significantly different to the MAA-ac mice. No significant differences were observed between the decay rates of HDM-ac and SAA-ac groups. The PBS-ac group also demonstrated a slightly reduced decay rate. During the recovery phase, SAA-rec mice showed a significant reduction in the decay rate, though the decrease was less pronounced compared to the acute phase. p-value definitions: ** < 0.01; *** < 0.001; **** < 0.0001.
When comparing the decay rates (Fig. 3) between the recovered phase (121 days after the last challenge) with the acute phase (≈ 48 h after the last challenge), SAA shows a smaller but still significant reduction in the decay when compared with the healthy controls. The HDM model has “recovered” and is not different to healthy controls. At the recovered phase, the PBS treated group had regained the same decay rate like the control group.
Diaphragm motion analysis reveals significant long-term effects on lung volume of HDM mice
Diaphragm motion analysis (DMA) was performed by calculating the average and standard deviation over time from the acquired XLF movies (Fig. 4), allowing for the measurement of the lung area during expiration as well as the traveling range of the diaphragm. In agreement with our earlier results10, diaphragm motion distance (sdia), as measured from the standard deviation images, was not significantly different between acute SAA-ac and control groups (healthy-ac and PBS-ac) (Fig. 5A). However, the acute HDM-ac model exhibited greater diaphragm motion distances than all other groups (Fig. 5A). Moreover, even after 121 days of recovery, HDM-rec mice demonstrated significantly increased diaphragm movement than healthy-rec mice or any other AAI models. While most of the breathing motion was driven by diaphragm movement, activation of the intercostal muscles was also observed, visible by higher standard deviation of the x-ray attenuation along the side of the ribs, (Fig. 4, arrow heads), suggesting a partially forced expiration pattern. This was the case particularly in the acute phase of all asthma models, but also persisting long-term in the HDM-rec model.
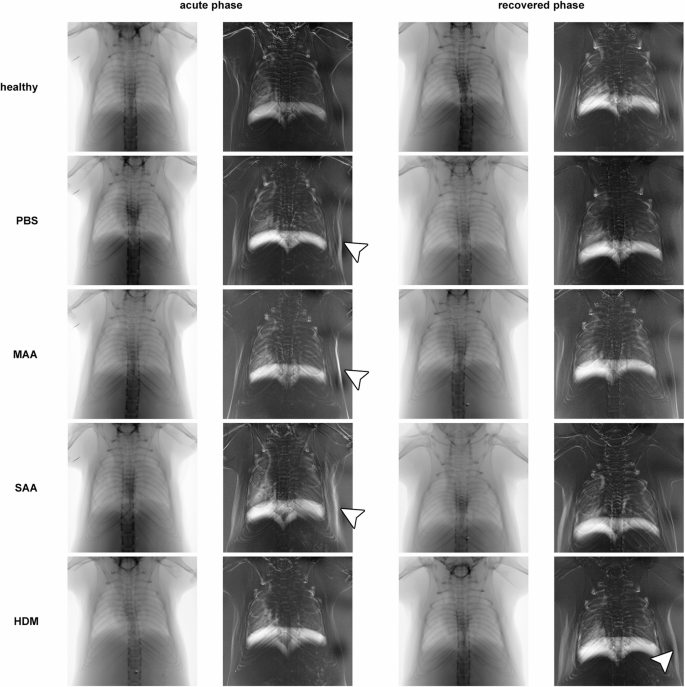
Representative diaphragm motion analysis in acute and recovered phase in different AAI mouse models. From the low-dose 2D cinematic X-ray acquisitions, both the average and the standard deviation over time were calculated. Due to the longer expiration phases compared to inspiration phases under isoflurane anesthesia, the averaged images predominantly capture the lung shape during expiration. The standard deviation images highlight areas of the mouse that moved. While most of the breathing motion was driven by diaphragm movement, particularly in the acute phase of the asthma models, activation of the intercostal muscles was also observed (arrow heads), suggesting a forced expiration pattern. Interestingly, this same effect was seen in the PBS-treated mice, indicating ongoing acute lung inflammation. In the recovery phase, this behavior was less pronounced. Lung area during expiration (ALung) and the average width of the diaphragm’s traveling range (sdia) were quantified.

DMA reveals significant but different long-term changes in the lung area and diaphragm motion for the three AAI models in acute (ac) and recovered (rec) phase. (A) Extent of diaphragm motion calculated as width of the diaphragm traveling range in the standard deviation of the XLF movies (sdia). (B) Lung area calculated from XLF movies, indicative of the lung volume at exhalation. p-value definitions: * < 0.05; ** < 0.01; *** < 0.001; **** < 0.0001.
In terms of changes in lung area, DMA revealed significant long-term differences among the three AAI models. The lung area measured by this method reflects the area during exhalation and is indicative of lung volume at this breathing state. In the acute phase of AAI, SAA-ac showed a significantly larger lung area than the controls (healthy-ac and PBS-ac, Fig. 4 and Fig. 5), consistent with our earlier DMA results for this AAI model10. MAA-ac and HDM-ac did not show significant differences in lung area when compared to the controls. After 121 days of recovery, lung area in the SAA-rec mice returned to levels similar to the controls. Surprisingly, however, lung area during exhalation at this time point was significantly lower in HDM-rec mice compared to healthy-rec mice.
Since the lung area during expiration serves as a surrogate marker for diaphragm position—reflecting an equilibrium between the respiratory muscles and the elastic recoil of the lung—it can be speculated that in HDM-rec mice, the lung tissue has become stiffer, while in the SAA-rec mice, the tissue remains less elastic.
Histology confirms differential long-term tissue remodeling in dependence of the AAI model
Following sacrifice of the mice after a 121-day recovery period from the acute antigen challenge, we performed a panel of histological stainings of lung paraffin sections in an attempt to explain the differences in lung function and diaphragm motion that we observed between the OVA and HDM models and correlate the data to morphological alterations. PAS staining showed that none of the lungs of any group contained mucus or hyperplasia of goblet cells, confirming the resolution of the acute inflammation 121 days after the last challenge (data not shown). Furthermore, BAL analysis showed that none of the lung lavages from any of the examined groups contained eosinophils, which typically increase during the acute phase of the allergic reaction (Suppl.Fig. S1).
Masson trichrome staining (MTS) was performed to evaluate the amount of fibrosis-related collagen at the recovered time point. The results displayed a tendency towards a higher amount of collagen in the lungs of the SAA-rec and HDM-rec groups when compared to controls (healthy-rec and PBS-rec) and to the weaker OVA-induced AAI model MAA-rec, but did not reach significance (Fig. 6A, D).

Histology reveals different effect on long-term tissue remodeling in dependence of the AAI model used. Stainings were performed on lung paraffin sections of the 3 AAI models SAA, MAA and HDM, as well as the controls healthy and PBS, at 121 days after the last antigen challenge (rec for recovered). (A) Amount of collagen determined by MT score. (B) Elastin expression determined as the ratio of elastin fibers per lung area. (C) αSMA expression determined as ratio of αSMA positive area to bronchial area. (D) Representative images of MTS-stained tissue sections from a healthy-rec and a SAA-rec lung lobe, showing a higher collagen amount (blue staining) in SAA-rec than in healthy-rec. (E) Representative images of sections from a healthy-rec and a SAA-rec lung lobe stained with an anti-αSMA antibody (brown staining, arrows), showing decreased expression of αSMA around bronchioles in the SAA-rec lung section compared to healthy-rec controls. p-value definitions: * < 0.05; ** < 0.01; *** < 0.001; **** < 0,0001.
Staining of elastin fibers, revealed significantly reduced amounts in SAA-rec lungs compared to healthy-rec controls (Fig. 6B), confirming our earlier findings10 and suggesting that the severe OVA-induced AAI leads to a persistent loss of elasticity of the lung, even at 121 days of recovery from the acute inflammation. The weak OVA model MAA-rec and the HDM-rec model did not show any long-term difference in elastic fibers when compared to controls (Fig. 6B).
Anti-αSMA staining also confirmed our earlier findings with the severe OVA model SAA-rec10, showing that this model leads to a long-term loss of αSMA around bronchi and bronchioles (Fig. 6C, E). A reduction in αSMA was also found with the mild OVA model MAA-rec, albeit not as pronounced as in SAA-rec mice (Fig. 6C). HDM-rec did not show any difference in αSMA when compared to healthy-rec animals (Fig. 6C). A surprising but important outcome was the finding that the PBS challenges also led to a significant loss of αSMA after 121 days of recovery (Fig. 6C). Moreover, both MTS and elastin staining of PBS-rec lungs showed values similar to those found in the weak OVA model MAA-rec, with elevated MT Score and decreased elastin, although both were not significantly different from healthy-rec controls (Fig. 6A, B). These data however suggest, that PBS or liquid instillation in the lung leads to remodeling of the lung and has therefore limited use as a vehicle control.