
Human specimens and organoid lines
Two terminal ileum tissues (donors H0514 and H0515-2) were obtained for immunofluorescent staining and flow cytometry analysis from Diakonessen Hospital Utrecht, with approval by the Medical Ethical Committee of the hospital and with informed consent of each patient.
The PBMCs from patients with CeD were collected from participants of the CeDNN study. CeDNN was approved by the Medical Ethical Committee of the University Medical Center Groningen, with METc no. 2013/440. Written consent was signed by all participants, their parents or legal representatives for participants aged under 16 for CeDNN. Normal PBMCs were purchased from Sanquin, with a signed material transfer agreement.
A total of five human intestinal organoid lines were established in our laboratory and recruited to this study. Three ileum tissues (donor 12339, 4280N/HLA-DQ2.5 #1 and 4403N/HLA-DQ2.5 #2) were obtained from the Netherlands Cancer Institute (NKI); one ileum tissue (donor N39) and one colon tissue (donor P11N) were obtained from the Diakonessen Hospital Utrecht, all with approval by the Medical Ethical Committee of the respective organizations and with informed consent of each patient.
This study was approved by the Ethical Committee of Hubrecht Institute and was in accordance with the Declaration of Helsinki and according to the Dutch law. The study complied with all relevant guidelines and regulations regarding research involving human participants.
Mice
Wild-type C57BL/6 mice were used in this study. Both male (n = 2) and female (n = 8) mice (more than 8 weeks of age) were included. No specific sample size was chosen, and neither randomization nor blinding were necessary, as no comparison was made. No specific ethical guidance was required. In this study, we only collected the intestinal Peyer’s patch tissues from euthanized mice for flow cytometry analysis and immunofluorescent staining, which was approved by the Institutional Review Board of Hubrecht Institute.
Organoid culture and M cell differentiation
Human intestinal organoid culture
Three-dimensional cultured human intestinal organoids were mixed with BME (R&D Systems, 3536-005-02), seeded as ~5 µl droplets, cultured in optimized culture of human intestinal organoids (OCHIO) medium and passaged weekly through mechanical dissociation as per the method previously described14.
M cell differentiation
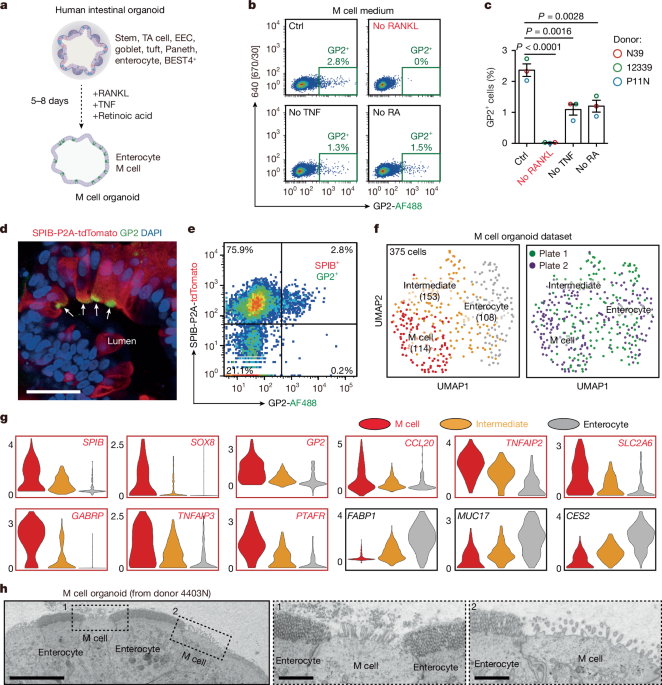
To generate human M cell organoids, a differentiation cocktail including 100 ng ml−1 RANKL (Peprotech, 310-01 C), 20 ng ml−1 TNF (Peprotech, 300-01 A) and 0.1 µM retinoic acid (Sigma-Aldrich, R2625) was added into the OCHIO medium three days post-passaging. The differentiation process was typically achieved within 5–8 days.
Apical-out organoids
To release cultured organoids from BME, ice-cold Corning Cell Recovery Solution (Sigma-Aldrich, CLS354253) was used. Following the release, M cell organoids underwent a polarity change through an overnight suspension culture in M cell medium with 3 µM CHIR99021 (Tocris, 4423). Gliadin proteins or 33-mer peptides were then added for 5 h prior to immunostaining.
Two-dimensional ALI culture
Human intestinal organoids cultured in OCHIO medium were dissociated using 1 ml TripLE (TrypLE Express Enzyme, Thermo Fisher, 12605010) at 37 °C for 6–8 min, followed by gentle pipetting (20 times) to ensure thorough dissociation. The resulting cell suspension was passed through a 40-µm cell strainer and washed twice with 15 ml wash medium. The wash medium consisted of adDMEM/F12 (advanced Dulbecco’s Modified Eagle’s Medium/F12, Gibco, 12634028) supplemented with 100 U ml−1 penicillin/streptomycin (Gibco, 15140122), 10 mM HEPES (Gibco, 15630056) and 1× Glutamax (Gibco, 35050038). Post-wash, cells were resuspended with OCHIO medium and seeded into the transwell inserts (Greiner, 662641) pre-coated with 10% BME. OCHIO medium was added to the apical (top) and basolateral (bottom) chambers, and cells were cultured for two days. After this period, unattached cells were removed, and the remaining attached cells were cultured for an additional two days until complete confluency was achieved. To induce M cell differentiation, the OCHIO medium was removed from both chambers, and M cell differentiation medium was added only to the bottom chamber to establish an ALI system. M cell differentiation was carried out for six to eight days.
Mouse intestinal organoid culture and differentiation
The protocol is similar to the human organoid cell culture and differentiation protocol with only minor modification. Instead of OCHIO medium, we used ENR medium for mouse organoid culture51. ENR medium consisted of adDMEM/F12 supplemented with 100 U ml−1 penicillin/streptomycin, 10 mM HEPES, 1× Glutamax, 1× B-27 supplement (Thermo Fisher, 12587010), 2.5 mM N-acetyl-l-cysteine (Sigma-Aldrich, A9165), 0.25% (v/v) recombinant Noggin (U-Protein Express BV, Custom order), 50 ng ml−1 EGF (Epidermal Growth Factor, Peprotech, AF-100-15), 10 mM NIC (Nicotinamide, Sigma-Aldrich, N0636) and 0.5% (v/v) R-spondin3 (U-Protein Express BV, Custom order).
Other immune factors and molecules used in this study
LTB (Lymphotoxin α2/β1, R&D system, 679-TX-010/CF) was tested at 100 ng ml−1, the same concentration as previously reported16. Cytokines were all from Peprotech with the following catalogue numbers: IL-2, 200-02; IL-3, 200-03; IL-4, 200-04; IL-5, 200-05; IL-7, 200-07; IL-15, 200-15; IFNα, 300-02AA; IFNγ, 300-02; MIF, 300-69; CX3CL1, 300-31; CSF2, 300-03. In the cytokine screening experiment shown in Extended Data Fig. 4l,m, interleukins, interferons, CX3CL1, MIF and CSF2 were used at 10 ng ml−1. Lipopolysaccharide (Sigma-Aldrich, L4391) was used at 100 ng ml−1. The concentrations of these immune factors were previously tested by us in organoid systems14,52, which are effective without significantly affecting organoid viability. Effect of CSF2 on M cell differentiation was further tested at higher concentrations (20 ng ml−1 and 50 ng ml−1) in organoids derived from unrelated donors. CADD522 (Selleck, S0790) was used at different titrated concentrations from 1 nM to 1 µM, and 100 nM of CADD522 was further used for validation in organoids derived from unrelated donors. CSRM617 (Sigma-Aldrich, SRL2608) was used at 50 µM. The TGM2 inhibitor ZED1227 (MedChemExpress, HY-19359) was used at 200 nM in co-culture assays and added 2 h before the peptide treatment.
Genetically modified organoids generated by CRISPR
Preparation of cells for electroporation: organoids were cultured in stem cell expansion medium53 for 4–5 days and then dissociated into small cell clumps with 1 ml TripLE at 37 °C for 4 min, followed by gentle pipetting (20 times). The dissociated cell suspension was filtered through a 40-µm cell strainer, washed twice with cold Opti-MEM (Thermo Fisher, 31985070) and resuspended in Opti-MEM for electroporation. The expansion medium consisted of adDMEM/F12 supplemented with 100 U ml−1 penicillin/streptomycin, 10 mM HEPES, 1× Glutamax, 1× B-27 supplement, 1.25 mM N-acetyl-l-cysteine, 10 mM NIC, 1% (v/v) recombinant Noggin, 0.5 nM WNT surrogate (U-Protein Express BV, Custom order), 50 ng ml−1 EGF, 0.5 µM A83-01 (Tocris, 2939), 20% (v/v) RSPO1, 1 µM SB202190 (Sigma-Aldrich, S7067) and 1 µM PGE2 (Prostaglandin E2, Tocris, 2296).
sgRNAs targeting different genes were cloned into pSPgRNA vector (Addgene plasmid #47108) according to the previously described protocol54. The sgRNA sequences used in this study are listed in Supplementary Table 1.
SPIB-P2A-tdTomato knock-in reporter organoids52 were generated using the CRISPR-HOT method as described55,56.
SPIB52, CIITA, RUNX2 and ICAM2-knockout organoids were generated by CRISPR-mediated C-to-T base-editing57. Four plasmids were co-transfected into organoid cells via electroporation: a C-to-T base editor (Addgene plasmid #112100 for NGG or #125615 for NGN), a plasmid encoding a gene-specific knockout sgRNA, and a two-plasmid transposon system58 (designed to introduce hygromycin resistance for selection). Three days post-electroporation, live single cells were sorted by FACS, based on the negative staining of DAPI (Sigma-Aldrich, 10236276001). The sorted cells were then cultured in expansion medium supplemented with hygromycin to select successfully transfected cells. Single-cell-derived subclones were subsequently hand-picked and expanded. Successful knockout organoids were confirmed by targeted genotyping via Sanger sequencing.
TGM2-knockout organoids were generated by the conventional CRISPR knockout method59. Four plasmids were co-transfected into organoid cells via electroporation: a frame selector plasmid (Addgene plasmid #66940), a plasmid encoding a TGM2-specific knockout sgRNA, and the two-plasmid transposon system. Three days post-electroporation, organoid cells were FACS-sorted based on the mCherry fluorescence. The sorted cells were then cultured in expansion medium supplemented with hygromycin. Single cell-derived subclones were subsequently hand-picked and expanded. Successful knockout organoids were confirmed by targeted genotyping via Sanger sequencing.
Immunostaining and imaging
Before fixation, organoids were released from BME using ice-cold Corning Cell Recovery Solution and primary tissues were dissected to remove the muscle layers. Then, primary tissues or organoids were fixed in 4% formaldehyde solution at 4 °C for 18 h or room temperature for 1 h, respectively, and washed three times with PBS (phosphate-buffered saline) and then embedded into OCT for cryosectioning. For immunofluorescence staining, the cryosections were blocked at room temperature for 1 h, using a blocking buffer containing 10% FBS (fetal bovine serum) in PBS-T (PBS with 0.1% Triton X-100). Primary antibodies, diluted in blocking buffer, were applied and incubated overnight at 4 °C. The sections were subsequently washed three times with PBS-T, followed by incubation with secondary antibodies overnight at 4 °C. After three additional washes with PBS-T, sections were mounted for imaging. For whole-mount immunostaining in transwell inserts, the same fixation and staining protocol were used as described above. However, instead of mounting, the transwell inserts were submerged in PBS-T, put in the glass-bottom well plate, and directly staged on the microscope for imaging. All the images were captured using a Leica SP8 confocal detection system integrated with a Leica DMi8 microscope. Leica LAS X software (v.3.5.7.23225) was used for image processing and export.
Primary antibodies used in this study: mouse anti-human GP2 (MBL, D277-3, clone 3G7-H9, diluted 1:200); mouse anti-human ICAM2 (Thermo Fisher, BMS109BT, clone CBR-IC2/2, diluted 1:200); mouse anti-human HLA-DP/DQ/DR (Thermo Fisher, MA1-25914, clone CR3/43, diluted 1:200); rat anti-mouse MHC-II (I-A/I-E) (Thermo Fisher, 14-5321-82, clone M5/114.15.2, diluted 1:200), UEA-1-Rhodamine (Vector, RL-1062-2, diluted 1:1,000); Phalloidin (Sigma, 65906-10NMOL, diluted 1:1,000); DONQ52 antibody (provided by Chugai Pharmaceutical, diluted 1:100).
IHC staining images using TFF2 and MHC-II antibodies in primary human intestinal tissues were obtained from the Human Protein Atlas60 (https://proteinatlas.org), details regarding antibodies and patient numbers are included in the related figures.
Flow cytometry analysis
Organoids were released from BME and dissociated into single cells as described above. Post-dissociation, cells were incubated with primary antibody on ice for 30 min, followed by staining with DAPI or PI. Samples were analysed on a BD LSR Fortessa X20 equipped with four lasers (BD Bioscience) or a BD FACSMelody cell sorter equipped with three lasers (BD Bioscience). Cell sorting was performed on a BD FACS Influx cell sorter equipped with five lasers (BD Bioscience). BD FACS Diva software (v.8.0.1) and FlowJo (v.10.8.0) were used for data analysis and display. Sequential gating strategies for flow cytometry can be found in Supplementary Fig. 2.
Preparation of single-cell suspension from primary intestinal tissues: Human terminal ileum tissue was first dissected to remove the muscularis externa, following a previous protocol61. Regions containing human or mouse Peyer’s patches, which could be clearly identified under dissection microscopy, were enriched, minced into small pieces (~1 mm²), and digested in digestion buffer (adDMEM/F12 supplemented with 100 U ml−1 penicillin/streptomycin, 10 mM HEPES, 1× GlutaMAX, 1 mg ml−1 collagenase (Sigma-Aldrich, C9407), and 5 mM EDTA) for 30 min at 37 °C, with vigorous shaking every 5 min. The digested tissues were then filtered through a 100-µm cell strainer, washed twice with wash buffer (adDMEM/F12 supplemented with 100 U ml−1 penicillin/streptomycin, 10 mM HEPES, 1× GlutaMAX, and 10% FBS), and dissociated into single cells for flow cytometry analysis, similar to the procedure used for organoids, as described above.
Antibodies used in FACS analysis: mouse anti-human GP2-AF488 (MBL, D277-A48, clone 3G7-H9); rat anti-mouse GP2-AF488 (MBL, D278-A48, clone 2F11-C3); mouse anti-human ICAM2-biotin (Thermo Fisher, BMS109BT, clone CBR-IC2/2); mouse anti-human HLA-DP/DQ/DR-BV421 (BD horizon, 564244, clone Tu39); mouse anti-human HLA-DP/DQ/DR-FITC (BD Pharmingen, 562008, clone Tu39); mouse anti-human CD4-AF488 (Biolegend, 317420, clone OKT4); mouse anti-human EpCAM-APC (Biolegend, 369810, clone CO17-1A); rat anti-mouse MHC-II (I-A/I-E)-BV421 (Biolegend, 107631, clone M5/114.15.2); rat anti-mouse CD45-PE (Biolegend, 103106, clone 30-F11); rat anti-mouse EpCAM-APC (Thermo Fisher, 17-5791-80, clone G8.8); mouse anti-human CD69-PE (Biolegend, 310905, clone FN50). Antibodies were diluted 1:100.
Sample preparation and immunogold labelling for electron microscopy imaging
For TEM imaging, organoids were fixed with 1.5% glutaraldehyde in 0.1 M cacodylate buffer for 24 h at 4 °C. Following fixation, the samples were washed with 0.1 M cacodylate buffer and post-fixed with 1% osmium tetroxide in the same buffer containing 1.5% potassium ferricyanide for 1 h in the dark at 4 °C. The samples were then dehydrated in ethanol, infiltrated with Epon resin for 2 days, and subsequently embedded in the same resin. Polymerization of the resin was carried out at 60 °C for 48 h. Ultrathin sections (70 nm) were obtained using a Leica Ultracut UCT ultramicrotome (Leica Microsystems) and mounted on Formvar-coated copper grids. The ultrathin sections were stained with 2% uranyl acetate in water, followed by lead citrate. Images were captured using a Tecnai T12 electron microscope equipped with an Eagle 4kX4k CCD camera (Thermo Fisher Scientific).
To prepare ultrathin sections for immunolabelling, M cell organoids or normal intestinal organoids treated with or without IFNγ (48 h) were chemically fixed with 4% paraformaldehyde in 0.1 M phosphate buffer at 4 °C. After fixation, the organoids were washed with 0.1 M phosphate buffer, embedded in 12% gelatin, and infused in 2.3 M sucrose for 24 h. The mounted gelatin blocks were frozen in liquid nitrogen. Thin sections were prepared using a cryo ultramicrotome (Leica EM Ultracut UC6/FC6, Leica Microsystems). Ultrathin cryosections were collected with 2% methylcellulose in 2.3 M sucrose.
For immunogold labelling, cryosections were incubated on drops of PBS for 60 min at 37 °C, followed by incubation in 50 mM glycine in PBS for 10 min and 1% BSA in PBS for 15 min at room temperature. Sections were then incubated with mouse anti-human CD63 antibody (BD Biosciences, 556019, clone H5C6, diluted 1:20) or mouse anti-human MHC-II antibody (Thermo Fisher, MA1-25914, clone CR3/43, diluted 1:20) diluted in 1% BSA in PBS for 60 min. After five washes with drops of 0.1% BSA in PBS, sections were incubated for 20 min with a bridging antibody, rabbit anti-mouse (DAKO, diluted 1:300). Following five additional washes with drops of 0.1% BSA in PBS, sections were incubated for 20 min with protein A-conjugated, 10 nm diameter colloidal gold particles (CMC Utrecht, diluted 1:50), diluted in 1% BSA in PBS. Sections were then fixed with 1% glutaraldehyde in PBS for 5 min, followed by washes with drops of PBS for 10 min, and two washes with distilled water. Grids were embedded in a thin layer of 1.8% methylcellulose (25 Ctp) containing 0.4% Uranyl acetate. A control for non-specific binding of the colloidal gold-conjugated antibody was included by omitting the primary antibody. Images were captured using the Tecnai T12 electron microscope equipped with the Eagle 4kX4k CCD camera.
Sample preparation and scRNA-seq analysis of M cell organoids
Differentiated M cell organoids were dissociated into single cells for FACS sorting as described above. Single DAPI− live cells were sorted using a BD FACS Influx cell sorter. Sorted individual single cells were collected in 384 well plates containing ERCC spike-ins (Agilent), reverse transcription primers (Promega) and dNTPs (Promega) as previously described62. A total of 768 cells (2 plates) were collected. scRNA-seq was conducted according to the SORT-seq method63. Sequencing libraries were prepared with TruSeq small RNA primers (Illumina) and sequenced on the Illumina NextSeq platform. Sequencing reads were aligned to the human GRCh38 genome to generate the gene expression matrix for subsequent analysis.
The scRNA-seq datasets were loaded into Seurat (v.3.1.4) objects in R Studio (v.3.6.3) for data integration, analysis and visualization64, according to the standard pipeline. To create Seurat objects, data were filtered with nFeature_RNA values set to more than 1,000. In total of 375 cells fit this criterion. After creating the Seurat objects, data normalization was performed based on the LogNormalize method, with the scale.factor set to 10,000. Variable features were found by the vst method. Per plate, the two datasets were then anchored together with 2,000 integration features and 50 dimensions to find integration anchors before being clustered in accordance with the standard Seurat pipeline. Dimensional reduction was performed using the UMAP method based on the top 20 principal components. Cell clustering was based on the unsupervised shared-nearest neighbour (SNN) method with the resolution set to 0.7. A total of three cell clusters were identified and annotated, based on the well-known intestinal cell-type markers. Violin plots, heat maps and individual UMAP plots for the given genes were generated by the Seurat toolkit functions VlnPlot, DoHeatmap and DimPlot, respectively.
Re-analysis of primary human intestinal scRNA-seq datasets
Four published datasets were loaded into Seurat objects in R Studio for data integration and visualization. To create the Seurat objects, in GSE119969 (ref. 65) and GSE125970 (ref. 66) datasets, genes expressed in at least three cells and cells with nFeature_RNA > 200 were selected, in the GSE146799 (ref. 62) dataset, genes expressed in at least three cells and cells with nFeature_RNA > 1,000 were selected. We directly used the Seurat object created by Elmentaite et al.17, but only selected cells from the adult and paediatric healthy donors in our analysis. To accelerate the speed of analysis, we removed the stem/TA cells and enterocytes from the Elmentaite et al. dataset. The other three datasets still contain sufficient numbers of these cells for analysis. Datasets were then anchored together with 2,000 integration features and 30 dimensions to find integration anchors before being clustered in accordance with the standard Seurat pipeline. Dimensional reduction was performed using UMAP method. Cell clustering was based on the unsupervised SNN method. After cell-type annotation, based on the well-known intestinal cell-type markers, we only used the cells with a clear cellular identity for further analysis and data display. Unsupervised sub-clustering of primary SPIB-expressing M cells was similarly done with the SNN method, by setting the resolution to 2, which identified six sub-clusters. The developmental stage of each sub-cluster was defined on the basis of the expression of well-known M cell markers: GP2 for mature M cells, ICAM2, TNFAIP2 and CCL23 for immature M cells, and SPIB for early M cells.
Integration of human intestinal epithelial and immune cells: the Seurat object of primary intestinal myeloid cells, created by Elmentaite et al.17, was included and integrated with the epithelial cell types derived from the Seurat object generated above, which includes enterocytes, Paneth cells, tuft cells, goblet cells and genuine M cells (excluding the Brunner’s gland cells). MHC-II+ enterocytes were derived from the IBD samples of Elmentaite et al. dataset. The datasets were anchored together based on 2,000 integration features and 30 dimensions. Dimensional reduction was performed using UMAP method and cell clustering was based on the unsupervised SNN method.
For transcriptomic comparisons of immature versus mature M cells or M cells versus MHC-II+ enterocytes, the raw counts data were analysed using the DEseq2 (v.1.26.0) R package67 with default settings. Normalized counts of MHC-II genes after DEseq2 analysis were shown in the Extended Data Fig. 7c. DEGs were defined by |log2 (fold change)| ≥2 with P value ≤ 0.001. GO analysis was performed by uploading these DEGs into the Enrichr software68 to identify the most relevant cell types.
Re-analysis of scRNA-seq datasets of mouse intestinal tissue- or organoid-derived M cells
Sequencing data29 of mouse intestinal organoids cultured with or without RANKL was retrieved from the GEO database (GSE92332). Analysis was performed in Python (v.3.11.9) using the Scanpy library and the recipe based on Wu et al.69. In brief, cells with more than 5% mitochondrial genes were filtered out, and counts per cell were normalized and log10-transformed. Dimensional reduction was performed by finding the 2,000 most highly expressed genes (excluding mitochondrial and ribosomal), scaling and principal components analysis (50 components) and computing of the neighbourhood graph (k-nearest neighbours (KNN) = 200).
Sequencing data of primary mouse intestinal cell types were also retrieved from the GEO database (GSE92332). Raw counts data of M cells and distal enterocytes (cell-type annotation same as the original study) were subjected to DEseq2 analysis with default settings. Normalized counts of MHC-II genes after DEseq2 analysis were shown in the Extended Data Fig. 7c. GO analysis was performed using the mouse M cell marker genes (revealed by the original study) and the Enrichr software to identify the most relevant functional pathways.
T cell binding assay in co-culture
CD4+ T cells were activated to induce LFA-1 expression by Dynabeads Human T-Activator CD3/CD28 for T Cell Expansion and Activation (Thermo Fisher, 11131D). M cell organoids were released from BME and co-cultured with activated CD4+ T cells for 6 h in suspension culture to facilitate T cell binding. After incubation, the organoids with bound T cells were gently collected into a 15-ml tube containing 13 ml of culture medium. Organoids were allowed to spontaneously settle by gravity for 3–4 min. The supernatant containing unbound T cells was then removed. Organoids were then washed twice using the same method to thoroughly remove the remaining unbound T cells, collected by centrifugation, and dissociated into single cells followed by flow cytometry analysis. The number of CD4+ T cells that still bind to organoids was normalized against the number of EpCAM+ epithelial cells. To inhibit T cell binding, ICAM2 knockout M cell organoids were used, and an ICAM1 neutralizing antibody70 (10 µg ml−1, Thermo Fisher, 15-0549-82) was further added 1 h prior to the T cells.
Phagocytosis of bacteria particles in 2D cultured M cells
FACS-sorted M cells were seeded on glass-bottom 96-well plates coated with Invasin71 to facilitate cell attachment. After overnight culture, fluorescent bacteria particles were prepared and added according to the manufacturer’s protocol (Thermo Fisher, P35361), followed by live imaging. For live imaging, plates were staged on the Leica SP8 confocal detection system fitted on a Leica DMi8 microscope (equipped with a CO2 and temperature control system) to capture time-series images every 5 min for 2 h. Images were analysed and movie was generated by the IMARIS software (v.9.3). The phagocytosis inhibitor cytochalasin B (10 µM, Sigma-Aldrich, C6762) was added 3 h prior to the addition of bacteria particles.
Preparation of 33-mer peptides and wheat-derived gliadin protein
To prepare pepsin/trypsin-treated gliadin protein, 10 g of wheat-derived gliadin (Sigma-Aldrich, G3375) was dissolved in 100 ml of 0.2 N hydrochloric acid, followed by pepsin treatment (Sigma-Aldrich, P6887, 2 mg ml−1) for 2 h at 37 °C, with stirring. pH of the mixture was adjusted to 7.4 using 2 M sodium hydroxide. Subsequent trypsin treatment (Sigma-Aldrich, T1416) was performed at 37 °C for 4 h, with vigorous stirring. The mixture was then heated at 100 °C for 30 min to stop enzyme activity, and freeze-dried into powder. Further TGM2 (tissue transglutaminase) treatment was performed by incubating 1.08 ml dissolved powder (prepared as 1.11 mg ml−1 in PBS) with 120 µl TGM2 enzyme (Sigma-Aldrich, T5398, prepared as 1 mg ml−1 in PBS containing 1 mM CaCl2) for 2 h at 37 °C. The 33-mer peptides were synthesized by GenScript, with the sequence LQLQPF(PQPELPY)3PQPQPF and LQLQPF(PQPQLPY)3PQPQPF.
Reporter T cell lines with TCR overexpression
The human Jurkat T cell line derivative J76 reporter cell line (J76TPR72), provided M. H. M. Heemskerk, was utilized in this study. The HLA-DQ2.5-glia-α2 specific TCR sequence S16 (TCRα-P2A-TCRβ) was cloned into a plasmid containing the PiggyBac Transposon system. J76TPR cells, which lack endogenous TCRα and TCRβ chains, were transfected with the S16 TCR and transposase plasmids through electroporation. The surface expression of the S16 TCR was evaluated by flow cytometry with the staining of an APC-conjugated anti-human TCR α/β antibody (Biolegend, 306718, clone IP26). Cells expressing the S16 TCR were FACS-sorted and cultured in IMDM (Iscove’s Modified Dulbecco’s Medium, Gibco, 12440061) supplemented with 10% heat-inactivated FBS, 100 μg ml−1 streptomycin, and 100 U ml−1 penicillin. The expression of the S16 TCR was routinely checked by flow cytometry every two weeks for use in subsequent experiments.
The human Jurkat T cell line derivative JRT3 cell line, with endogenous TCRα and TCRβ chains knockout, expressing NFAT-RE-Luc2 and HLA-DQ2.5-glia-α2 specific TCR D2, was provided by Chugai Pharmaceutical. These cells were cultured in RPMI1640 (Roswell Park Memorial Institute 1640 medium, Gibco, 11875093) supplemented with 10% heat-inactivated FBS, 100 μg ml−1 streptomycin, 100 U ml−1 penicillin, 1 x MEM non-essential amino acids, 1 mM sodium pyruvate, 0.2 mg ml−1 hygromycin and 100 μg ml−1 zeocin. Both cell lines were validated on the basis of gliadin-specific T cell activation, as indicated by the induced reporter gene expression, and were assessed and scored negative for mycoplasma contamination.
CeD PBMC isolation
Peripheral blood collected in EDTA tubes was processed for mononuclear cell isolation using BD Vacutainer Mononuclear Cell Preparation Tubes (CPT, BD Biosciences). A volume of 8 ml of whole blood was transferred into a CPT tube, followed by gentle inversion ten times to ensure proper mixing with the separation medium. Immediately prior to centrifugation, the tube was inverted an additional three times to homogenize the contents. Samples were centrifuged at room temperature for 15 min at a relative centrifugal force (RCF) of 1,500–1,800g. Following centrifugation, approximately 50% of the plasma layer was carefully aspirated without disturbing the underlying mononuclear cell layer, which appeared as a diffuse, cloudy interface. The entire cell layer was then collected using a disposable plastic Pasteur pipette and transferred into a sterile 15 ml conical tube. To wash the cells, 10 ml of PBS was added and the tube was gently inverted to mix. The suspension was centrifuged for 10 min at 300g at room temperature. During this step, a freezing medium was prepared, consisting of 80% heat FBS (Thermo Fisher) and 20% DMSO (Sigma-Aldrich). After centrifugation, the supernatant was discarded. The cells were resuspended in 0.5 ml of RPMI 1640 medium (Thermo Fisher) and transferred into a cryovial containing 0.5 ml of freezing medium, with gentle mixing to ensure homogeneity. The cryovials were then placed in a freezing container and stored at −80 °C for controlled-rate freezing.
Co-culture of reporter T cells with organoids and analysis of T cell activation
Organoids cultured in M cell medium or OCHIO medium (with or without IFNγ stimulation for 48 h) for 6–7 days were washed twice with wash medium (adDMEM/F12 supplemented with 100 U ml−1 penicillin/streptomycin, 10 mM HEPES and 1× Glutamax) and broken into small pieces by mechanical shearing to ensure better antigen uptake. 10 µg ml−1 of 33-mer peptides or 20 µg ml−1 of gliadin proteins were added to the organoids for 5 h prior to co-culture. J76TPR cells expressing S16 TCR or JRT3 cells expressing D2 TCR were counted and co-cultured with antigen pre-treated organoids at a 1:1 ratio. The organoid and T cell co-cultures were maintained overnight in a co-culture medium consisting of 48.75% OCHIO medium, 48.75% T cell medium, and 2.5% BME. T cell activation in J76TPR was assessed by flow cytometry. Cells were stained with the APC-conjugated anti-human TCR α/β antibody. Then the eGFP fluorescence from the NFAT-RE-eGFP reporter construct in J76TPR cell line was analysed, as an indicator of T cell activation. T cell activation in JRT3 cells was assessed by measuring the luciferase activity using the Steady-Glo Luciferase Assay System (Promega, E2510) according to the manufacturer’s protocol. The luminescence intensity of each well was recorded for 1,000 ms using the Spark multimode microplate reader (TECAN Life Sciences). The induction of luciferase activity was quantified by calculating the ratio of the difference between the luminescence counts per second (cps) of the target wells and the average luminescence cps of the cell-free wells to the difference between the average luminescence cps of the T cell-only wells and the average luminescence cps of the cell-free wells.
Co-culture of primary human T cells with M cells and analysis of T cell activation
Organoids cultured in M cell medium or OCHIO medium (with or without IFNγ stimulation for 48 h) for 6–7 days were collected as a single-cell suspension as described above. Cells were then stained with antibodies and FACS-sorted into MHC-II+ and MHC-II− populations for the following co-culture assays. All experiments were performed in flat bottom 96-well plates (Greiner, 655180) pre-coated overnight at 4 °C with 1% BME in PBS.
For antigen-dependent activation of autologous T cells, 20,000 FACS-sorted MHC-II+ and MHC-II− organoid cells were plated and incubated overnight with a human MHC-II-restricted peptide pool (JPT Peptide Technologies, PM-CEFT-MHC-II-1; 5 μg ml−1). The following day, 100,000 naive CD4+ T cells isolated from autologous PBMCs using MojoSort Human naive CD4+ T cell Isolation Kit (Biolegend, 480041) were added to the co-culture. After 24 h, T cell activation was analysed by flow cytometry following staining with DAPI, anti-CD4-AF488 (Biolegend, 317420), and anti-CD69-PE (Biolegend, 310905) FACS antibodies. The setting of the CD69+ gate was based on the negative controls.
For antigen-independent stimulation, FACS-sorted MHC-II+ and MHC-II− cells were plated (20,000 per well) and co-cultured 3 h later with 100,000 naive CD4+ T cells from unrelated healthy donors. CytoStim (Miltenyi Biotec, 130-092-173) was added following the manufacturer’s protocol. After 24 h, CD69 upregulation was assessed as described above. For proliferation analysis, naive CD4+ T cells were pre-labelled with Cell Proliferation Dye eFluor 670 (Thermo Fisher, 65-0840-85) and analysed by flow cytometry after five days, following staining with anti-CD4-AF488 antibody.
To assess gluten-specific responses, MHC-II+ and MHC-II− cells of organoids derived from HLA-DQ2.5 donor were FACS-sorted and plated as described above. The 33-mer gliadin peptides (10 μg ml−1) were added for overnight incubation. Total CD4+ T cells were isolated from PBMCs of patients with CeD with the HLA-DQ2.5 haplotype, using the MojoSort Human CD4+ T cell Isolation Kit (Biolegend, 480009), and co-cultured at 100,000 cells per well. T cell activation was evaluated by flow cytometry following DAPI, CD4 and CD69 staining.
EdU labelling assay
Cultured organoids were incubated with EdU (1 mg ml−1) for 2 h, followed by 1 h fixation with 4% formaldehyde solution at room temperature. EdU colour development was performed following manufacturer’s protocol (Thermo Fisher, C10640).
TGM2 ELISA
Cell lysates and culture media from M cell organoids were analysed by ELISA following the manufacturer’s protocol (Thermo Fisher, EH462RB). To prepare the samples, M cell organoids were collected and washed three times with PBS to thoroughly remove remaining BME, then lysed with lysis buffer (Thermo Fisher, 87787). Culture medium was pre-concentrated tenfold using Protein Concentrators (Thermo Fisher).
Bulk RNA sequencing of M cell organoids
For each M cell subpopulation, 2,000 DAPI− live single cells (from one biological replicate) were FACS-sorted into the TRIzol reagent (Thermo Fisher, 15596026). Library preparation and sequencing were performed by Single Cell Discovery following the standard protocol. Sequencing reads were aligned to the human GRCh38 genome. Raw counts data was subjected to DEseq2 R package67 and analysed with default settings. DEGs were defined by |log2 (fold change) | ≥1 with P value ≤ 0.01. GO analysis was performed by uploading the DEGs into the Enrichr web software. GSEA was based on clusterProfiler (v.3.14.3) R package73. log2 (fold change) was calculated between the mature M cells and enterocytes. The KEGG gene sets (v.7.4) and all GO gene sets (v.7.4) were used as the reference.
RNA extraction and qPCR analysis
Following the manufacturer’s protocol, FACS-sorted cells were subjected to RNA isolation using a NucleoSpin RNA kit (Macherey-Nagel, 740955.50). Reverse transcription reactions were performed using GoScript reverse transcriptase kit (Promega, A5000). cDNA was subjected to qPCR analysis using iQ SYBR Green Supermix (Bio-Rad, 1708887) on a CFX Connect Real-Time PCR machine (Bio-Rad). For gene expression analysis, qPCR was performed with gene-specific qPCR primers. The Ct value of each gene was normalized to the housekeeping gene GAPDH (as the ΔCt), and fold change between experimental groups was calculated with the 2−ΔΔCt method. All qPCR primers used in this study are listed in Supplementary Table 2.
Quantification and statistics analysis
Data were presented as mean ± s.e.m. Two-tailed Student’s t-test was used when two experimental groups were compared. One-way ANOVA was used when multiple experimental groups were compared. All P values were calculated and all the graphs were generated using Graphpad PRISM (v.7.04). The statistical details for each experiment can be found in the figure legends. In volcano plots shown in (Extended Data Figs. 2c, 3c,e and 6d), DEseq2 used negative-binomial generalized linear models (NB-GLM) and tested coefficients (per gene) with two-sided Wald test to produce P values. In volcano plots shown in (Figs. 2i and 3c and Extended Data Figs. 6f and 7d), P values were computed from one-sided Fisher’s exact test, which is a proportion test that assumes a binomial distribution and independence for probability of any gene belonging to any test.
Reporting summary
Further information on research design is available in the Nature Portfolio Reporting Summary linked to this article.