
Study participants and collection of clinical samples
Large blood draws and leukapheresis samples were collected in accordance with protocols reviewed and approved by the Institutional Review Board of the University of Cologne (study protocols 13-364 and 16-054) and local institutional review boards. Study participants were recruited from private practices and/or hospitals in Germany (Cologne, Essen and Frankfurt), Cameroon (Yaoundé), Nepal (Kathmandu) and Tanzania (Mbeya), and all participants provided written informed consent. Compensation was provided in line with institutional and ethical guidelines to reimburse time and expenses without exerting undue influence. A total of 2,354 serum samples were screened for anti-HIV-1 neutralizing activity to identify HIV-1 elite neutralizers17. Study individual EN01 was selected for a large blood draw and subsequent B cell isolation. Biosample collection was conducted irrespective of sex/gender, which was not a study design criterion. Clinical information was obtained from medical records.
Cell lines
HEK293T cells (American Type Culture Collection, #CRL-3216) were cultured in DMEM (Thermo Fisher Scientific) supplemented with 10% fetal bovine serum (FBS; Sigma-Aldrich), 1x antibiotic-antimycotic (Thermo Fisher Scientific), 1 mM sodium pyruvate (Gibco) and 2 mM L-glutamine (Gibco) at 37 °C in an atmosphere containing 5% CO2. HEK293-6E cells (National Research Council of Canada, Cat. No. NR16-179/2017E) were grown in FreeStyle 293 Expression Medium (Life Technologies) supplemented with 0.2% penicillin/streptomycin and maintained under constant agitation at 90 to 120 rpm at 37 °C and 6% CO2. TZM-bl cells (NIH AIDS Reagent Program, #ARP5011) were cultured in DMEM supplemented with 10% FBS, 1 mM sodium pyruvate, 2 mM L-glutamine 50 µg ml−1 gentamicin (Merck), and 25 mM HEPES (Millipore) at 37 °C in 5% CO2. All three cell lines (HEK293T, HEK293-6E and TZM-bl) were of female origin and were not specifically authenticated.
Mouse models
NOD.Cg-Rag1tm1momIl2rgtm1Wjl/SzJ (NRG) mice (n = 33; 19 females, 14 males, aged 6–8 months) were acquired from The Jackson Laboratory and subsequently bred and housed within the Decentralized Animal Husbandry Network (Dezentrales Tierhaltungsnetzwerk) at the University of Cologne. Mice were maintained under specific pathogen-free conditions with a 12-h light/dark cycle at 20–22 °C and 30% to 60% humidity. Breeding mice were provided ssniff 1124 breeding feed, whereas experimental mice received ssniff 1543 maintenance feed. The generation of humanized mice followed an established protocol, with slight modifications51,52. Human CD34⁺ hematopoietic stem cells were isolated from umbilical cord blood and placental tissue through immunomagnetic separation using CD34 microbeads (Miltenyi Biotec). The collection of these tissue sources was conducted with prior written informed consent, following protocols approved by the Institutional Review Board of the University of Cologne (16-110) and the Ethics Committee of the Medical Association of North Rhine (2018382). Within 5 days after birth, NRG mice received sublethal irradiation, after which human CD34⁺ stem cells were administered via intrahepatic injection 4 to 6 h later. The engraftment and humanization efficiency were assessed 12 weeks after injection using FACS to detect peripheral blood mononuclear cells (PBMCs) in circulation51. All animal experiments were performed in compliance with ethical regulations and approved by the State Agency for Nature, Environmental Protection, and Consumer Protection of North Rhine-Westphalia (LANUV).
PBMCs and plasma isolation
PBMCs were isolated from large-volume blood samples using density gradient centrifugation with Histopaque separation medium (Sigma-Aldrich) and Leucosep cell tubes (Greiner Bio-One), following the manufacturer’s instructions. The purified PBMCs were cryopreserved at −150 °C in a freezing medium composed of 90% FBS and 10% dimethylsulfoxide until further use. Plasma samples were collected separately and stored at −80 °C for subsequent analyses.
Isolation of single HIV-1-reactive B cells
The isolation of single antigen-reactive B cells was carried out following previously established methods21,53. CD19⁺ B cells were selectively enriched from PBMCs using immunomagnetic separation with CD19 microbeads (Miltenyi Biotec) according to the manufacturer’s protocol. Isolated CD19⁺ B cells were subsequently stained on ice for 20 min with 4′,6-diamidino-2-phenylindole (DAPI; Thermo Fisher Scientific), anti-human CD20-Alexa Fluor 700 (BD), anti-human IgG-APC (BD) and GFP-labeled BG505SOSIP.66454. Following staining, DAPI⁻ CD20⁺ HIV-1 Env-reactive IgG⁺ single cells were sorted into 96-well plates using a FACSAria Fusion cell sorter (Becton Dickinson). Each well was preloaded with 4 µl of sorting buffer containing 0.5× PBS, 0.5 U µl−1 RNAsin (Promega), 0.5 U µl−1 RNaseOut (Thermo Fisher Scientific), and 10 mM dithiothreitol (DTT; Thermo Fisher Scientific). The plates were immediately cryopreserved at -80 °C following cell sorting.
Amplification and analysis of heavy and light chain V gene sequences
Antibody heavy and light chain amplification from single cells was primarily conducted as described in prior studies21,55,56. Reverse transcription was carried out using Random Hexamers (Invitrogen) and Superscript IV (Thermo Fisher Scientific) in the presence of RNase inhibitors RNaseOUT (Thermo Fisher Scientific) and RNasin (Promega) to preserve RNA integrity. The synthesized cDNA was subsequently used for the amplification of immunoglobulin heavy and light chains using PlatinumTaq HotStart polymerase (Thermo Fisher Scientific), supplemented with 6% KB extender and gene-specific primer mixes targeting V gene regions. A semi-nested PCR strategy was applied with optimized V gene-specific primer mixes57 to improve amplification efficiency21,55,56,57. The resulting PCR products were evaluated via gel electrophoresis to confirm expected fragment sizes before undergoing Sanger sequencing. Raw sequence processing, annotation and clonal assignment was performed with the Antibody Repertoire Toolkit (AbRAT)58 using default settings. In brief, chromatograms were filtered to only retain sequences with a mean Phred quality score of at least 28 and a minimum read length of 240 nt. Variable region annotation, spanning from FWR1 to the end of the J gene segment, were annotated based on IgBLAST59. Nucleotide positions within the variable region exhibiting Phred scores below 16 were masked, and sequences containing more than 15 masked bases, premature stop codons or frameshifts were excluded from downstream analyses.
For clonal lineage assignment, productive heavy chain sequences were grouped by identical VH/JH gene usage and clustered with AbRATs “Iterative Greedy CDR3 Clustering”-algorithm that is based on the pairwise Levenshtein distance between CDRH3s. Clonal clusters were defined by initiating the grouping process from a randomly selected sequence, with membership requiring a minimum of 75% CDRH3 amino acid identity (relative to the shortest sequence). To enhance classification accuracy, 100 iterations of randomization and clonal assignment were performed, with the configuration yielding the lowest number of unassigned sequences chosen for subsequent analysis. All assigned clone groups were manually validated by investigators, incorporating shared somatic mutations and light chain pairing information to ensure consistency in lineage identification.
Cloning and production of monoclonal antibodies
The heavy and light chain V gene regions of mAbs were synthesized as eBlocks gene fragments (IDT), incorporating complementary overhangs pre-configured for cloning into expression vectors (IgG1, AbVec2.0-IGHG1, Addgene accession #80795; IgG3, AbVec2.0-IGHG3, Addgene accession #99577; Igλ, AbVec1.1-IGLC2-XhoI, Addgene accession #99575; Igκ, AbVec1.1-IGKC, Addgene accession #80796). Cloning was performed using sequence- and ligation-independent cloning with T4 DNA polymerase (New England Biolabs) and chemically competent Escherichia coli DH5α, following established protocols21,53,55,56,60. Positive transformants were identified through Sanger sequencing, after which confirmed bacterial colonies were expanded in LB medium. Plasmid DNA was subsequently extracted using the NucleoBond Xtra Midi kit (Macherey-Nagel).
MAbs were generated by co-transfecting HEK293-6E cells (0.8 × 10⁶ cells in 50 ml) with heavy chain (IgG1) and light chain (Igλ or Igκ) expression plasmids using PEI (Sigma-Aldrich) as the transfection reagent. Cells were maintained at 37 °C with 5% CO2 in FreeStyle 293 Expression Medium (Thermo Fisher Scientific) supplemented with 0.2% penicillin/streptomycin under continuous agitation at 120 rpm. Culture supernatants were harvested 7 days after transfection via centrifugation and incubated overnight at 4 °C with Protein G-coupled beads (GE Life Sciences). The beads were subsequently transferred to chromatography columns (Bio-Rad), washed with DPBS (Thermo Fisher Scientific), and antibodies were eluted using 0.1 M glycine (pH 3.0) into 1 M Tris (pH 8.0) to neutralize acidity. A final buffer exchange to PBS was performed using 30 K Amicon spin membranes (Merck Millipore). Antibody concentrations were determined via UV spectrophotometry using a Nanodrop system (Thermo Fisher Scientific). All anti-HIV-1 bNAbs reference antibodies were functionally validated through neutralization assays against the global HIV-1 pseudovirus panel. The resulting IC50 and IC80 values for each antibody were compared to historical data available in the CATNAP database. Only those antibodies exhibiting less than a threefold deviation in IC50/IC80 values relative to the reference data were included in subsequent functional analyses.
007 and 10-1074 IgGs used for structural studies, mass spectrometry, and molar neutralization ratio assays were expressed via transient co-transfection of Expi293F cells with heavy and light chain plasmids. IgG1 antibodies were purified from cell culture supernatant using MabSelect SuRe (Cytiva), concentrated, and SEC purified on a Superdex 200 column (Cytiva). 007 IgG3 was purified by diluting the Expi293F cell culture supernatant 5-fold in PBS (pH 7.0) and loading over a HiTrap Protein G HP column (Cytiva). The column was washed in PBS (pH 7.0) and IgG3 was eluted in 0.1 M glycine, 150 mM NaCl (pH 2.7) into 2 M Tris (pH 8.0). The IgG3 sample was then concentrated and SEC purified on a Superdex 200 column (Cytiva). SEC fractions corresponding to IgG were combined and concentrated.
To produce Fabs, the heavy chain variable region of 007 was subcloned into a mammalian expression vector containing the CH1 domain and a C-terminal 6xHis tag. 10-1074 plasmids were cloned as previously described25. Fab heavy and light chain plasmids were used to transiently co-transfect Expi293F cells (Thermo Fisher Scientific) and Fabs were purified from culture supernatant by immobilized metal affinity chromatography (IMAC) using a HisTrap HP column (Cytiva). Fabs were concentrated and buffer exchanged into TBS (20 mM Tris pH 8.0, 150 mM NaCl) using Amicon 10 kDa spin concentrators (Millipore) and further purified by SEC on a Superdex 200 column (Cytiva) equilibrated with TBS. SEC fractions corresponding to Fab were combined and concentrated.
To produce bispecific IgGs comprising a 007 arm and an anti-CD3 OKT3 arm31, mutations were introduced into the respective IgG1-LS61 constant regions (E357Q and S364K in 007HC and Q295E, L368D, K370S, N384D, Q418E, N421D in OKT3HC) to promote heavy chain heterodimerization and facilitate downstream purification62, and the CH1 and CL domains of the OKT3 antibody were domain swapped to promote correct heavy and light chain pairing of both Fab arms63. Heavy and light chain plasmids were mixed in equal amounts (50 µg of each of the four plasmids per 200 ml transfection culture) and used to transiently co-transfect Expi293F cells (Thermo Fisher Scientific). IgGs were purified from cell culture supernatant using a MabSelect SuRe (Cytiva) affinity column and were concentrated and buffer exchanged into 50 mM Tris, pH 8.7 using 10 kDa Amicon spin concentrators (Millipore). Bispecific IgGs were purified by anion exchange chromatography using a HiTrap Q column (Cytiva) and eluted with a NaCl gradient. Fractions corresponding to the bispecific IgG were combined and concentrated before SEC purification using a Superdex 200 column (Cytiva) equilibrated in TBS.
Expression and purification of BG505 SOSIP trimers
BG505 (ref. 20) and BG505-DS64,65 SOSIPs used for cryo-EM, mass spectrometry and SPR experiments were expressed via transient co-transfection of Expi293F cells with a plasmid encoding soluble furin. Briefly, SOSIPs were purified from cell culture supernatant by either PGT145 or 2G12 immunoaffinity chromatography, dialyzed in TBS, concentrated to <2 ml and purified by SEC on a Superose 6 Increase column (Cytiva). SEC fractions corresponding to trimeric SOSIPs were combined and concentrated.
Quantification of unpurified mAbs from cell supernatants by human IgG capture ELISA
A human IgG capture ELISA was employed to measure antibody concentrations in unpurified supernatants from transfected HEK293-6E cells, with slight modifications to established protocols21. ELISA plates (Greiner Bio-One) were coated with 2.5 µg ml−1 polyclonal goat anti-human IgG (Jackson ImmunoResearch) in PBS and incubated for at least 45 min at 37 °C or alternatively overnight at 4 °C. Following the coating step, plates were blocked for 60 min at room temperature (RT) with a blocking buffer (BB) composed of PBS supplemented with 5% nonfat dry milk powder (Carl Roth, T145.2). Supernatants from transfected HEK293-6E cells were diluted 1:20 in BB before analysis, while a human myeloma IgG1 kappa standard (Sigma-Aldrich) was prepared at an initial concentration of 4 µg ml−1 in BB. Both samples and standards were subjected to serial 1:3 dilutions in BB and incubated for 45 min at RT. Detection was performed using an horseradish peroxidase-conjugated anti-human IgG antibody (Southern Biotech 2040-05) diluted 1:2,500 in BB. Colorimetric development was initiated by the addition of ABTS substrate (Thermo Fisher Scientific, 002024), and absorbance was measured at 415 nm and 695 nm using a microplate reader (Tecan). Antibody concentrations in the supernatants were calculated by interpolation from the human IgG1 standard curve.
Generation of HIV-1 pseudoviruses
HIV-1 pseudoviruses were produced in HEK293T cells by co-transfection with pSG3∆env (NIBSC, #2003) and the respective HIV-1 Env plasmids as previously described19,23,39,66. A synthetic HIV-1ADA Env plasmid was obtained from Twist Bioscience for the production of HIV-1ADA pseudoviruses containing point mutations identified through in vivo single-genome sequencing (SGS) analysis. In HIV-1 BG505T332N and Tro11 site-specific mutations were introduced using the Q5 Site-Directed Mutagenesis Kit (New England Biolabs) according to the manufacturer’s instructions. Kifunensine-treated pseudoviruses were produced under presence of 5 µg ml−1 Kifunensine. Supernatants containing Kifunensine-treated pseudoviruses were harvested 3 days after transfection and stored at −80 °C.
Generation of mutant HIV-1 pseudoviruses
Mutant variants of HIV-1 pseudoviruses were generated by introducing site-specific mutations into gp160 expression plasmids. Point mutations were incorporated using the Q5 Site-Directed Mutagenesis Kit (New England Biolabs) following the manufacturer’s protocol. The resulting mutant plasmids were subsequently used for pseudovirus production, following the protocol as described above for wild-type pseudoviruses66.
Determination of neutralizing activity by luciferase-based TZM-bl assays
Neutralization assays were performed to determine the IC₅₀ and IC₈₀ values of purified mAbs and to assess neutralizing activity in unpurified HEK293-6E cell culture supernatants. These assays were performed with slight modifications to previously described protocols66,67,68. Purified mAbs, serum IgGs, or HEK293-6E cell culture supernatants were preincubated with HIV-1 pseudovirus strains for 1 h at 37 °C before adding 104 TZM-bl cells per well in a 96-well plate. After 48 h of incubation at 37 °C with 5% CO2, luciferase activity was measured using a luciferin/lysis buffer. Background RLUs from non-infected control wells were subtracted, and the percentage of neutralization was calculated. For screening unpurified IgGs in HEK293-6E cell supernatants, a final IgG concentration of 2.5 µg ml−1 was used, as determined by human IgG capture ELISA. For large-scale donor screening, IgGs isolated from participant samples were tested against each pseudovirus at a fixed concentration of 300 µg ml−1 in duplicate wells. IC50 and IC80 values for mAbs were determined by performing serial dilutions starting at 10, 25 or 50 µg ml−1. These values, representing the mAb concentration required to reduce viral signal by 50% or 80%, were calculated using a dose-response curve fitted in GraphPad Prism. All IC50 and IC80 determinations were performed in duplicates for each mAb.
MNR assays
Pseudovirus neutralization assays were conducted using TZM-bl reporter cells as above and as previously described67,68. IgGs, bispecifics, and Fabs were evaluated in duplicate with an eight-point, fivefold dilution series starting at a top concentration of 2, 5, or 50 μg ml−1. 007 antibodies were expressed and purified within 3 weeks of neutralization assays. The dilution at which 50% of virus was neutralized (IC50) is reported in micrograms per milliliter and molar concentrations in Supplementary Table 10. MNRs were calculated as the ratio of molar IC50 values for different formats of the antibody.
Determination of antibody interference by competition ELISAs
To assess antibody interference, mAbs were biotinylated using the EZ-Link Sulfo-NHS-Biotin Kit (Thermo Fisher Scientific) according to the manufacturer’s protocol. Excess biotin was removed by buffer exchange into PBS using Amicon 10 kDa centrifugal filter membranes (Millipore). High-binding ELISA plates (Greiner Bio-One) were coated overnight at 4 °C with an anti-6×His tag antibody (Abcam, 9108) at a final concentration of 2 µg ml−1. After coating, plates were blocked for 1 h at 37 °C with PBS supplemented with 3% bovine serum albumin (BSA; Sigma-Aldrich) to prevent nonspecific binding. BG505SOSIP.664-His protein was then added at 2 µg ml−1 in PBS and incubated for 1 h at RT to facilitate antigen capture. To evaluate competition, unlabeled antibodies were applied at an initial concentration of 32 µg ml−1 in PBS and subjected to a 1:3 serial dilution. After a 1-h incubation at RT, biotinylated mAbs were introduced at 0.5 µg ml−1 in PBS containing 3% BSA, followed by another 1-h incubation at RT. Detection was performed using peroxidase-conjugated streptavidin (Jackson ImmunoResearch) diluted 1:5,000 in PBS containing 1% BSA and 0.05% Tween-20. Between each incubation step, wells were thoroughly washed with PBS containing 0.05% Tween-20 (Carl Roth) to remove unbound components. Colorimetric detection was achieved using ABTS substrate solution (Thermo Fisher Scientific 002024), and absorbance was measured at 415 nm and 695 nm using a microplate reader (Tecan).
Neutralization fingerprint analyses
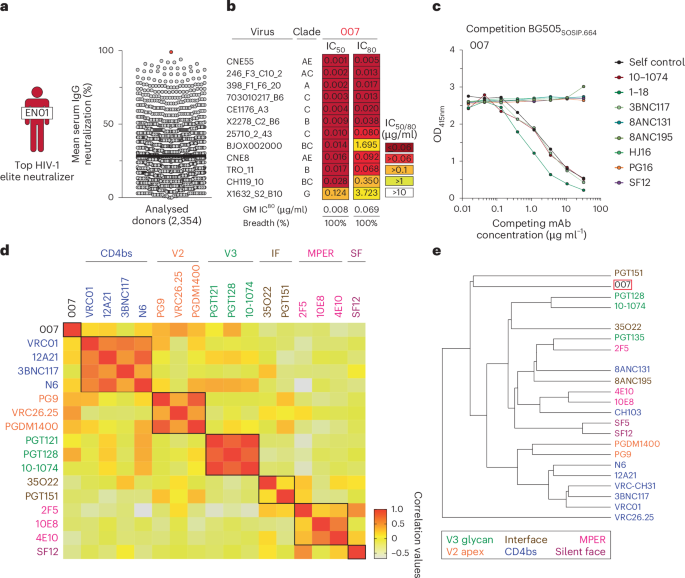
The neutralizing activity against the f61 pseudovirus19 panel was analyzed by calculating Spearman correlation coefficients for each pair of antibodies based on their neutralization data, and visualizing the results as a heatmap (Fig. 1d). Neutralization fingerprint analysis (Fig. 1e) was performed based on a diverse panel of 119 HIV-1 strains for which IC50s were available for all antibodies using an approach described previously 69. An antibody-antibody distance matrix was calculated pairwise as the sum over the panel of the absolute differences of the log IC50s. The dendrogram was calculated from this distance matrix using hierarchical clustering by the R command “hclust” using the “average” method.
Assessment of autoreactivity in HEp-2 cell assays
Autoreactivity of mAbs was evaluated using the NOVA Lite HEp-2 ANA Kit (Inova Diagnostics) following the manufacturer’s protocol. Antibodies were applied at a final concentration of 100 µg ml−1 in PBS to HEp-2 cell-coated slides. After incubation and subsequent washing steps, fluorescence imaging was performed using a DMI 6000 B fluorescence microscope (Leica) under standardized conditions: a 3-s exposure time, 100% light intensity and a gain setting of 10. Fluorescent signals were analyzed to determine autoreactivity profiles.
Cryo-EM sample preparation
007 Fab was incubated in a 3.4:1 molar ratio of Fab to BG505-DS SOSIP trimer64,65 and incubated overnight at room temperature. SOSIP trimers and Fab-SOSIP complexes were purified from unbound Fabs on a Superose 6 10/300 Increase column (Cytiva) operating in TBS and concentrated using a 30 kDa spin concentrator to ~3.4 mg ml−1 immediately before vitrification. 007 IgG1 was added to BG505 SOSIP at a 1:1 molar ratio of IgG to BG505 SOSIP trimer, with a total protein concentration of ~2.6 mg ml−1 and vitrified after incubating for ~38 h at room temperature.
Octyl-maltoside, fluorinated solution (Anatrace) was added to 0.02% (w/v) final concentration for each sample immediately before addition of 3 µl to a Quantifoil R1.2/1.3 Cu 300 mesh grid (Electron Microscopy Sciences) that had been glow discharged for 1 min at 20 mA using a PELCO easiGlow (Ted Pella). Grids were blotted for 3 to 4 s with Whatman No. 1 filter paper and vitrified in liquid ethane using a Mark IV Vitrobot (Thermo Fisher Scientific) operating at 22 °C and 100% humidity.
Cryo-EM data collection and processing
Data for the 007 Fab-SOSIP sample were collected on a 300 keV Titan Krios transmission electron microscope (Thermo Fisher) equipped with a Gatan BioQuantum Energy Filter and a K3 6k x 4k direct electron detector, and data for the 007 IgG1-SOSIP sample were collected on a 200 keV Talos Arctica (Thermo Fisher Scientific) equipped with a Gatan K3 6k x 4k direct electron detector. 40-frame movies were collected in SerialEM70. 007 Fab-SOSIP movies were recorded in super-resolution (0.416 Å per pixel) using a 3 × 3 beam image shift pattern with 3 shots per hole and 007 IgG-SOSIP movies were recorded in super-resolution (0.72 Å per pixel) with a 3 × 3 beam image shift pattern and 1 shot per hole.
Data collection and processing details are included in Supplementary Table 8 and Extended Data Figs. 3 and 7. Motion correction, CTF estimation, particle picking and particle extraction were performed in cryoSPARC Live v4 (ref. 71). Extracted particles were subject to 2D classification in cryoSPARC71 and particles from select 2D classes processed by 3D classification in RELION v4.0.1 (refs. 72,73). Particles from select 3D classes were re-extracted in cryoSPARC and subject to ab initio reconstruction and non-uniform refinement71,74. Particles underwent reference-based motion correction and were subject to a final round of non-uniform refinements74.
Model building and refinement
Initial coordinates for the 1 Fab-bound trimer structure were generated by docking individual protein chains from reference structures (PDB 5BZD (VH), 7PS3 (VL), and 6UDJ (BG505)) into the corresponding EM density in ChimeraX75,76. The initial model was sequence corrected in Coot77 and underwent iterative rounds of refinement in Phenix78 and Coot77. Glycans were built in Coot79 and glycan geometries evaluated in Privateer80. Coordinates for the 1 Fab-bound trimer aided in generating trimer structures with 0, 2 or 3-bound Fabs, as well as the 3 IgG-bound trimer-dimer structure. To facilitate measurements between the C-termini of the Fab heavy chains, the Fab CHCL domains from PDB 8UKI were docked into the corresponding densities in the 2 Fab-bound trimer structure and the 3 IgG-bound trimer-dimer structure. Antibodies were numbered according to Kabat.
Structural analyses
Figures were prepared using UCSF ChimeraX v1.9 (refs. 75,76). 007 Fab-Env interactions were evaluated using the 1 Fab-bound trimer structure. Distance measurements between C termini of Fab HCs were taken from the alpha carbon of R222 in either the 2 Fab-bound trimer structure or the 3 IgG-bound trimer-dimer structure. Coordinates for a 007-bound gp120 were aligned to two gp120 chains in a b12-bound trimer structure (PDB 5VN8)81 to model the analogous distance on an occluded-open conformation of the trimer. The distance between trimer apexes reported for the trimer-dimer structure was measured between residues N188 on opposing trimers.
SPR
SPR measurements were performed on a Biacore T200 (GE Healthcare) at 25 °C in HBSEP+ (10 mM Hepes, 150 mM NaCl, 3 mM EDTA and 0.005% Tween-20) (GE Healthcare) running buffer. BG505 and BG505-DS SOSIPs were directly immobilized on a CM5 chip (GE Healthcare) to ~500 resonance units using primary amine chemistry. Fab samples were injected over the flow cells at increasing concentrations (threefold dilution series with a top concentration of 10 μM or 1 µM) at a flow rate of 60 μl min−1 for 60 s and allowed to dissociate for 300 s. Regeneration of flow cells was achieved by injecting one pulse of 10 mM glycine pH 2.0 at a flow rate of 90 μl min−1. All samples were performed in duplicate and a representative sensorgram is plotted in Extended Data Fig. 6a. Kinetic constants and affinities were derived using the Biacore T200 Evaluation Software (v2.0) with a 1:1 binding model.
Immunoprecipitation for site-specific N-glycan analyses
To isolate BG505 trimers recognized by 007IgG (007IgG-bound BG505), we developed an optimized protocol for immunoprecipitation. Briefly, BG505 and 007IgG were mixed at a 1:2 (w:w) ratio and incubated overnight at 4 °C in 20 mM sodium phosphate buffer (pH 7.2). 007IgG-bound BG505 complexes were isolated using affinity chromatography (Protein G Sepharose; GE Healthcare Life Sciences). Protein G Sepharose was equilibrated with 20 mM sodium phosphate buffer (pH 7.2) and incubated overnight at 4 °C with the preincubated mixture of BG505 and 007IgG. 007IgG-BG505 complexes captured by Protein G Sepharose were separated from unbound BG505 by centrifugation at 1,000 x g for 3 min, eluted with 0.1 M glycine (pH 2.5) and neutralized with 1 M Tris-HCl (pH 9.0). Samples were then stored at −20 °C.
Enzymatic removal of N-glycans from Env BG505 SOSIP
Total BG505 and 007IgG-bound BG505 samples were denatured for 10 min at 100 °C in a denaturing buffer provided with peptide N-glycosidase F (PNGase F, Prozyme). After samples were chilled on ice for 5 min, PNGase F was added together with detergent following the manufacturer’s instructions (PNGase F, Prozyme). Samples were then incubated at 37 °C for 30 h.
Isolation of gp120 component chains of BG505 SOSIP for LC-MS
Total BG505 and 007IgG-bound BG505 samples were separated by SDS-PAGE under reducing conditions on 10% Mini-PROTEAN TGX precast gels (Bio-Rad Laboratory). Gels were briefly washed with water and stained with Bio-safe colloidal Coomassie G-250 Stain (Bio-Rad Laboratories). After destaining, protein bands corresponding to natively glycosylated gp120 (~130 kDa) or samples deglycosylated with PNGase F (~65 kDa) were excised from the gel and stored at −20 °C for LC-MS analyses (Extended Data Fig. 5).
LC-MS and MS/MS analysis of gp120
The excised bands were digested with trypsin (Promega) and extracted from the gel matrix by use of standard in-gel protease digestion methods82,83. The resulting peptide/glycopeptide mixtures were analytically separated on a self-prepared C18 reversed-phase pulled-tip column using a nano-liquid chromatography (nano-LC) system as previously described82,83. The eluted glycopeptides were electrosprayed at 2 kV into a dual linear quadrupole ion trap Orbitrap Velos Pro mass spectrometer (Thermo Fisher Scientific). The mass spectrometer was set to switch between a full scan (400 < m/z < 2,000) followed by successive MS/MS (200 < m/z < 2,000) scans of the 10 most abundant precursor ions using the collision-induced dissociation method.
Glycopeptide identification and quantitation
Site-specific N-glycan heterogeneity profiles of gp120 from total BG505 and 007IgG-bound BG505 samples were determined using a workflow similar to that used before82,83, which consisted of three main steps.
Step 1. Initial glycopeptide identification
LC-MS/MS data for the deglycosylated gp120 were analyzed using the Single Protein Screening and Quantitation workflow in the Pinnacle software (version 1.0.103 Optys Tech Corporation). Identification of peptides containing specific N-glycosylation sites (NGSs) was achieved with a peptide tolerance of 10 ppm in MS1 and an MS/MS tolerance of 0.7 Da. All peptide assignments were validated by visual inspection of the associated MS1 and MS/MS spectra. An increase of 1 Da in the peptide mass value of the deglycosylated gp120 indicated the presence of N-glycosylation site with an attached glycan in the intact gp120 because PNGase F treatment converted each glycosylated Asn into Asp. Site occupancy was calculated based on the areas under the curve (AUC) for the peptide containing the unmodified Asn and the peptide containing the Asp.
Step 2. Glycopeptide quantitation
To identify the full range of glycan heterogeneity at specific sites, LC-MS/MS data for the intact gp120 were analyzed using the Targeted Quantitation – Label Free DDA workflow in the Pinnacle software. The search was conducted with a 10-ppm mass accuracy of the three most abundant isotopes with a series of custom peptide and glycopeptide workbooks generated for each NGS. To speed up the validation process and reduce the number of false-positive results, the confirmed deglycosylated peptides from Step 1 were used to limit the retention time window search for each glycopeptide. Once the glycopeptides were identified, the AUC from each glycopeptide was expressed as a percent relative abundance of the total sum of all glycoforms for an NGS.
Step 3. Visualization of N-glycan heterogeneity at specific sites
The entire range of glycans at a single site was presented as a stacked bar divided into the relative distributions of the broad N-glycan categories of high-mannose, hybrid, and complex, using the same color scheme as previously described82. To better visualize changes in glycoforms between total BG505 and 007IgG-bound BG505, a side-by-side bar graph was also included which differentiated each high-mannose glycan but kept the hybrid and complex as single groups. Error bars represent the standard deviations of replicate measurements (three for total BG505 and two for 007IgG-bound BG505). Differences between groups were evaluated for statistical significance based on P values calculated using Welch’s t-test.
Deep mutational scanning
A previously established lentiviral deep mutational scanning platform was utilized to assess the effects of all mutations on HIV Env escape from antibodies41,42. This system employs barcoded pseudoviruses to facilitate comprehensive mutational analysis. The BF520 Env and TRO.11 Env mutant libraries were generated in prior studies17,52 and were reused in the present investigation. Detailed descriptions of the construction and composition of these mutant libraries are available in previous reports41,42. BF520 and TRO.11 Env function of entry into cells and escape from antibody 10-1074 are published in these prior studies41,42. In this study, the BF520 and TRO.11 Env mutant libraries were employed to map escape from antibodies 007, BG18, PGT121 and PGT128. For each mutant library, a small proportion of VSV-G pseudotyped viruses carrying unique barcodes was introduced as an internal infection control, as these viruses are not susceptible to HIV-1-specific antibodies. Each library was incubated for 1 h with antibodies at concentrations ranging from IC₉₀ to IC₉₉.₉, alongside a control incubation without antibody. TZM-bl cells were then infected with the antibody-treated pseudovirus libraries, and 12 h after infection, unintegrated lentiviral genomes were extracted using a miniprep approach. Variant barcodes were subsequently amplified and sequenced following previously established protocols42.
Deep mutational scanning data analysis
Deep mutational scanning data were analyzed using dms-vep-pipeline-3 version 3.20.1. See https://github.com/dms-vep/HIV_Envelope_TRO11_DMS_007 and https://github.com/dms-vep/HIV_Envelope_BF520_DMS_007 for GitHub repositories containing the analyses of the deep mutational scanning data. See https://dms-vep.org/HIV_Envelope_TRO11_DMS_007 and https://dms-vep.org/HIV_Envelope_BF520_DMS_007 for HTML renderings of key analyses, plots and data files produced by the analyses. Effects of mutations on Env function of entry into cells measured in prior studies41,42 were used to shade the logoplots in Fig. 5 and Extended Data Fig. 8c Illumina sequencing data of variant barcodes from antibody selection experiments were processed following previously established methods42. A comprehensive description of sequencing analyses and modeling of mutation effects is provided in Radford et al.42, which should be consulted for methodological details. Briefly, the non-neutralized fraction of each barcoded variant was calculated in each antibody selection by comparing the frequency of each barcoded variant to the frequency of the non-neutralized standard viruses between the antibody incubation and mock incubation conditions. The software package polyclonal84 version 6.14 was used to model the escape effects of individual mutations for each antibody. In Fig. 5a and Extended Data Fig. 8c the height of each amino acid in each logo plot represents the effect of that individual mutation on escape from that antibody, where taller letters represent more escape. The model of the effects of mutations on escape can also be used to predict the level of neutralization of Env mutants at arbitrary antibody concentrations, which we used to calculate the deep mutational scanning measured log fold change in IC50 values in Fig. 5b.
FcγRIIIa signaling Promega assay
Signaling through FcγR was assessed using an ADCC reporter bioassay from Promega (Promega, G9790 (FcγRIIIa-F), G7010(FcγRIIIa-V)). CHO cells overexpressing HIV JRFL envelope (CHO-HIV JRFL ENV) were used as targets. HIV bnAbs were serially diluted 4-fold and added to target cells, 30 min before addition of Jurkat reporter cells. After overnight incubation at 37°C, luminescence was measured using the Bio-Glo-TM Luciferase Assay Reagent according to the manufacturer’s instructions.
ADCC assay
NK cells were isolated from whole blood using the EasySep Direct Human NK Cell Isolation Kit (StemCell Technologies, #19665) following the manufacturer’s instructions. CHO-HIV JRFL ENV were incubated with titrated HIV bNAbs prior to addition of effector NK cells at 8:1 (FV NK donor) or 9:1 (FF NK donor) in AIM V Medium (Life Technologies, #12055091). Each Ab concentration was tested in duplicate. After 4-h incubation at 37 °C, plate was centrifuged and supernatants transferred to a new plate containing the LDH substrate prepared according to manufacturer’s instructions (Roche, #11644793001 Cytotoxicity Detection Kit (LDH)). Spontaneous release was determined by incubating target cells with medium alone, and maximal lysis by incubation with 1% Triton X-100. Kinetic Absorbance was measured at 492 and 650 nm with a microplate reader, and cytotoxicity was determined using the following equation:
$$\begin{array}{l}{\rm{Percent}}\,{\rm{killing}}\\ =({\rm{experimental}}-{\rm{spontaneous}})/({\rm{maximal}}-{\rm{spontaneous}})\times 100\end{array}$$
Generation of replication-competent HIV-1 virus
Recombinant, replication-competent HIV-1ADA variant, incorporating the ADA Env within an NL4-3 backbone, was produced by transfecting HEK293T cells using FuGENE 6 Transfection Reagent (Promega). Virus-containing supernatants were harvested at 48 and 72 h after transfection, then aliquoted and stored at −80 °C for subsequent experiments.
HIV-1 infection of humanized mice and viral load quantification
Humanized NRG mice were infected intraperitoneally with replication-competent HIV-1ADA. At 32 days post-infection, sterile monoclonal antibodies were administered subcutaneously in PBS. A loading dose of 1 mg was initially delivered, followed by maintenance doses of 0.5 mg every 3 to 4 days. To determine viral loads, viral RNA was extracted from EDTA-treated plasma samples using the MinElute Virus Spin Kit (Qiagen), with DNase I treatment (Qiagen) performed on an automated Qiacube system (Qiagen). pol-specific primers 5′-TAATGGCAGCAATTTCACCA-3′ and 5′-GAATGCCAAATTCCTGCTTGA-3′, along with the probe 5′/56-FAM/CCCACCAACARGCRGCCTTAACTG/ZenDQ/, as previously described85. qRT-PCR was performed using a QuantStudio 5 instrument (Thermo Fisher Scientific) with the TaqMan RNA-to-CT 1-Step Kit (Thermo Fisher Scientific). Heat-inactivated supernatants of replication-competent HIV-1YU2 propagated in MOLT-CCR5 cells, were included in each PCR run as a standard for viral load quantification. The viral concentration of this standard was determined using the the Cobas 6800 HIV-1 kit (Roche). The quantification limit for qRT-PCR was established at 260 copies ml−1. To calculate log10 changes in viral load, values below this threshold were assigned a concentration of 260 copies ml−1. For normalization, the mean log10 viral load change of the PBS control group at each corresponding time point was subtracted from the individual log10 viral load changes of the treatment groups.
Single-genome sequencing of plasma HIV-1 env from in vivo experiments
Single-genome sequencing (SGS) of HIV-1 env genes was conducted following previously established protocols86. Briefly, viral RNA was extracted from EDTA-treated plasma samples using the MinElute Virus Spin Kit (Qiagen), followed by DNase I treatment (Qiagen) on an automated Qiacube system (Qiagen). Reverse transcription was performed using the antisense primer YB383 (5′-TTTTTTTTTTTTTTTTTTTTTTTTRAAGCAC-3′) and SuperScript IV reverse transcriptase (Thermo Fisher Scientific) according to the manufacturer’s instructions. To degrade residual RNA, the reaction was treated with 0.25 U µl−1 RNase H (Thermo Fisher Scientific) at 37 °C for 20 min. The resulting cDNA encoding HIV-1 Env was subjected to serial dilution before nested PCR amplification using PlatinumTaq Green HotStart polymerase (Thermo Fisher Scientific) with HIV-1ADA-NL4-3-specific primers. The first-round PCR utilized primers YB383 and YB50 (5′-GGCTTAGGCATCTCCTATGGCAGGAAGAA-3′) with the following thermocycling conditions: an initial denaturation at 94 °C for 2 min, followed by 35 cycles of 94 °C for 30 s, 55 °C for 30 s and 72 °C for 4 min, with a final extension at 72 °C for 15 min. The second-round PCR was performed using 1 µl of the first-round product as the template, with primers YB49 (5′-TAGAAAGAGCAGAAGACAGTGGCAATGA-3′) and YB52 (5′-GGTGTGTAGTTCTGCCAATCAGGGAAGWAGCCTTGTG-3′). The cycling conditions were similar to the first PCR, except the reaction was run for 45 cycles. PCR products from reactions demonstrating an amplification efficiency of less than 30% were selected for Sanger sequencing.
In vivo pharmacokinetic analysis
To determine the half-life of administered antibodies, human FcRn transgenic mice (B6.Cg-Fcgrttm1DcrPrkdcscidTg(FCGRT)32Dcr/DcrJ, Jackson Laboratory; n = 12, all female) (The Jackson Laboratory) were injected intravenously with 0.5 mg sterile antibody in PBS via the tail vein. Human IgG concentrations in serum were quantified using an ELISA assay with slight modifications to previously established methods51. For quantification, high-binding ELISA plates (Corning) were coated overnight at RT with 2.5 µg ml−1 of anti-human IgG (Jackson ImmunoResearch). Plates were then blocked for 1 h at RT with a blocking buffer containing 2% BSA (Carl Roth), 1 µM EDTA (Thermo Fisher Scientific), and 0.1% Tween-20 (Carl Roth) in PBS to minimize nonspecific binding. A standard curve was generated using human IgG1 kappa purified from myeloma plasma (Sigma-Aldrich) and serially diluted in PBS. Serum or plasma samples, along with standard dilutions, were incubated on the plates for 90 min at RT. This was followed by a 90-minute incubation with horseradish peroxidase-conjugated anti-human IgG (Jackson ImmunoResearch) at a 1:1,000 dilution in blocking buffer. Colorimetric detection was performed using ABTS substrate (Thermo Fisher Scientific), and absorbance was measured at 415 nm using a Tecan microplate reader. Each step included washing with 0.05% Tween-20 in PBS. Baseline serum or plasma samples confirmed the absence of human serum or plasma IgG before antibody injection.
Quantification and statistical analysis
Flow cytometry data were processed and analyzed using FlowJo v10 software. Statistical analyses were conducted using GraphPad Prism (versions 7 and 8), Python (v3.6.8), R (v4.0.0) and Microsoft Excel for Mac (versions 14.7.3 and 16.4.8).
For clonal sequence evaluation, complementarity-determining region 3 of the heavy chain (CDRH3) lengths, V gene usage and germline identity distributions were assessed across all input sequences without additional sequence collapsing.
Use of large language models
ChatGPT (v.4 and v.5) was used for general editorial tasks, including proofreading, grammar correction and text summarization. Scientific content and conclusions are the work of the authors.
Inclusion and ethics
Research has been conducted and authorships have been determined in alignment with the Global Code of Conduct for Research in Resource-Poor Settings.
Reporting summary
Further information on research design is available in the Nature Portfolio Reporting Summary linked to this article.