
Antigen and adjuvants
Full-length recombinant SARS-CoV-2 S protein from Pango lineage A (S-910823; Ag) was expressed using a baculovirus expression vector system, as described previously35,36,37. Briefly, the S-910823 protein was extracted from baculovirus-infected cells and purified by affinity and hydrophobic interaction chromatography. Host-cell DNA and baculoviruses were removed by Q membrane chromatography. Oil-in-water emulsion adjuvant A-910823 and A-910823 excluding α-tocopherol (A-910823 without α-tocopherol) were prepared at Shionogi & Co., Ltd. (Osaka, Japan) by high-pressure homogenization, as described previously11,38,39. BODIPY-labeled A-910823 (A-910823-BODIPY), containing 0.1% BODIPY-labeled α-tocopherol of the total α-tocopherol content, was prepared by Shionogi & Co., Ltd. BODIPY-labeled α-tocopherol was synthesized by covalently modifying the hydroxyl groups of α-tocopherol using 6-(Boc-amino) hexyl bromide (#89171, Sigma-Aldrich, Burlington, MA, USA) and BDP FL NHS ester (#D5555, Tokyo Chemical Industry Co., Ltd., Tokyo, Japan). BODIPY-labeled α-tocopherol was added to the oil phase of squalene, α-tocopherol, and polysorbate 80, and the subsequent manufacturing process was carried out as described previously11. The average diameter and polydispersity index were measured as described previously11. The fluorescence spectrum of A-910823-BODIPY was measured using a microplate reader with 480 nm-excitation.
Animals and immunization procedures
C57BL/6JJcl mice (6–8 weeks old) were purchased from CLEA Japan, Inc. (Tokyo, Japan). Myd88 KO mice, Tlr2 KO mice, Tlr4 KO mice, and Tlr9 KO mice on a C57BL/6 background were obtained from Oriental Bioservice (Kyoto, Japan). Il1a KO mice were obtained from the Center for Animal Disease Models, Tokyo University of Science40. Il1r1 KO mice were obtained as described previously41. Tlr7 KO mice were provided by Dr. Shizuo Akira (Osaka University, Suita, Japan). Il1rn KO mice, Myd88flox mice, Cd11ccre transgenic mice, and LysMcre transgenic mice were purchased from Jackson Laboratory (Bar Harbor, ME, USA). Breeding colonies were maintained by mating Myd88f/f with Cd11ccre–Myd88f/f mice or LysMcre–Myd88f/f mice and the Myd88f/f littermates were used as control mice42. All mouse experiments were performed in accordance with the appropriate laws and guidelines approved by the Institute of Medical Science at the University of Tokyo (Tokyo, Japan; approval no. PA21-46) and the Institutional Animal Care and Use Committee of Shionogi & Co., Ltd (approval no. S19017D). After anesthetization, mice received an IM injection of the following into the gastrocnemius muscle: Ag (1 μg) in 50 μL PBS solution (antigen-alone group); Ag (1 μg) in 25 μL PBS solution mixed with A-910823 (25 μL); Ag (1 μg) in 25 μL PBS solution mixed with A-910823 without α-tocopherol (25 μL); Ag (1 μg) in 25 μL PBS solution mixed with AddaS03 (25 μL; InvivoGen, San Diego, CA, USA); Ag (1 μg) in 25 μL PBS solution mixed with AddaVax (25 μL; InvivoGen); Ag (1 μg) in 2.5 μL PBS solution mixed with AS01 (47.5 μL; GlaxoSmithKline K. K., UK); and Ag (1 μg) in alum (250 μg; InvivoGen). Il1rn KO mice received Ag (1 μg) in 45 μL PBS solution mixed with A-910823 (5 μL) by IM injection into the gastrocnemius muscle. This reduction in dosage was made in anticipation of stronger adverse reactions in Il1rn KO mice compared to control mice. Treatments were administered in the right hind limb on days 0 and 14 to assess neutralizing antibody titers, Tfh cells, GCB cells, IFN-γ and IL-4 positive cells, swelling score, and body temperature, and dissections were conducted on day 28. Other experiments involved a single administration, and dissections were carried out at the times described in the Methods, Results, and Figure legends. A summary of the immunization schemes, injection and endpoint time points, and the organs/tissues collected for each experiment is provided in Table 1.
RNA-seq
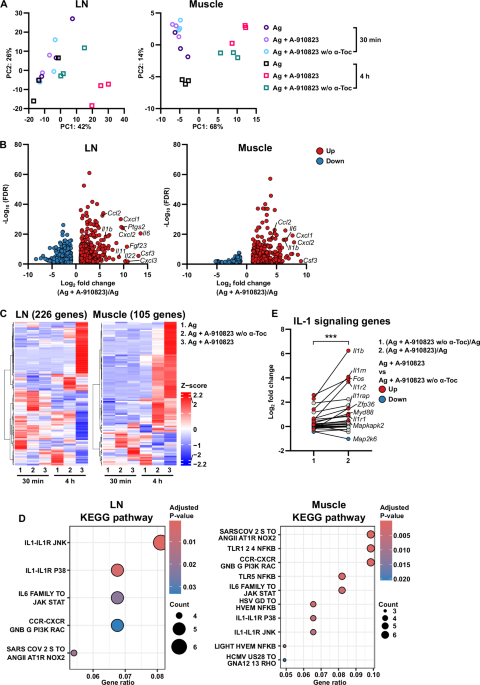
Mice were administered Ag alone, Ag with A-910823, and Ag with A-910823 without α-tocopherol IM, and the muscles and the iliac LNs (collected as the draining LNs) were collected at 30 min and 4 h later. The muscles were homogenized in QIAzol Lysis Reagent (Qiagen, Hilden, Germany) using a TissueRuptor II (Qiagen), and the LNs were homogenized using a BiomusherII (Nippi Research Institute of Biomatrix, Ibaraki, Japan), followed by the addition of chloroform. The samples were then centrifuged at 12,000 × g for 15 min, the aqueous phase was transferred to a new tube, and isopropanol was added and mixed. The mixture was centrifuged at 12,000 × g for 10 min, the supernatant was aspirated, ethanol was added, and the mixture was centrifuged again at 12,000 × g for 5 min. The supernatant was removed, and the RNA pellet was air-dried. The RNA was then purified using an RNeasy Plus kit (Qiagen) following the manufacturer’s instructions, and the concentration and purity were measured using a NanoDrop one (Thermo Fisher Scientific, Waltham, MA, USA). The sequence library was prepared using SMART-Seq® mRNA LP (Takara) with purified RNA, following the manufacturer’s instructions, and sequenced on a NextSeq 2000 (Illumina) with 61-bp paired-end reads. The sequence reads were mapped to GRCm39 (Release M34 from the GENCODE project) using STAR43 after trimming of adapters, polyG, polyX, and trimming one base from the tail of the sequences using fastp44 to generate the sequence alignment map files. The raw read counts for genes were quantified using TPMCalculator45 with the alignment files. The calculation of normalized tag counts, differential gene expression analysis, and PCA were performed using the DESeq2 package46 in R. Differentially expressed genes were defined by the criteria log2 fold change ≥1 or ≤−1 and false discovery rate <0.05. Heatmaps illustrating the gene expression pattern were generated using the ComplexHeatmap package47 in R. The gene list of chemokines, cytokines, INFs, ILs, TGF-β, TNF, and their receptors was obtained from the Gene Lists section of ImmPort48. These genes were then converted to their mouse homologs and used in the analysis. Over-representation analysis of signaling pathways from the Gene Ontology biological process49,50 and Kyoto Encyclopedia of Genes and Genomes (KEGG) gene sets51 in the Molecular Signatures Database52,53 was performed using the clusterProfiler package54 in R. For the over-representation analysis, the input mouse genes were converted to their human homologs, because the reference signaling pathways consist of human genes. The gene ratio was obtained by dividing the number of input genes shared with genes in the signaling pathway by the total number of input genes, and adjusted p-values were calculated using the default settings of the package. Conversion of gene homologs between humans and mice was conducted using the Human and Mouse Homology Classes report at the Vertebrate Homology section of the Mouse Genome Informatics (https://www.informatics.jax.org/homology.shtml). To obtain sufficient RNA input and to reduce inter‑individual variability, total RNA for RNA‑seq was prepared by pooling tissues from three mice. This pooling procedure was performed independently three times per experimental group and time point, resulting in three independent pooled biological replicates per condition (n = 3), with a total of nine mice used per group. RNA‑seq libraries were prepared independently from each pooled sample and sequenced once per library.
Specimen preparation
Mice were euthanized, and whole blood, iliac LNs (collected as the draining LNs), muscles, and spleens were obtained. Serum was prepared from the blood samples and stored at −80 °C for subsequent assays. Spleens were dissociated into cell suspensions using a gentleMACS Dissociator (Miltenyi Biotec, Bergisch Gladbach, Germany). RBCs were lysed using Red Blood Cell Lysis Buffer (Roche, Basel, Switzerland), and splenocytes were suspended in RPMI-1640 medium (Nacalai Tesque Inc., Kyoto, Japan) supplemented with 10% FBS (Sigma-Aldrich). Draining LNs were collected, and single-cell suspensions were prepared using BiomusherII (Nippi Research Institute of Biomatrix).
Flow cytometry
Draining LNs were collected on day 28 and at 2, 6, and 14 h post-first immunization to analyze Tfh and GCB cells, and eosinophils, neutrophils, monocytes, and DCs, respectively. Draining LN cells were then washed and incubated with anti-CD16/32 (clone 2.4G2; BD Pharmingen, San Diego, CA, USA) and then stained for viability using a Zombie NIR™ Fixable Viability Kit (BioLegend, San Diego, CA, USA). Cells were surface-stained with the antibody panels listed in Table 2 and then fixed with Fixation Buffer (BioLegend) for intracellular staining of IL-1α and IL-1β. After surface staining, cells were fixed with Fixation Buffer (BioLegend) and stained to detect IL-1α and IL-1β, using a BD LSR II flow cytometer (BD Bioscience, San Jose, CA, USA) or NovoCyte 3000 flow cytometer (Agilent Technologies, Inc., Santa Clara, CA, USA). Data were analyzed using FlowJo (Tree Star, Ashland, OR, USA) or NovoExpress 1.4.0 software (Agilent Technologies, Inc.). The operational phenotype (gating) used to define each population is provided in the final column of Table 2; representative gating strategies are shown in Figs. 6B, S2A, and S3D.
Western blotting and cell sorting
Sorted cells were obtained from one whole spleen per mouse; the entire spleen was processed and stained for sorting. Splenocytes were incubated with anti-CD16/32 (clone 2.4G2; BD Pharmingen) and stained for viability using a Zombie NIR™ Fixable Viability Kit (BioLegend). The cells were then immunostained with the antibodies outlined in Table 2 and the target cells were sorted in a two-way sorting mode and collected into non-coated tubes using a BD Influx cell sorter (BD Biosciences). To ensure high purity of the sorted fraction, a 1.0 drop purity mode with an extra coincidence scale of six was selected. From one spleen we collected at least 200,000 target cells for each sorted fraction; these sorted splenocyte fractions were lysed directly in RIPA buffer (Nacalai Tesque Inc.) containing protease inhibitor cocktail (Nacalai Tesque Inc., 100-fold dilution) for 30 min on ice and used for MyD88 and β-actin detection. The sorted splenocyte lysates were loaded at 100,000 cells per lane for electrophoresis. For IL-1β and β-actin detection from lymphoid tissue, cells obtained from one whole lymph node per mouse were lysed in RIPA buffer and prepared separately; these lymph node lysates were quantified by BCA assay (Thermo Fisher Scientific) and loaded at 10 μg protein per lane. Following the removal of insoluble material by centrifugation, cellular proteins were resolved by 4%–12% sodium dodecyl sulfate–polyacrylamide gel electrophoresis (Thermo Fisher Scientific) under reducing conditions and transferred to polyvinylidene difluoride membranes (Thermo Fisher Scientific). The membranes were then blocked with 5% BSA (Sigma-Aldrich) in Tris-buffered saline containing 0.05% Tween 20 (Sigma-Aldrich) and incubated with anti-β-actin (#3700, 1:5000, Cell Signaling Technology, MA, USA), anti-MyD88 (#4283, 1:1000, Cell Signaling Technology), or anti-IL-1β (#12507, 1:1000, Cell Signaling Technology), followed by peroxidase-conjugated anti-mouse IgG or anti-rabbit IgG antibody (Cell Signaling Technology). Luminol-based detection was conducted using Immobilon Western Chemiluminescent HRP Substrate (Millipore Corporation, Billerica, MA, USA) according to the manufacturer’s instructions, and signals were analyzed using a LAS-4000 mini image analyzer (GE Healthcare, Little Chalfont, UK).
SARS-CoV-2 neutralization assay
Serum levels of neutralizing antibodies were analyzed against ancestral SARS-CoV-2 WK-521 using transmembrane serine protease 2-expressing VeroE6 (VeroE6/TMPRSS2) cells (Japanese Collection of Research Bioresources Cell Bank, Osaka, Japan), as described previously11,37,55. In brief, VeroE6/TMPRSS2 cells were maintained in DMEM (Thermo Fisher Scientific) with heat-inactivated FBS (Corning Inc., Corning, NY, USA) and G418 (Thermo Fisher Scientific). The WK-521 strain of SARS-CoV-2, isolated from a Wuhan traveler (National Institute of Infectious Diseases, Tokyo, Japan)55, was propagated on these cells to prepare virus stocks. Titers were calculated using tissue culture infectious dose 50 (TCID50) assays as previously described on VeroE6/TMPRSS2 cells37. Heat-inactivated serum samples were serially diluted two-fold. Each sample was mixed with an equal volume of viral suspension (2000 TCID50/mL) and incubated for approximately 1 h at room temperature for neutralization. After neutralization, 100 µL of the sample/virus mixtures were dispensed in duplicate into 96-well culture plates. The samples were then incubated with 100 µL of VeroE6/TMPRSS2 cell suspension (3 × 10⁴ cells/well) to obtain a virus titer of 100 TCID50/well. The virus and cell suspension were added to the virus control wells, whereas only the cell suspension was added to the cell control wells. The samples were incubated at 37 °C with 5% CO2 for 3 days. Cell viability was evaluated using CellTiter-Glo 2.0 (Promega, Madison, WI, USA). After removing 100 μL of supernatant from each well, 100 μL of CellTiter-Glo was added, and the samples were incubated at room temperature for approximately 30 min under light-shielded conditions. Next, 100 μL of the mixture was transferred to measurement plates, and the luminescence intensity was measured using an EnSpire 2300 microplate reader (PerkinElmer, Waltham, MA, USA).
ELISpot assay
Antigen-specific cytokine production was measured using ELISpotPLUS kits for mouse IFN-γ and IL-4 (Mabtech, Cincinnati, OH, USA), as described previously11. In brief, ELISpot plates were washed with PBS and blocked with RPMI-1640 medium supplemented with 10% FBS for at least 1 h at room temperature. Spike protein overlapping peptides PepTivator SARS-CoV-2 Prot_S, PepTivator® SARS-CoV-2 Prot_S1, and PepTivator® SARS-CoV-2 Prot_S+ (all from Miltenyi Biotec, Bergisch Gladbach, Germany) were dissolved in distilled water and diluted with RPMI-1640 medium supplemented with 10% FBS at a concentration of 180 pmol/mL per peptide. After removing the blocking solution, 100 µL of peptide solution was added to the ELISpot plates. Distilled water in RPMI-1640 medium supplemented with 10% FBS served as a peptide negative (−) control. Next, 100 µL of splenocyte suspension (3 × 10⁶ cells/mL) was added to each well, and the plates were incubated at room temperature for approximately 30 min, followed by incubation at 37 °C with 5% CO2 overnight. Following five washes with PBS, the samples were incubated with 100 µL of detection antibody solution for 2 h. Following a further five washes with PBS, the samples were incubated with 100 µL of diluted alkaline phosphatase-conjugated streptavidin solution for at least 1 h. Finally, the sample was incubated with 100 µL of the chromogen 5-bromo-4-chloro-3-indolyl phosphate/nitro blue tetrazolium, which was used as a chromogen. The color development was stopped by washing the sample with tap water. The spots were counted using an immunospot S6 UNIVERSAL-V ELISPOT reader (Cellular Technology Limited, Beachwood, OH, USA). The mean spot-forming cell value was calculated for each group. The antigen-specific cytokine production was evaluated by comparing spot-forming cell values of peptide (+) samples with those of peptide (−) control wells.
Evaluation of swelling score at the administration site
Injection-site swelling was scored on a three-point scale as follows: 0, no visible swelling at the injection site or abnormal hind limb movement (Supplementary Movie 1A); 1, visible or palpable swelling at the injection site, accompanied by abnormal hind limb movement (Supplementary Movie 1C) (specifically, the hind limb can still be extended when pulled, but with resistance during extension); 2, more severe condition, characterized by pronounced swelling at the injection site and significant abnormalities in hind limb movement (Supplementary Movie 1B) (extending the hind limb becomes difficult). The swelling score at the administration site was evaluated in vaccinated mice at 6, 12, 24, 48, 72, 96, and 168 h post-administration (Fig. S4A). The administration site was photographed using a 3D scanner coordinate-measuring machine (VL-800; Keyence, Osaka, Japan) (Fig. S4B, C). The X, Y, and Z-axes were defined, and the cross-sectional area and width of the administration site were measured. The Y-axis was defined as the straight line connecting the anterior part of the ankle and the patella, and the Z-axis was defined as the straight line connecting the heel, the base of the middle toe, and the anterior part of the ankle.
Body temperature measurement
Mice were implanted under anesthesia with a nano-tag® (KISSEI COMTEC, Nagano, Japan) equipped with an accelerometer and temperature sensor into the abdominal cavity 1 week prior to vaccine administration. Measurements were conducted at 1-min intervals for 48 h before and after vaccine administration. The vaccination regimen consisted of two intramuscular injections given 2 weeks apart; body temperature analyses focused on the period surrounding the second (day 14) vaccination. Vaccines were administered at 18:00. Activity data from the accelerometer indicated pronounced diurnal variation and activity-dependent temperature fluctuations; therefore, to minimize activity-related noise, we used daytime averages (08:00–19:59) for fever assessment. For baseline control, daytime averages (08:00–19:59) from 2 days before vaccination were calculated and used for pre‑vaccination comparisons. Because vaccination occurred at 18:00, the daytime average on the first calendar day after vaccination (08:00–19:59) spans approximately 14–26 h post-vaccination. Where elapsed-time labels (e.g., 12, 24, and 48 h) are used elsewhere in the manuscript for other assays, they denote hours after vaccination; for body temperature reporting, however, the daytime averages defined above are presented unless an instantaneous time-point is explicitly specified. Some mice received the COX inhibitor diclofenac (30 mg/kg, IP), and control mice received an IP injection of saline at 07:30 on the day after vaccination. Fever induction by A-910823 and its α‑tocopherol dependence measured with the nano‑tag system were confirmed in three independent experiments, yielding consistent quantitative results; other nano‑tag experiments with extremely low throughput (for example, those involving KO mice) were performed once due to practical constraints but produced comparable outcomes after both the first and second vaccine doses.
Histology
Tissue samples from the gastrocnemius muscle at the injection sites were harvested and subsequently fixed with 10% neutral buffered formalin (Mildform 10 N; FUJIFILM Wako Pure Chemical, Osaka, Japan) for 24 h for histopathological analysis. The fixed tissues were then embedded in paraffin to create blocks. These blocks were sectioned into slices with a thickness of 3 µm using a microtome. The resultant sections were then stained with hematoxylin and eosin for visualization. Histopathological changes at the injection sites, including infiltration of inflammatory cells, edema, and necrosis of muscle fibers, were evaluated independently. Edema was scored as follows: 0, no observable changes; 1, presence of lesions in the perimysium or epimysium, along with localized and small lesion area; 2, lesions spreading into the endomysium and presence of plasma components in the epimysium, along with localized but large lesion area, slightly spreading to surrounding tissues; 3, lesions not localized and spreading extensively to surrounding tissues, but with a low frequency; and 4, lesions diffuse and with a high frequency.
In vivo administration of antibodies targeting CCR3, Ly6G, IL-6, and IL-1β
In vivo depletion of eosinophils and neutrophils and neutralization of IL-6 and IL-1β were achieved by IP injection of 200 µg purified mAbs 24 h prior to vaccination. CCR3 (Bio X Cell, Lebanon, NH, USA; clone: 6S2-19-4, Rat IgG2b, λ) and Ly6G (BioLegend; clone: 1A8, Rat IgG2a, κ) mAbs were used to selectively deplete murine eosinophils and murine neutrophils, respectively, and IL-1β (BioLegend; clone: B122, Armenian Hamster IgG) and IL-6 (BioLegend; clone: MP5-20F3, Rat IgG1, κ) mAbs were used to neutralize IL-1β and IL-6, respectively. Control mice were injected IP with an isotype control antibody (Bio X Cell, BioLegend) for an equal duration.
Measurement of cytokine levels
Serum cytokine levels were measured using a Bio-Plex Pro Mouse Cytokine 23-plex Assay kit (Bio-Rad, Hercules, CA, USA), following the manufacturer’s instructions. This study specifically focused on detectingIL-1α, IL-1β, IL-6, and G-CSF among the 23 cytokines provided by the kit. Fluorescence signals were detected using a Bio-Plex system, allowing for precise measurement of cytokine levels. Assay-specific limits of detection (LOD) were 2.17 pg/mL for IL-1α, 2.19 pg/mL for IL-1β, 0.82 pg/mL for IL-6, and 4.61 pg/mL for G-CSF. No measurements exceeded the assay upper limit for any analyte. Values below the LOD were assigned LOD/2 for statistical analyses.
Human whole blood cells
Blood samples were collected from healthy participants following approval by the Institutional Review Board of the Institute of Medical Science, The University of Tokyo (IMSUT) of Medicine (approval no. 2024-15-0620). All participants provided written informed consent. Peripheral blood was collected into sodium-EDTA tubes (TERUMO, Tokyo, Japan) by venous puncture. Following hemolysis with ammonium chloride, cells were seeded into 96-well plates and cultured for 2.5 h in the presence of various adjuvants (0.1%–10% v/v), LPS (1 μg/mL), and IL-5 (10 ng/mL). Eosinophil IL-1α was detected by FCM. Staining with antibodies against cell surface markers was carried out according to Table 2. Following cell surface staining, cells were fixed with Fixation Buffer (BioLegend) and subjected to ICS with IL-1α antibody (Table 2).
Reproducibility and statistics
Differences between two groups were analyzed by two-tailed Student’s t tests, and differences among multiple groups were analyzed by one-way analysis of variance (ANOVA) followed by Tukey’s multiple comparison test; multiple groups with two influencing factors were compared using two-way ANOVA. For RNA-seq analyses, differential expression was assessed using DESeq2 based on three independent pooled biological replicates per group. For selected comparisons within predefined gene sets, paired data from RNA-seq analyses were additionally assessed using Wilcoxon’s matched-pairs signed rank test. Statistical analyses were performed using GraphPad Prism 9 (GraphPad Software Inc, San Diego, CA, USA). Most key experiments were independently repeated 2–3 times with comparable results. Data are presented as mean ± SEM unless otherwise stated. Total RNA for RNA-seq was prepared by pooling tissues from three mice, and this pooling procedure was independently repeated three times per group to generate pooled biological replicates (n = 3). RNA-seq analyses were intended to provide an exploratory overview of transcriptional and pathway-level responses. Key transcriptional changes identified by RNA‑seq (for example, upregulation of Il1a, Il1b, Csf3, Il6) were validated on independent biological replicates at the protein level using Bio-Plex assays (see Fig. S2). Fever induction by the adjuvant and its α-tocopherol dependence measured with the nano-tag system were confirmed in three independent experiments, yielding consistent quantitative results; other nano-tag experiments with extremely low throughput (for example, those involving KO mice or mice receiving neutralizing antibody treatment) were performed once due to practical constraints but produced comparable outcomes after both the first and second vaccine doses.