
Mouse strains and husbandry
Mouse husbandry and experimentation were performed according to protocols approved by the Institutional Animal Care and Use Committee of the Beth Israel Deaconess Medical Center under protocol 072-2020-23 and Harvard Medical School under protocol 1257. Male mice were used for this study. Unless otherwise noted, mice were housed at 22 °C with 40–50% humidity under a 12-h light–dark cycle, with free access to food and water. Mice were fed with either normal chow (Formulab Diet, 5008) or a HFD (Research Diets, D12492i). All strains were on a C57BL/6J background unless otherwise stated. Fndc5 floxed mice were developed with the Texas A&M Institute for Genomic Medicine and crossed with EIIa-cre mice to generate germline deletion of Fndc5 (exons 2 and 3). Experiments were performed with sex- and age-matched global FNDC5-deficient and littermate wild-type control mice. B6.Foxp3-Cre (016959) mice were purchased from The Jackson Laboratory. Il1rl1fl mice were donated by V. Kuchroo. B6.Foxp3-Thy1.1 mice were obtained from A. Rudensky. B6.Il33-Egfp mice were donated by P. Bryce (now commercially available at The Jackson Laboratory with stock no. 30619). Il1rl1Δtreg mice were generated by crossing Il1rl1fl mice with B6.Foxp3-Cre mice, and this mouse line was bred and utilized in the animal facility of the New Research Building at Harvard Medical School. The age, strain and number of mice used in the individual experiments are noted in the corresponding figure legends.
Production of AAV
Mouse irisin (open reading frame 1–140, containing the N-terminal signal peptide) plus a five-amino-acid linker and a C-terminal FLAG-tag was cloned into the pENN.AAV.CB7.CI.pm20d1flag.WPRE.rBG vector (Addgene plasmid no. 132682) to replace pm20d1flag (pENN.AAV.CB7.CI.PM20D1flag.WPRE.rBG was a gift from J. Long; 132682). The final plasmid was sequenced to confirm the correct insertion of irisin open reading frame. AAV (serotype 8) was packaged at the Boston Children’s Hospital Viral Core with a titre of 3.15 × 10¹³ genome copies (GCs) per ml. AAV8-GFP (pENN.AAV.CB7.CI.eGFP.WPRE.rBG) was used as control, obtained from Addgene (105542), and packaged at the Boston Children’s Hospital Viral Core with a titre of 2.10 × 10¹³ GCs per ml.
Tail vein injections
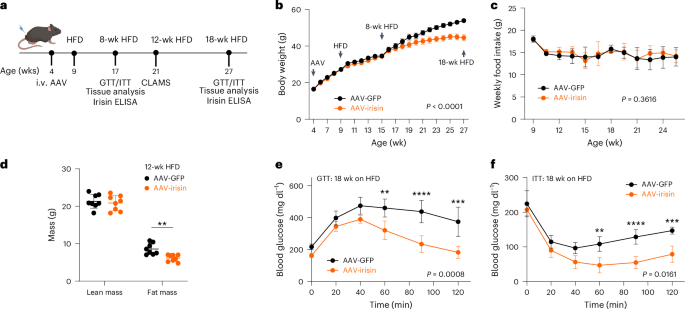
Mice were injected into the tail vein with AAV8-GFP or AAV8-irisin-FLAG (1 × 10¹⁰ GCs per mouse) diluted in PBS to a final volume of 100 μl.
IL-33 treatment
Eight-week-old Fndc5−/− male mice and their wild-type littermates were administered recombinant mouse IL-33 (BioLegend, 580506; 200 ng per mouse in a total volume of 100 μl) or PBS (100 μl) via intraperitoneal injection on day 0 and day 4. Tissues were analysed on day 7.
IL-33trap treatment
Nine-week-old male C57BL/6 mice were injected with AAV8-irisin or AAV8-GFP and switched to a HFD (day 0). The IL-33trap (100 µg per mouse with a total volume of 100 µl) or PBS (100 µl) were injected intraperitoneally on day 2 and day 5. Injections were continued twice a week for a total of 18 weeks until the animals were euthanized.
ELISA
For irisin-FLAG ELISA, blood was collected via the submandibular vein in heparin-coated tubes (365985, BD Microtainer) and then centrifuged. The plasma fraction was collected and stored at −80 °C until analysis. Ninety-six-well plates (R&D, DY990) were coated with an anti-irisin capture antibody (R&D, MAB8880) in PBS overnight at 4 °C. The next day, plates were washed four times with 0.1% PBST and blocked with 1% BSA for 1 h at room temperature (RT). After four washes with 0.1%, PBST, standards (0–1,000 ng ml−1) and plasma samples were added to the plate and incubated for 2 h at RT. Plates were incubated with an anti-FLAG detection antibody for 2 h in RT after washing 4× with 0.1% PBST. Next, the samples were incubated in horseradish peroxidase-linked secondary antibody for 30 min following 4× PBST wash. 3,3’,5,5’-Tetramethylbenzidine chromogen (ab171522, Abcam) was used as a detection system and, finally, the absorbance was measured at 450 nm after adding stop solution (ab171529, Abcam). Measurement was done using a plate reader (FLUOstar Omega, BMG Labtech). Irisin-FLAG concentration was quantified from a standard curve of recombinant irisin-FLAG (AG-40B-0136-C010, Adipogen).
For the IL-33 ELISA, blood was collected via the submandibular vein in heparin-coated tubes (365985, BD Microtainer) and then centrifuged. The plasma fraction was collected and stored at −80 °C until analysis; adipose tissues were homogenized in RIPA buffer (Sigma) and centrifuged at 45,000g for 30 min at 4 °C. Supernatants were taken and measured using the pre-coated 96-well microplate as outlined in the manufacturer’s protocol of the mIL-33 kit (Abcam, ab213475) and was read on a plate reader (FLUOstar Omega, BMG Labtech).
Recombinant protein production
Mouse IL-33trap protein was produced in suspension HEK293 cells (Expi293F cells; Life Technologies, A14527). The cell line was authenticated by maintaining cells below 5 × 10⁶ cells per ml with viability > 95%. Mouse IgG1 control mammalian expression plasmid was used for transient transfection, and the produced IgG1 in the cell culture medium with glycosylation was probed using western blot and SDS–PAGE followed by silver staining. Mycoplasma contamination was tested on a monthly basis to ensure the cell line is mycoplasma free. Expi293F (1 l) cells grown in expression medium (Life Technologies, A1435101) at a density of 2.8 × 10⁶ were transfected with 1 mg pEF-mIL-33-trap DNA plasmid (gift from Beyaert laboratory in Belgium)39, and 3 mg sterile 25-kDa linear PEI mix in Opti-Plex Complexation Buffer (Life Technologies A4096801). Proteins were expressed at 37 °C, 8% CO2, >80% humidity with shaking at 125 rpm for 4 days. Enhancers (Life Technologies, A14524) were added 22 h after transfection to boost protein expression. For IL-33trap protein purification from the Expi293F culture, all the following steps were performed at 4 °C or on ice. Cells were pelleted at 600g for 20 min, and the medium was subjected to an additional 2 h of centrifugation at 1,000g. The supernatant was filtered through a 0.22-μm filter unit and was concentrated tenfold using the Tangential Filtration System with a 50,000-Da molecular weight cut-off (Paul) before being applied to a Ni-Excel affinity column (Cytiva, 17371201) equilibrated in phosphate buffer (10 mM HEPES pH 7.4, 150 mM NaCl, 20 mM imidazole). After thorough washes with wash buffer (10 mM HEPES pH 7.4, 150 mM NaCl, 30 mM imidazole), the column was eluted with elution buffer (10 mM HEPES pH 7.4, 150 mM NaCl, 500 mM imidazole). The eluent was concentrated with a using an Amicon Ultra-15 filter Unit (Millipore) with a 50,000-Da molecular weight cut-off before further purification through a Superdex 200 10/300 GL gel-filtration column (Cytiva, 17517501) equilibrated with PBS buffer. The level of endotoxin was measured using the Toxin Sensor Chromogenic LAL Endotoxin Assay Kit (GeneScript, L00350). Protein was further concentrated to >1 mg ml−1 before being aliquoted, frozen in liquid nitrogen and stored at −80 °C. In all cases, the HEPES pH given is at 23 °C.
Irisin was purified from Expi293 cells, and HSP90α was purified from Escherichia coli as previously described16.
mRNA expression analysis
Total RNA was isolated from inguinal fat or epididymal fat tissues using TRIzol reagent (Invitrogen, 15596018) and RNeasy Mini purification kit (Qiagen, 74104) according to the manufacturer’s protocol. Tissues were homogenized in TRIzol reagent using a bead homogenizer for 20 min at maximum speed (Qiagen, TissueLyser II). DNA was digested on a column using the RNase-Free DNase Set (Qiagen, 79254). RNA was reverse transcribed using the High-Capacity cDNA Reverse Transcription kit with RNase Inhibitor (Applied Biosystems, 4374966). The resulting cDNA was analysed by RT–qPCR using SYBR green fluorescent dye 2× qPCR master mix (Promega) in a QuantStudio 6 Flex Real-Time PCR System (Applied Biosystems). Briefly, cDNA was mixed with 250–500 nmol primers and the GoTaq qPCR System (Promega, A6002). Relative mRNA levels of the gene of interest were normalized to the mRNA level of Rplp0, and fold change was calculated using the ΔΔCt method. Unless stated otherwise, primer sequences (Supplementary Fig. 2) were chosen from PrimerBank63,64,65,66 and have been validated in ref. 16.
Whole-tissue and populational RNA-seq library preparation and data analysis
For adipose tissue RNA-seq, RNA integrity was assessed using the Bioanalyzer 2100 system (Agilent Technologies). Messenger RNA was purified from total RNA using poly-T oligo-attached magnetic beads. After fragmentation, the first-strand cDNA was synthesized using random hexamer primers, and then the second-strand cDNA synthesis was either the same way as the first strand (for non-strand-specific library) or synthesized using dUTP, instead of dTTP to generate the directional library (for strand-specific library). The library was ready after end repair, A-tailing adaptor ligation, size selection, amplification and purification. The library was checked with Qubit and real-time PCR for quantification and bioanalyzer for size distribution detection. After library quality control, different libraries were pooled based on the effective concentration and targeted data amount, then subjected to Illumina sequencing (Illumina NovaSeq 6000). The basic principle of sequencing is ‘Sequencing by Synthesis’, where fluorescently labelled dNTPs, DNA polymerase and adaptor primers are added to the sequencing flow cell for amplification. As each sequencing cluster extends its complementary strand, the addition of each fluorescently labelled dNTP releases a corresponding fluorescence signal. The sequencer captures these fluorescence signals and converts them into sequencing peaks through computer software, thereby obtaining the sequence information of the target fragment.
Raw data (raw reads) of FASTQ format were firstly processed through in-house Perl scripts. In this step, clean data (clean reads) were obtained by removing reads containing adaptors, reads containing ploy-N and low-quality reads from raw data. At the same time, Q20, Q30 and GC content of the clean data were calculated. All the downstream analyses were based on the clean data with high quality. Reference genome and gene model annotation files were downloaded from the genome website directly. An index of the reference genome was built using Hisat2 v2.0.5, and paired-end clean 1 reads were aligned to the reference genome (GRCm38/mm10) using Hisat2 v2.0.5. We selected Hisat2 as the mapping tool because Hisat2 can generate a database of splice junctions based on the gene model annotation file and thus a better mapping result than other non-splice mapping tools. FeatureCounts v1.5.0-p3 was used to count the read numbers mapped to each gene. And then fragments per kilobase of transcript per million mapped reads of each gene was calculated based on the length of the gene and reads count mapped to this gene. The expected number of fragments per kilobase of transcript sequence per millions base pairs sequenced considers the effect of sequencing depth and gene length for the reads count at the same time, and is currently the most commonly used method for estimating gene expression levels.
Differential gene expression testing was performed using the DESeq2 R package (1.20.0). Differential expression analysis for two conditions/groups was performed. DESeq2 provides statistical programmes for determining differential expression in digital gene expression data using models based on negative binomial distribution. The resulting P value is adjusted using the Benjamini and Hochberg method to control the error discovery rate. The corrected P value ≤ 0.05 and |log2(fold change)| ≥ 1 was set as the threshold of significant differential expression. KEGG is a database resource for understanding high-level functions and utilities of the biological system, such as the cell, the organism and the ecosystem, from molecular-level information, especially large-scale molecular datasets generated by genome sequencing and other high-throughput experimental technologies (https://www.genome.jp/kegg/). We used cluster Profiler R package to test the statistical enrichment of differentially expressed genes in KEGG pathways.
For mSCs, 1,000 cells were lysed in 5 μl Buffer TCL (QIAGEN) with 1% 2-mercaptoethanol (Sigma). Library construction and sequencing as well as data processing were performed according to standard Immunological Genome Project protocols (https://www.immgen.org/img/Protocols/ImmGenULI_RNAseq_methods.pdf). Smart-seq2 libraries were prepared and sequenced as previously described. Briefly, RNA was captured and purified using RNAClean XP beads (Beckman Coulter), and polyadenylated mRNA was selected using an anchored oligo(dT) primer (5´-AAGCAGTGGTATCAACGCAGAGTACT30VN-3´). Polyadenylated mRNA was converted to cDNA by the reverse-transcription reaction followed by limited PCR amplification of first-strand cDNA. The Nextera XT DNA Library Preparation Kit (Illumina) was used for Tn5 transposon-based fragmentation followed by PCR amplification for an additional 12 cycles using barcoded primers such that each sample carried a specific combination of Illumina P5 and P7 barcodes. Paired-end sequencing was performed on an Illumina NextSeq 500 (two full NextSeq runs per plate for an average of 10 M raw reads per sample) using two 38-base-pair reads with no further trimming. Reads were aligned to the mouse genome (GENCODE GRCm38/mm10 primary assembly and gene annotations vM16) using STAR 2.7.3a. Transcripts annotated as ribosomal RNA were removed, and gene-level quantification was calculated using the Subread 2.0 command featureCounts. The DESeq2 package from Bioconductor was used to normalize raw read counts according to the median of ratios method (samples with <1 M uniquely mapped reads or with fewer than 8,000 genes with over 10 reads were excluded from normalization). Normalized data were converted to GCT and CLS files, which were used in downstream analyses. Additional quality control after normalization included removal of biological replicates with a poor Pearson’s correlation (<0.9) and/or poor congregation by principal component analysis of the top 1,000 variable genes. Normalized reads were further filtered by minimal expression over 10. Data were analysed by Multiplot Studio in the GenePattern software package. The adipogenesis up-signature came from gene-set enrichment analysis.
Cell isolation and flow cytometry
Adipose tissue was dissected, minced and digested for 20 min with 1.5 mg ml−1 collagenase type II (C6885, Sigma) in Dulbecco’s Modified Eagle’s Medium (DMEM) supplemented with 2% FCS in a 37 °C water bath with shaking. The digested material was filtered through a 100-μm nylon cell strainer, digested with ammonium–chloride–potassium lysing buffer, and then filtered through a 40-μm nylon cell strainer. The SVF was collected after centrifugation at 650g for 5 min. For immunocyte analysis, cells were stained with anti-CD45 (30-F11), anti-TCRβ (H57-597), anti-CD4 (RM4-5), anti-CD8a (53-6.7), SiglecF (S17007L) and anti-Thy1.1 (OX-7) monoclonal antibodies (all from BioLegend); anti-ST2 (RMST2-2) (eBioscience); and LIVE/DEAD Fixable Violet Dead Cell Stain Kit (Invitrogen) or DAPI. For mSC analysis, cells were stained with anti-CD45 (30-F11), anti-CD31 (390), anti-PDGFRα (APA5), anti-Sca-1 (D7) monoclonal antibodies (all from BioLegend); and LIVE/DEAD Fixable Violet Dead Cell Stain Kit (Invitrogen) or DAPI. For intracellular staining, cells were fixed, permeabilized and incubated with anti-Foxp3 (FJK-16s, eBioscience) monoclonal antibody at RT for 30 min, or anti-IL-33 (AFS626, R&D) monoclonal antibody at 4 °C overnight followed by donkey anti-goat IgG secondary antibody (Jackson ImmunoResearch) at RT for 1 h according to the manufacturer’s instructions (eBioscience). Cells were acquired using FACSymphony A5 flow cytometers (BD Biosciences) and were sorted using a FACSAria (BD) cell sorter. Data were analysed using FlowJo 10 software. Detailed antibody information is listed in Supplementary Fig. 3.
Cell culture
Sorted mSCs from eWAT of 12-week-old Il33-Egfp mice were cultured in growth medium (DMEM/F12 supplemented with 10% FBS and 1% penicillin–streptomycin) with PBS or HSP90α for 30 min followed by irisin for 3 days. Supernatant from the cultured mSCs was collected as mSC conditioned medium. For integrin agonist antibody treatment, 1 h before irisin/HSP90α or PBS treatment, the cultures were pretreated with 1 ng ml−1 of a control IgG (Abcam, 206200) or anti-αVβ5 antibody (Abcam, 177004).
eWAT-Treg cells were sorted from 12-week-old Foxp3-Thy1.1 mice, cultured in RPMI 1640 supplemented with 10% FBS, 50 μM β-mercaptoethanol, 1% penicillin–streptomycin, 2,000 U ml−1 human recombinant IL-2 (200-02, PeproTech) and were stimulated with anti-CD3/anti-CD28 dynabeads (11452D, Thermo Fisher) in the presence of conditioned medium treated with either control IgG or anti-IL-33 antibody (2 μg ml−1, AG-27B-0013PF-C100, AdipoGen Life Sciences) from mSCs for 3 days at 37 °C in a 5% CO2 atmosphere.
For the primary iWAT culture, the SVF of iWAT was isolated from 4-week-old male mice. iWAT was dissected and washed in Hank’s Buffered Saline Solution (HBSS) without calcium or magnesium (Corning). It was then minced and digested in HBSS containing 10 mg ml−1 Collagenase D (Roche), 3 U ml−1 Dispase II (Roche) and 10 mM CaCl2 for 45 min at 37 °C. After digestion, the cell suspension was combined with adipocyte culture medium (DMEM/F12 supplemented with 2.5 mM L-alanyl-L-glutamine, 10% FBS (GeminiBio), 100 U ml−1 penicillin (Gibco), 100 ug ml−1 streptomycin (Gibco) and 0.1 mg ml−1 Primocin; Invivogen) and filtered through a 100-mm cell strainer. Cells of the SVF were pelleted by centrifugation at 600g for 5 min, after which they were resuspended in adipocyte culture medium, filtered through a 40-mm cell strainer, pelleted as above and resuspended in adipocyte culture medium. The cells were plated on tissue culture plates and cultured at 37 °C with 10% CO2. Primocin was removed from the culture medium after 4 days and withheld during subsequent differentiation and experiments. Preadipocytes were cultured until 2 days after reaching confluency, then differentiated by addition of fresh adipocyte culture medium supplemented with 1 mM rosiglitazone (Cayman Chemical), 0.5 mM isobutylmethylxanthine (Sigma), 1 mM dexamethasone (Sigma) and 870 nM insulin (Sigma). Two days later (‘day 2’), and every 2 days thereafter, medium was replaced with fresh adipocyte culture medium supplemented with 1 mM rosiglitazone and 870 nM insulin. Beginning on day 8 (day 4 of differentiation), rosiglitazone was omitted from the medium. Depending on assay, experiments were performed at day 10 (day 6 of differentiation) as noted in the individual experiments. Cells were treated with 1 ng ml−1 mouse IL-33 (BioLegend, 580506) as indicated and analysed 4 h after 500 nM norepinephrine (Sigma, A9512) treatment.
Immunofluorescence imaging and analysis
Cells were plated on 35-mm Matek dishes (Thermo Fisher) and were fixed by 4% paraformaldehyde (1 volume of 16% paraformaldehyde (Electron Microscopy Sciences) diluted with three volumes of PBS) for 15 min at RT, washed three times with PBS, permeabilized by permeabilization solution (PBS supplemented with 0.25% Triton X-100) for 10 min at RT and blocked by blocking solution (PBS supplemented with 0.1% Triton X-100 and 5% FBS) for 1 h at RT. For immunofluorescence staining, anti-pFAK (rabbit, Invitrogen 700255) and anti-FAK (mouse) antibodies (mouse, Invitrogen 39-6500) at a dilution of 1:500 in blocking solution were used for primary labelling of phosphorylate FAK and total FAK, respectively; and anti-rabbit Alexa Fluor 488 (Invitrogen A-11008) and anti-mouse Alexa Fluor 568 (Invitrogen A-11004) at a dilution of 1:1,000 were used for secondary labelling. DAPI (3 μM; BioLegend) was used to stain nuclei. All fluorescence images for whole-dish scans were acquired at the DFCI Molecular Imaging Core using LASX Office 1.4.5 27713 on a Leica THUNDER Imager wide-field microscope. A Zeiss 980 confocal/spectral/Airyscan microscope was used to acquire high-magnification images. Nikon Elements 4.2 and Fiji67 were used for image processing and profile quantification. For IL-33-GFP-positive cell quantification, three dishes for each condition were scanned, and total GFP intensity was normalized against total DAPI intensity in each large image, and different conditions were normalized against PBS control. For pFAK/FAK ratio quantification, cells in different regions of interest were analysed, and ratiometric analysis was performed using total pFAK and FAK intensity from each cell.
Body composition measurement
Fat and lean mass composition of living mice was assessed using a 3-in-1 Echo MRI Composition analyzer (Echo Medical Systems).
Diet-induced obesity
Age-matched littermates and group housing were used for high-fat feeding experiments. At 8 weeks of age, mice were given a 60 kcal% fat rodent diet (D12492, Research Diets) ad libitum. Mouse weight and consumed food weight were assessed once per week.
Intraperitoneal GTT
Mice were fasted overnight, after which their weight and fasting blood glucose values were measured using tail nick blood and a OneTouch UltraMini glucose meter. Glucose was administered by intraperitoneal injection at a dose of 1 g per kilogram body weight, followed by blood glucose measurements over the next 2 h (0, 30, 60, 90 and 120 min).
Intraperitoneal ITT
Mice were fasted for 4 h, after which their weight and fasting blood glucose values were measured using tail nick blood and a OneTouch UltraMini glucose meter. Human insulin (Humulin R U-100 Insulin; HI-210) was administered via intraperitoneal injection at a dose of 1 U per kilogram body weight, followed by blood glucose measurements over the next 2 h (0, 30, 60, 90 and 120 min).
Indirect calorimetry
Mice were individually housed in Promethion metabolic cages (Sable Systems International) at 23 °C with a 12-h light–dark cycle with ad libitum food and water consumption. Mice were fed a 60 kcal% fat rodent diet for the duration of the experiment. After at least 2 days of acclimatization to the cages, energy expenditure, VO2, VCO2, food intake and movement were assessed using the Sable Systems’ Promethion apparatus, comprising a rack of 16 metabolic cages and another of 8 metabolic cages. This apparatus was enclosed in a temperature-controlled chamber, and during the experiment the temperature was adjusted as depicted in the graphs at RT (23 °C). For the IL-33trap experiment, mice were injected intraperitoneally with IL-33trap (100 μg per mouse) or the same volume of PBS (100 μl) as depicted. Macro 13 (data were binned every 30 min), from the ExpeData software system, was used to export metabolic variables of interest at each reading for each cage. Data collected by Promethion metabolic cages were analysed using CalR (version 1)68 and normalized by body weight.
Histology
Tissues were fixed in formalin fixative and embedded in paraffin and then passed over to Harvard Medical School Rodent Histopathology Core for tissue sectioning, staining and quantification. Fifty-micron-thick sections were cut, baked at 60 °C for 1 h, deparaffinized in xylene, rehydrated in a graded ethanol series and then stained. H&E staining was performed with Harris’ haematoxylin for 30 s and eosin for 2 min. Images were acquired at DFCI Molecular Imaging Core using LASX Office 1.4.5 27713 on a Leica THUNDER Imager wide-field microscope. Zen 3.7 microscopy software was used for image processing and profile quantification. Images were processed in the same way and made into masks using CellProfiler.33 for automated quantification. Cropped images for presentation were prepared using Fiji67. CLSs were quantified automatically from blinded images, and their density was expressed as cells or CLS per mm2 of tissue section.
Statistical analysis
Replicate numbers are described in the figure legends. For cellular assays, n corresponds to the number of experimental replicates (for example, independent treatments). For animal assays or tissue extracted from animals, n corresponds to the number of mice used per genotype or condition. Sample sizes were determined on the basis of previous experiments using similar methodologies. Unless otherwise stated, data are presented as the mean, and error bars indicate the standard error. Graphing and statistical analyses, including two-tailed Student’s t-test, one-way ANOVA and Fisher’s least significant difference test, were performed using Prism (GraphPad). To assess the significant enrichment of gene signatures in RNA-seq datasets, we used a chi-squared test.
Reporting summary
Further information on research design is available in the Nature Portfolio Reporting Summary linked to this article.