
Viruses and vaccines
Influenza A/WSN/33 (H1N1) and A/X-31 (H3N2) viruses were used in this study. The influenza vaccine controls, IIV and CAIV, were generated from the WSN virus and validated25,38,44,45. Briefly, culture supernatant containing WSN virus was treated with 0.2% formalin (Solarbio, Cat# G2161). After 7 days of incubation at 4 °C, viral inactivation was confirmed by the absence of detectable infectious virus in MDCK cells. The doses of IIV and LYTAR vaccines were normalized to the same amount of HA protein measured by ELISA44,45. To generate CAIV, five cold-adapted amino acid mutations from the clinically approved cold-adapted live attenuated influenza vaccine FluMist were introduced into the segmented genome of the WSN virus. The five amino acid mutations are 265S in viral PB2 protein, 391E, 581G, and 661T in viral PB1 protein, and 34 G in viral NP protein25,38. CAIV was verified by the cold-adapted attenuation phenotypes25,38.
Plasmids
The 12-plasmid reverse genetics system for generating influenza A/WSN/33 (H1N1) virus was a gift from Dr. George F. Gao from the CAS Key Laboratory of Pathogenic Microbiology and Immunology, Institute of Microbiology, Chinese Academy of Sciences. Engineered plasmids for generating LYTAR viruses were obtained by inserting the gene sequence of the indicated LTM at the indicated site of the WT viral genome via PCR-based site-directed mutagenesis (Supplementary Table 1). Plasmids expressing indicated viral proteins with a Flag tag at the C-terminus were constructed by cloning the corresponding genes into the pCMV-3×Flag-1b vector (Addgene). Plasmid expressing HSC70 protein with HA tag at N-terminus was constructed by cloning the corresponding gene into the pCMV-3×HA-1b vector. All plasmids were confirmed by gene sequencing (RUIBIO TECHNOLOGY, Guangzhou) and prepared using EndoFree Maxi Plasmid Kit (TianGen, Cat# DP117).
Cell lines
The MDCK (CRL-2936) and HEK293T (CRL-3216) cell lines were purchased from the American Type Culture Collection; A549 cells (ab255450) were provided by Abcam. Proteasome-deficient A549 cell line (ab267149) was obtained from Abcam. These cell lines were maintained in Dulbecco’s Modified Eagle Medium (DMEM; Gibco, Cat# c11995500BT) containing 10% fetal bovine serum (FBS; PAN, Cat# ST30-3302), supplemented with 100 U/mL penicillin and 100 µg/mL streptomycin, and incubated at 37 °C under 5% CO₂. HEK293T-TEVp and MDCK-TEVp cell lines were established by stably integrating the gene expressing TEVp into the genome of HEK293T and MDCK cells23 and cultured in DMEM supplemented with 10% FBS, 2 µg/mL puromycin (InvivoGen, Cat# ant-pr-1), 100 U/mL penicillin, and 100 µg/mL streptomycin at 37 °C in 5% CO2.
LAMP2A-KO A549, LAMP2A-KO HEK293T, and LAMP2A-KO MDCK cell lines were established by lentiviral transduction. 5 × 10⁵ cells/well of HEK293T cells were seeded into a 6-well plate in DMEM medium (Gibco, without sodium pyruvate, Cat# C11995500BT) supplemented with 10% FBS (PAN, Cat# ST30-3302) 24 h before transfection. LAMP2A target sequence (ATAGCAGTGCAGTTCGGACC for A549 and HEK293T cell lines or CGAGGTCATGGACAGTCAAA for MDCK cell line) was cloned into Lenti-CRISPRv2 by cutting with BsmBI. A total of 400 ng of Lenti-CRISPRv2, 800 ng of pLP1-gag pol, 400 ng of pLP-2 Rev, and 200 ng of pLP-VSVG were co-transfected into the HEK293T cells. The lentivirus-containing supernatants were collected 48 h after transfection, filtered through a 0.45-µm filter, and then used for transduction. A549, HEK293T, or MDCK cells (5 × 10⁵ cells/well) were seeded into 6-well plates and transduced 24 h later with the lentiviral filtrates, supplemented with 8 µg/mL of polybrene. Selection was carried out by applying 2 µg/mL puromycin until the parental cells were completely eliminated. The stably transduced cells were subjected to monoclonal selection by limiting dilution in 96-well plates. Successful LAMP2A knockout in A549, HEK293T, and MDCK cell lines was verified by Western blot analysis and genomic sequencing.
Generation of WT, LYTAR 1.0, and LYTAR 2.0 influenza viruses
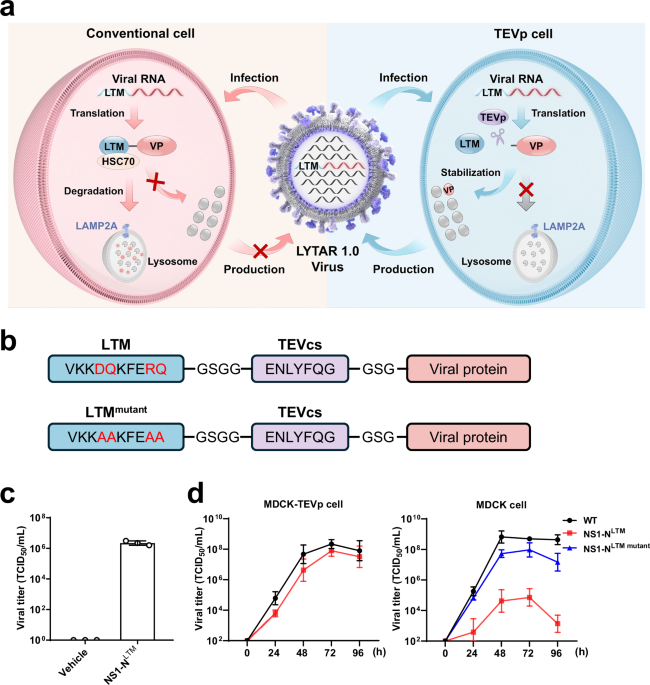
For generation of WT and LYTAR 1.0 influenza viruses, 2 × 10⁵ cells/well of HEK293T-TEVp cells and 5 × 10⁴ cells/well of MDCK-TEVp cells were seeded in 6-well plates in DMEM supplemented with 10% FBS, 100 U/mL penicillin, and 100 µg/mL streptomycin and co-cultured for 24 h at 37 °C in 5% CO2. To generate the WT influenza virus, the 12 WT viral plasmids (0.2 µg/plasmid/well) were co-transfected into the co-cultured HEK293T-TEVp and MDCK-TEVp cells. To generate LYTAR 1.0 influenza virus, the engineered LYTAR viral plasmid and the remaining plasmids of the 12-plasmid reverse genetics system were co-transfected into the co-cultured HEK293T-TEVp and MDCK-TEVp cells. Six hours later, the transfection medium was replaced with infection medium (DMEM supplemented with 0.5% FBS, 2 µg/mL TPCK-treated trypsin, 100 U/mL penicillin, and 100 µg/mL streptomycin). After 3–4 days of culture, the supernatants were collected and added to fresh MDCK-TEVp cells for viral amplification. CPE was daily monitored for 4 days. When CPE reached ~80%, supernatants were collected and subjected to quantification of viral titers by TCID50 assay. The generated viruses were further confirmed by viral genome sequencing (RUIBIO TECHNOLOGY, Guangzhou).
To generate LYTAR 2.0 influenza viruses, an almost identical procedure was performed with the following modifications: (1) the HEK293T-TEVp cells and MDCK-TEVp cells were replaced by LAMP2A-KO HEK293T cells and LAMP2A-KO MDCK cells, respectively; (2) the viral plasmids for LYTAR 1.0 influenza viruses were replaced by viral plasmids for LYTAR 2.0 influenza viruses.
TCID50 assay
Viral titers were quantified by TCID50 assay23. Briefly, MDCK-TEVp or LAMP2A-KO cells were plated in 96-well plates at a density of 5000 cells per well. Cells were then infected with serial 10-fold dilutions of viral supernatant prepared in infection medium, with eight replicate wells per dilution. Following incubation at 37 °C under 5% CO₂ for four days, wells were scored as positive or negative for cytopathic effect. The Reed-Muench method was used to calculate the TCID50/mL46.
Measurement of in vitro replication kinetics curves of influenza viruses
Conventional or engineered MDCK cells in 6-well plates were infected with MOI = 0.001 of influenza viruses. The cells were maintained in infection medium. Supernatants were harvested at 24, 48, 72, and 96 h post-infection, and viral titers were quantified by the TCID₅₀ assay.
Analysis of the LTM dependence of viral protein degradation
2.5 × 10⁵ cells/well of HEK293T cells cultured in 12-well plates were transfected with 300 ng/well of plasmid expressing the indicated viral protein with a Flag tag at the C-terminus. 6 h after transfection, the transfection medium was replaced with fresh culture medium. After another 24 h of culture, cells were collected and subjected to Western blotting assay for the detection of target proteins. The primary antibodies were anti-Flag antibody (Beijing Ray Antibody Biotech, Cat# RM1002-T, 1:5000 dilution) and anti-β-actin (Proteintech Group, Cat# HRP-60008, 1:6000 dilution). The secondary antibody was Goat anti-Mouse IgG (H+L) HRP (Beijing Ray Antibody Biotech, Cat# RM-3001, 1:8000 dilution).
Quantitative reverse transcription PCR
Cells were collected, and RNA was extracted by use of total RNA isolation kit (Vazyme, Cat# RC112-01). For the reverse transcription quantitative PCR (RT-qPCR), cDNA was generated with the HiScript III RT SuperMix for qPCR kit (Vazyme, Cat# R323–01) and was amplified by qPCR using ChamQ Universal SYBR qPCR Master Mix (Vazyme, Cat# Q712–02) with specific PCR primers (the forward and reverse primers for NS1 were CCCAAGCAGAAAGTGG and GAGGGCAGTGGTGAAAT, the forward and reverse primers for PA were TGGCAAAGTCGGTATT and AGGTTGTCCCTAAGAGC, the forward and reverse primers for NP were AGACCCTTTCAGACTGCT and CCCTCTTGGGACCACT). The expression levels of the specified viral genes were normalized against the internal control β-actin and expressed as fold changes relative to the control group. This analysis of viral gene expression was conducted in a minimum of three independent experiments.
Analysis of the lysosome dependence of viral protein degradation
2.5 × 10⁵ cells/well of HEK293T cells cultured in 12-well plates were transfected with 300 ng/well of plasmid expressing the indicated viral protein with a Flag tag at the C-terminus. 6 h after transfection, the transfection medium was replaced with fresh culture medium. After another 18 h of culture, the culture medium was further supplemented with the indicated inhibitor (10 µM MG-132, 10 mM 3-MA, 0.4 µM Baf A1, or 50 µM CQ). These inhibitors and their concentrations used in this study were selected based on previous reports47,48,49. We further confirmed that they did not show detectable cytotoxicity at the concentrations used in this study using Cell Counting Kit-8 (CCK-8) assay (Beyotime, Cat# C0037), according to the manufacturer’s instructions (Supplementary Fig. 11). 6 h after treatment, cells were collected and subjected to a Western blotting assay for the detection of target proteins. The primary antibodies were anti-Flag antibody (Beijing Ray Antibody Biotech, Cat# RM1002-T, 1:5000 dilution) and anti-β-actin (Proteintech Group, Cat# HRP-60008, 1:6000 dilution). The secondary antibody was Goat anti-Mouse IgG (H+L) HRP (Beijing Ray Antibody Biotech, Cat# RM-3001, 1:8000 dilution).
Analysis of LTM-mediated interaction between viral proteins and HSC70 by Co-IP assay
5 × 10⁵ cells/well of HEK293 were co-transfected with 1 µg/well of plasmid expressing HSC70 with an HA tag at the N-terminus and 1 µg/well of plasmid expressing the indicated viral protein with a Flag tag at the C-terminus. 6 h after transfection, the transfection medium was replaced with fresh culture medium. After another 24 h of culture, cells were lysed in cell lysis buffer (Beyotime, Cat# P0013) supplemented with protease inhibitor cocktail (MCE, Cat# HY-K0010) on ice. The cell lysates were collected and incubated with anti-Flag (Proteintech Group, Cat# 20543-1-AP, 1:500 dilution) and protein A/G beads (7Sea Biotech, Cat# P001-3) overnight at 4 °C, followed by three washes with cell lysis buffer. The immunoprecipitates were eluted from the beads with 1× sodium dodecyl sulfate (SDS) loading buffer (ACE, Cat# AL014) and separated on 4–12% SDS-polyacrylamide gels (SDS-PAGE) (ACE, Cat# F15412Gel). Then proteins were transferred to polyvinylidene fluoride (PVDF) membranes (Bio-Rad, Cat# 1620177), followed by incubation with 5% skim milk (YEASEN, Cat# 36120ES76) in TBST (EpiZyme, Cat# PS103) for 1 h at room temperature. Then the membranes were subsequently incubated with primary antibodies and secondary antibodies. The protein bands were visualized by Immunobilon Western Chemiluminescent HRP Substrate (Proteintech Group, Cat# PK10001). The primary antibodies were anti-Flag (Proteintech Group, Cat# 20543-1-AP, 1:5000 dilution) and anti-HA (MBL, Cat# M180-3, 1:8000 dilution). The secondary antibodies were anti-rabbit IgG-HRP (Beijing Ray Antibody Biotech, Cat# RM-3002, 1:8000 dilution) and anti-mouse IgG-HRP (Beijing Ray Antibody Biotech, Cat# RM-3001, 1:8000 dilution).
Analysis of the LAMP2A dependence of viral protein degradation
2 × 10⁵ cells/well of conventional or LAMP2A-KO HEK293T cells cultured in 12-well plates were transfected with 300 ng/well of plasmid expressing the indicated viral protein with Fa lag tag at the C-terminus and plasmid expressing HSC70 protein. 6 h after transfection, the transfection medium was replaced with fresh culture medium. After another 24 h of culture at 37 °C in 5% CO2, cells were collected and subjected to a Western blotting assay for the detection of the indicated proteins. The primary antibodies were anti-Flag antibody (Beijing Ray Antibody Biotech, Cat# RM1002-T, 1:5000 dilution), anti-LAMP2A (Santa Cruz, Cat# sc-18822, 1:1000 dilution), and anti-β-actin (Proteintech Group, Cat# HRP-60008, 1:6000 dilution). The secondary antibody was Goat anti-Mouse IgG (H+L) HRP (Beijing Ray Antibody Biotech, Cat# RM-3001, 1:8000 dilution).
1.2 × 10⁵ cells/well of conventional or LAMP2A-KO HEK293T cells cultured in 12-well plates were infected with the indicated virus (MOI = 0.01). After 48 h of culture at 37 °C in 5% CO2, cells were collected and subjected to a Western blotting assay for the detection of the indicated proteins. The primary antibodies were anti-NS1 antibody (GeneTex, Cat# GTX125990, 1:2000 dilution), anti-PA antibody (GeneTex, Cat# GTX118991, 1:2000 dilution), anti-NP antibody (GeneTex, Cat# GTX125989, 1:5000 dilution), anti-M1 antibody (Sino Biological, Cat# 40010-RP01; 1:1000 dilution), anti-LAMP2A (Santa Cruz, Cat# sc-18822, 1:1000 dilution), and anti-β-actin (Proteintech Group, Cat# HRP-60008, 1:6000 dilution). The secondary antibodies were Goat anti-Mouse IgG (H+L) HRP (Beijing Ray Antibody Biotech, Cat# RM-3001; 1:8000 dilution) and Goat anti-Rabbit IgG (H+L) HRP (Beijing Ray Antibody Biotech, Cat# RM-3002; 1:8000 dilution).
1.2 × 10⁵ cells/well of conventional or LAMP2A-KO A549 cells cultured in 12-well plates were infected with the indicated virus (MOI = 0.01). After 48 h of culture at 37 °C in 5% CO2, cells were collected and subjected to a Western blotting assay for the detection of the indicated proteins. The primary antibodies were anti-NS1 antibody (GeneTex, Cat# GTX125990, 1:2000 dilution), anti-PA antibody (GeneTex, Cat# GTX118991, 1:2000 dilution), anti-NP antibody (GeneTex, Cat# GTX125989, 1:5000 dilution), anti-M1 antibody (Sino Biological, Cat# 40010-RP01, 1:1000 dilution), anti-LAMP2A (Santa Cruz, Cat# sc-18822, 1:1000 dilution), and anti-β-actin (Proteintech Group, Cat# HRP-60008, 1:6000 dilution). The secondary antibodies were Goat anti-Mouse IgG (H+L) HRP (Beijing Ray Antibody Biotech, Cat# RM-3001; 1:8000 dilution) and Goat anti-Rabbit IgG (H+L) HRP (Beijing Ray Antibody Biotech, RM-3002; 1:8000 dilution).
Immunofluorescence and FFU assay
2.5 × 10⁵ cells/well of conventional or LAMP2A-KO A549 or HEK293T cells cultured in 12-well plates were infected with the indicated virus (MOI = 0.01). After 48 h of culture at 37 °C in 5% CO2, the culture supernatants were collected. 5 × 10³ cells/well of MDCK-TEVp or LAMP2A-KO MDCK cells cultured in 96-well plates were infected with two-fold serially diluted supernatants for 48 h. Then the cells were washed with PBS, fixed with 4% paraformaldehyde (PFA), washed with PBS, permeabilized with PBS containing 0.1% Triton X-100 (PBST) for 5 min, blocked with PBST containing 10% goat serum for 1 h at room temperature, and incubated with anti-M1 antibody (Sino Biological, Cat# 40010-RP01; 1:400 dilution) diluted in PBST containing 1% goat serum overnight at 4 °C and Alexa Fluor 488 goat anti-rabbit IgG (Life Technologies, Cat# A11034; 1:1000 dilution) for 1 h at room temperature. Cell nuclei were stained with DAPI (Invitrogen). Fluorescence images were captured using a fluorescence microscope (NIKON ECLIPSE Ti2-E, Japan), and image processing was done using NIS-Elements (NIKON, Japan). The quantitative analysis of images was done using ImageJ (v1.8.0).
Analysis of protein colocalization by fluorescence confocal microscopy
8 × 10⁴ HeLa cells were seeded in a confocal dish (Cellvis, Cat# D35-20-1.5-N) and transfected with 500 ng of plasmid expressing NS1-NLTM or NS1-NLTM mutant protein with a Flag tag at the C-terminus. 6 h after transfection, the transfection medium was replaced with fresh culture medium. After 18 h of culture at 37 °C in 5% CO2, 0.2 µM Baf A1 was added to the culture medium. After another 6 h of culture, the cells were washed with PBS, fixed with 4% paraformaldehyde (PFA) for 20 min at room temperature, washed with PBS, permeabilized with PBS containing 0.1% Triton X-100 for 5 min, blocked with PBS containing with 0.1% Triton X-100 and 10% goat serum for 1 h at room temperature, and incubated with anti-Flag antibody (MBL, Cat# PM020; 1:1000 dilution) and anti-HSC70 antibody (Santa Cruz Biotechnology, Cat# sc-7298; 1:300 dilution) or anti-LAMP2A antibody (Santa Cruz Biotechnology, Cat# sc-18822; 1:300 dilution) diluted in PBS containing 0.1% Triton X-100 and 1% goat serum overnight at 4 °C, followed by incubation with Alexa Fluor 488 goat anti-rabbit IgG (Life Technologies, Cat# A11034; 1:1000 dilution) and Alexa Fluor 555 goat anti-mouse IgG (Life Technologies, Cat# A32727; 1:1000 dilution) for 1 h at room temperature. Cell nuclei were counterstained with DAPI (Invitrogen, Cat# 2086723) after the secondary antibody staining. Intracellular fluorescence was captured by a confocal laser-scanning microscope (Nikon AX, Japan) under a 100× oil-immersion objective. The images were processed for gamma adjustments using NIS-Elements (NIKON, Japan).
Evaluation of in vivo safety in mice
Animal experiments followed the institutional guidelines of the Shenzhen Institute of Advanced Technology (Chinese Academy of Sciences). We employed female C57BL/6J mice and immunodeficient BALB/c nude mice (6–8 weeks old; Vital River Laboratory). Housing conditions included a 12-h light/dark cycle, a constant temperature of 24 °C, and 50% humidity. Each group of ten mice was intranasally inoculated with 105 TCID50 of WT virus, LYTAR 1.0 virus, LYTAR 2.0 virus, or DMEM (vehicle) control, under anesthesia with tribromoethanol. Three days post-inoculation, five mice from each group were euthanized, and their lungs were harvested and homogenized in 1 mL PBS. Viral titers in the lung samples were assessed via the TCID50 assay. The remaining five mice in each group were monitored daily for signs of death, weight loss, or any other symptoms for 14 days.
Evaluation of immunogenicity in mice
Ten mice per group were intranasally inoculated with 105 TCID50 of LYTAR 1.0 vaccine, LYTAR 2.0 vaccine, CAIV, or DMEM control (vehicle), or intramuscularly inoculated with an equivalent dose of IIV, under tribromoethanol anesthesia. One week post-inoculation, five mice from each group were euthanized, and their lungs and spleens were collected for IFN-γ ELISpot assay to assess viral antigen-specific T-cell responses. Three weeks after inoculation, bronchoalveolar lavage (BAL) fluid and serum samples were collected from the remaining five mice in each group for hemagglutination inhibition (HI) assay, neutralization (NT) assay, and ELISA to measure HI antibody titers, NT antibody titers, viral antigen-specific IgG, and viral antigen-specific IgA antibodies23,25.
Evaluation of cross-reactive protection efficacy in mice
To evaluate the protective efficacy against a homologous viral challenge, ten mice per group were intranasally inoculated with 105 TCID50 of LYTAR 1.0 vaccine, LYTAR 2.0 vaccine, CAIV, or DMEM (vehicle) control, or intramuscularly with the same dosage of IIV, under anesthesia with tribromoethanol. Three weeks post-inoculation, mice were intranasally challenged with 105 TCID50 of homologous WT WSN virus. Three days after the infection, five mice from each group were euthanized, and their lungs were collected and homogenized in 1 mL PBS. Viral titers in the lung homogenates were measured using a TCID50 assay. The remaining five mice from each group were observed daily for mortality, body weight changes, and other clinical signs for 14 days.
To assess the protective efficacy against a heterologous viral challenge, ten mice per group received an intranasal inoculation with 105 TCID50 of LYTAR 1.0 vaccine, LYTAR 2.0 vaccine, CAIV, or DMEM (vehicle) control, or an intramuscular injection of the same dosage of IIV, under tribromoethanol anesthesia. After three weeks, mice were intranasally challenged with 103 TCID50 of heterologous influenza A/X-31 (H3N2) virus. Three days post-infection, five mice from each group were euthanized, and their lungs were harvested and homogenized in 1 mL PBS. Viral titers in the lung samples were determined using the TCID50 assay. The remaining five mice from each group were monitored daily for signs of mortality, weight loss, and other clinical manifestations for 14 days.
IFN-γ ELISpot assay
The viral antigen-specific T-cell responses were assessed using the IFN-γ ELISpot assay, according to the manufacturer’s instructions for the IFN-γ ELISpot kit (Mabtech, Cat# 3321-4AST-2). The viral antigen peptide (NP366-374: ASNENMETME), synthesized by GenScript, was used as the stimulant in this study.
HI assay
HI assay was performed to quantify HI antibody responses23,25,27. Briefly, mouse sera were treated with receptor-destroying enzyme (RED) solution (Denka Seiken, Cat# 340122) and two-fold serially diluted in 50 µL of PBS in V-shaped 96-well plates, followed by the addition of 4 hemagglutinating (HA) units of WT virus to each well. After 30 min of incubation at room temperature, 50 µL of 1% (v/v) isolated chicken red blood cells in PBS was added to each well. After another 30 min of incubation at room temperature, the highest dilutions of sera that inhibited hemagglutination were read as the HI antibody titers.
NT assay
NT assay was performed to quantify NT antibody responses23,25,27. Briefly, a mixture of two-fold serially diluted RDE-treated sera and MOI = 0.01 of influenza virus in DMEM supplemented 1% FBS and 2 µg/mL TPCK-treated trypsin was added to confluent MDCK cells in 96-well plates and incubated for 4 days at 37 °C in 5% CO2. The highest dilutions of sera that completely inhibited CPE were read as the NT antibody titers.
Detection of IgG and IgA antibodies by ELISA
ELISA was performed to quantify IgG and IgA antibody responses23,25. Influenza viral HA protein (Sino Biological, Cat# 11692-V08H), NP protein (Sino Biological, Cat# 11675-V08B), and WSN virus were used as antigens. 96-well ELISA plates (Corning, Cat# 3590) were coated overnight at 4 °C with 50 ng/well of the protein antigen or 106 TCID50/well of the WSN virus, diluted in 50 µL of ELISA coating buffer (Solarbio, Cat# C1055). Following removal of the coating buffer, the plates were incubated for 1 h with 100 µL/well of blocking buffer (PBS containing 0.1% Tween 20 and 5% non-fat milk), then exposed to two-fold serial dilutions of mouse sera or BAL samples. After 2 h at 37 °C, the plates were washed three times with PBS containing 0.1% Tween 20 (PBST) and incubated with 100 µL/well of HRP-conjugated anti-mouse IgG antibody (Proteintech, Cat# SA00001-1; 1:2000 dilution) or HRP-conjugated anti-mouse IgA antibody (Abcam, Cat# ab97235; 1:2000 dilution) diluted in blocking buffer. After another 1-h incubation at 37 °C, the plates were washed five times with PBST, and 100 µL/well of TMB substrate solution (Beyotime, Cat# P0209) was added. After 15 min at room temperature, 100 µL of stop solution (Solarbio, Cat# C1058) was added to halt the reaction. Absorbance was measured at 450 nm using an ELISA microplate reader (BioTek Synergy H1, USA).
Statistics and reproducibility
All experiments were performed independently with at least three repetitions. Data are presented as the mean ± standard deviation (s.d.). Graphical analysis and statistical tests were conducted using GraphPad Prism 8.0 and Microsoft Excel. A two-tailed Student’s t-test was applied for comparisons between two groups. For comparisons involving three or more groups, one-way ANOVA followed by Tukey’s or Dunnett’s multiple comparisons test was used. P-values less than 0.05 were considered statistically significant; *P < 0.05; **P < 0.01; ***P < 0.001; n.s. not significant.
Ethics statement
Animal experiments were performed in accordance with the guidelines of the Institutional Animal Care and Use Committee of Shenzhen Institutes of Advanced Technology, Chinese Academy of Sciences (Approval No. SIAT-IACUC-240110-HCS-SLL-A2450), the Institutional Animal Care and Use Committee of Sun Yat-sen University (Shenzhen) (Approval No. 2024003169) and the Institutional Review Board of the Brain Science Infrastructure of Shenzhen Institutes of Advanced Technology (Approval No. SIAT-BSI-IRB-250821-HCS-SLL-A0159). All procedures were performed in compliance with the approved protocols.
Reporting summary
Further information on research design is available in the Nature Portfolio Reporting Summary linked to this article.