
Ethics
All animal experiments comply with all relevant ethical regulations and were performed in accordance with protocols approved by the Animal Care and Use Committee at the Institute of Medical Science, University of Tokyo (protocol number: PA19-07) and the St. Jude Children’s Research Hospital Institutional Animal Care and Use Committee (protocol number: 3252).
Reagents and resources
Details of key reagents and resources used in this study are listed in Supplementary Table 1.
Mice
WT CD45.2 and CD45.1 C57BL/6 mice were purchased from Japan SLC and Sankyo Labo Services, respectively. Mlkl–/– mice were obtained from Dr. M. Pasparakis (University of Cologne)68, and WT and Ripk3–/– SMART-Tg mice were obtained from Dr. H. Nakano (Toho University)37. MlklSA2 mice were purchased from the Jackson Laboratory42. WT and Mlkl–/– mice were bred and aged in-house at the Institute of Medical Science, University of Tokyo, WT and Ripk3–/– SMART-Tg mice at Toho University, and WT, SMART-Tg, Mlkl–/–, and MlklSA2 mice at St. Jude Children’s Research Hospital. At the time of analysis, young mice were 6–12 weeks of age, and aged mice were 18–20 months of age unless otherwise specified. For transplantation experiments, 8–12-week–old CD45.1 C57BL/6 mice were used as recipients. Respective littermates or age-matched mice were used as controls. No specific randomization or blinding protocol was used, and both male and female animals were used indiscriminately in this study. All mice were bred and maintained on a 12 h light cycle in temperature- and humidity-controlled specific pathogen-free mouse facilities.
In vivo assays
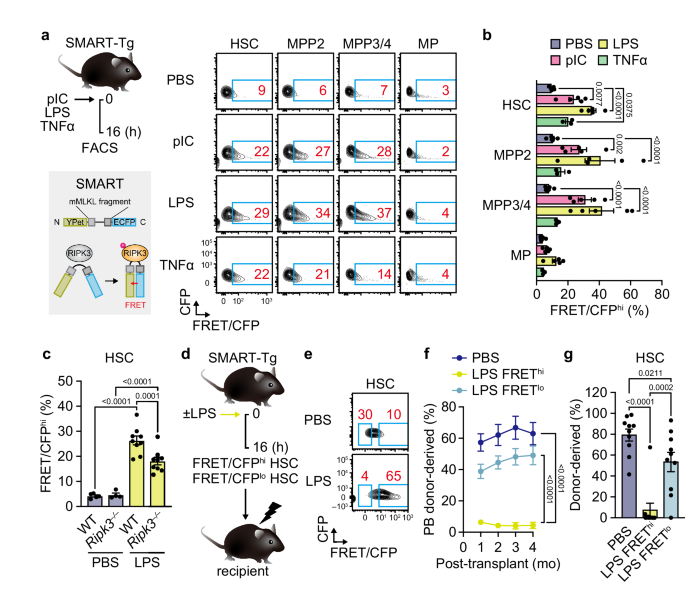
For pIC-induced inflammation, mice were injected intraperitoneally with 5 mg/kg pIC (Cytiva) in phosphate-buffered saline (PBS) once or 7 times every other day. For LPS-induced inflammation, mice were injected intraperitoneally with 0.4 mg/kg LPS (InvivoGen) in PBS once. For TNF-α-induced inflammation, mice were injected retro-orbitally with 2 µg TNF-α (Genentech) in PBS once. For repeated 5-FU treatment, mice were injected intraperitoneally with 150 mg/kg 5-FU (Kyowa Kirin) in PBS once a month for 3 months (3 times). For in vivo blockade of RIPK3 kinase activity, mice were injected intraperitoneally with 30 mg/kg UH15-38 (Bio-Techne) in PBS once every day for 4 consecutive days before pIC injection. For HSC transplantation, recipient mice (CD45.1) were lethally irradiated (9.5 Gy, delivered in split doses 3 h apart) using an X-ray irradiator (MBR-1520R; Hitachi) and retro-orbitally injected with 250 donor HSCs (CD45.2+) along with 2 × 10⁵ BM cells (CD45.1+) within the next 6 h. When necessary, 2 × 10⁶ BM cells were pooled from each recipient at 4 months and retro-orbitally injected into freshly prepared, lethally irradiated secondary and tertiary recipients. For BM chimeras, recipient mice were lethally irradiated and retro-orbitally injected with 2 × 10⁶ BM cells isolated from WT and Mlkl–/– mice. For reciprocal transplantation, 18-month-old WT and Mlkl–/– recipient mice were lethally irradiated and retro-orbitally injected with 2 × 10⁶ BM cells isolated from 3-month-old WT mice. For transplantation of WT and Mlkl–/–HSCs after RUNX1S291fs transduction, lethally irradiated recipients were retro-orbitally injected with 1000 GFP+ transduced HSCs along with 5 × 10⁵ Sca-1-depleted helper BM cells (CD45.1+). For transplantation of Mlkl–/– HSCs reconstituted with N-terminal FLAG-MLKL, lethally irradiated recipients were retro-orbitally injected with 1000 GFP+ transduced HSCs along with 2 × 10⁵ BM cells (CD45.1+). Transplanted mice received antibiotic water containing Baytril (Bayer) for 4 weeks. Peripheral blood (PB) was analyzed monthly and collected via retro-orbital bleeding in 4 mL of ACK lysis buffer (150 mM NH4Cl and 10 mM KHCO3) containing 10 mM EDTA for flow cytometry analyses, and BM was analyzed at 4 months post-transplantation.
Flow cytometry
Single-cell suspensions of BM cells were obtained in PBS containing 2% heat-inactivated fetal bovine serum (FBS) (Sigma-Aldrich) either by crushing femurs, tibiae, pelvises, humeri, and the sternum or by flushing femurs and tibiae. Erythrocytes were removed by ACK lysis, and contaminating bone fragments were further removed by centrifugation on a Ficoll gradient (Histopaque-1119; Sigma-Aldrich). BM cellularity was determined by using a ViCELL-XR or ViCELL-BLU automated cell counter (Beckman-Coulter). For immature cell sorting, BM cells were pre-enriched for c-Kit+ cells with c-Kit microbeads and LS columns (Miltenyi Biotec). For immature cell analyses and sorting, a lineage (Lin) cocktail of CD3ε-PECy5 (1:200), CD4-PECy5 (1:800), CD5-PECy5 (1:800), CD8α-PECy5 (1:800), B220-PECy5 (1:800), Mac-1-PECy5 (1:800), Gr-1-PECy5 (1:800), and Ter119-PECy5 (1:400) was used to define immature BM cells. For immature cell sorting, c-Kit-enriched BM cells were stained with Lin-PECy5, c-Kit-APC (1:800), Sca-1-PECy7 (1:800), Flk2-BV421 (1:50), CD48-APCeF780 (1:400), and CD150-PE (1:400). For immature cell analyses, unfractionated BM cells were stained with Lin-PECy5, c-Kit-APC, Sca-1-PECy7, Flk2-Bio (1:100)/SA-BV605 (1:400), CD48-AF700 (1:400), CD150-BV650 (1:200), CD34-FITC (1:50), FcγR-BV510 (1:800), IL-7Rα-APCCy7 (1:100), CD41-BV421 (1:400), and EPCR-PE (1:800). For NEO-1 expression, cells were incubated with anti-FcγR (1 µg per 106 cells) for 10 min and stained with Lin-PECy5, c-Kit-APC, Sca-1-PECy7, CD48-APCeF780, CD150-PE and anti-NEO-1 (1:13)/anti-goat IgG-AF488 (1:200). For P-selectin and GPR183 expression, cells were stained with Lin-PECy5, c-Kit-APC, Sca-1-PECy7, CD48-APCeF780 together with either CD150-BV650 and P-selectin-PE (1:200) or CD150-PE and GPR183-FITC (1:50). For PB analyses, cells were stained with Ter119-PECy5, Gr-1-eF450 (1:800), Mac-1-APC (1:800), B220-BV605 or -AF700 (1:800), and CD3ε-PECy7 (1:200). For analyses of FRET in immature SMART-Tg cells, unfractionated BM cells were stained with Lin-PECy5, c-Kit-APC, Sca-1-PECy7, CD48-APCeF780, and CD150-PE. For transplantation experiments, PB cells were stained with Ter119-PECy5, Gr-1-eF450, Mac-1-APC, B220-BV605, CD3ε-PECy7, CD45.1-APCeF780 (1:200), and CD45.2-FITC or -BV786 (1:200), and BM cells were stained with Lin-PECy5, c-Kit-APC, Sca-1-PECy7, Flk2-Bio/SA-BV605, CD48-AF700, CD150-BV650, IL-7Rα-PE, CD45.1-APCeF780, and CD45.2-FITC or -BV786. For ex vivo expanded HSC analyses, cells were stained with CD41-FITC (1:800), Mac-1-Bio (1:800)/SA-BV605, FcγR-BV510, Sca-1-PECy7, c-Kit-APC, CD150-BV650, CD48-AF700, and EPCR-PE. For staining with CellROX, unfractionated BM cells were stained with Lin-PECy5, c-Kit-APC, Sca-1-PECy7, Flk2-BV421, CD48-AF700, and CD150-BV650 and incubated with 5 µM CellROX Green in 2% FBS/PBS for 30 min at 37 °C, 5% CO2. For staining with JC-1, unfractionated BM cells were stained with Lin-PECy5, c-Kit-APC, Sca-1-PECy7, Flk2-BV421, CD48-APCeF780, CD150-BV650 and incubated for 30 min at 37 °C, 5% CO2 with 2 µM JC-1 in Iscove’s modified Dulbecco’s media (IMDM) supplemented with 5% FBS, 1× penicillin–streptomycin–L-glutamine (Fujifilm Wako), 0.1 mM non-essential amino acids (Gibco), 1 mM sodium pyruvate (Gibco), and 50 μM 2-mercaptoethanol (Sigma-Aldrich). All antibody staining was performed on ice for 45 min when a CD34 antibody was included or 30 min otherwise, and stained cells were finally resuspended in 2% FBS/PBS containing 1 µg/ml propidium iodide (PI) to exclude dead cells. For Annexin V staining, unfractionated BM cells stained with Lin-PECy5, c-Kit-APC, Sca-1-PECy7, CD48-APCeF780, CD150-PE, or retrovirally transduced GFP+ cells were washed in 1× Binding buffer and incubated with Annexin V-FITC or -APC (1:20) in 1× Binding buffer for 15 min at room temperature. Stained cells were finally resuspended in 1× Binding buffer containing DAPI (1 µg/ml), SYTOX Blue, or PI (1 µg/ml) before analysis. For intracellular Ki-67/DAPI staining, unfractionated BM cells were stained with Lin-PECy5, c-Kit-APC, Sca-1-PECy7, CD48-APCeF780, and CD150-PE, and then fixed and permeabilized with Cytofix/Cytoperm buffer for 20 min on ice. After washing with Perm/Wash (BD Biosciences), cells were stained with anti-Ki-67-FITC (1:100) in Perm/Wash for 30 min on ice, washed with Perm/Wash and then resuspended in Perm/Wash containing 1 µg/ml DAPI before analysis. Cell sorting was performed on FACS Aria IIIu or Fusion (Becton Dickinson). All data were collected on FACS Aria IIIu, Celesta, or LSRFortessa (Becton Dickinson) and analyzed with FlowJo (BD Biosciences, v10.10.0). For detection of FRET from ECFP to Ypet in the SMART probe, ECFP and FRET signals excited by a 405 mm laser were detected with 450/40 and 530/30 filters, respectively, on a FACS Aria IIIu or LSRFortessa. Cells with an increase in FRET/CFP ratio and a decrease in CFP signals were gated as FRET/CFPhi.
Ex vivo assays
For ex vivo HSC expansion, 500 HSCs were directly sorted per well of a 96-well flat-bottom plate in 200 µL of Ham’s F-12 media (Gibco) supplemented with 0.1% polyvinyl alcohol, 10 mM HEPES (Gibco), 1× penicillin–streptomycin–L-glutamine, 1× insulin–transferrin–selenium–ethanolamine (Gibco), 10 ng/mL mouse SCF (BioLegend), and 100 ng/mL mouse TPO (PeproTech) as described previously69. After 7 days, cells were collected and counted on Vi-CELL XR, and the frequency of EPCR+ HSCs (CD41–/Mac-1–/FcγR–/c-Kit+/Sca-1+/CD48–/CD150+/EPCR+) was evaluated by flow cytometry. For autophagy flux analyses, HSCs were sorted and incubated with DALGreen (1 µM) for 30 min at 37 °C in 2% FBS/PBS. After being washed twice with 2% FBS/PBS, 1000–2000 stained cells were seeded per well of 96-well flat bottom plate, incubated for 8 h at 37 °C, 5% CO2 in 200 µL of cytokine-free IMDM supplemented with 5% FBS, 1× penicillin–streptomycin–L-glutamine, 0.1 mM non-essential amino acids, 1 mM sodium pyruvate, and 50 μM 2-mercaptoethanol with or without 5 nM bafilomycin A1, and analyzed by flow cytometry.
Retroviral transduction of HSCs
For transduction of N-terminal FLAG-MLKL, 3×FLAG was added in frame at the N-terminus of mouse Mlkl cDNA and cloned into the pMY-IRES-GFP retroviral vector. The pMY-IRES-GFP and pMY-3×FLAG-MLKL-IRES-GFP were transfected into Plat-E packaging cells with FuGENE HD, and the culture supernatants were obtained at 40–48 h and filtered through 0.45 µm PVDF filters. For transduction of the C-terminal truncation mutant of RUNX1, the culture supernatant of 293GPG packaging cells stably transfected with the pMY-RUNX1S291fs-IRES-GFP retroviral vector was collected at 48–60 h after tetracycline withdrawal and filtered through a 0.45 µm PVDF filter. For HSC transduction, 2000 WT and Mlkl–/– HSCs (CD45.2+) were directly sorted per well of a 96-well flat bottom plate pre-coated with RetroNectin (Takara Bio) in 200 µL SF-O3 media (EIDIA) supplemented with 0.2% BSA, 100 ng/mL mouse SCF, and 100 ng/mL human TPO, incubated overnight at 37 °C, 5% CO2, and subjected to magnetofection for 1 h in the retroviral supernatants with a 96-well magnetic plate and ViroMag R/L. The medium was then replaced with fresh cytokine-containing media, and cells were incubated for 48 h before the re-isolation of live PI–/GFP+ transduced cells for transplantation experiments.
Immunofluorescence and proximity ligation assay
A total of 2000 HSCs were sorted and pipetted onto MAS adhesive glass slides (Matsunami TF1205M) or µ-Slide 18 Well (ibidi), incubated for 30 min at 4 °C, fixed with 4% paraformaldehyde for 10 min at room temperature, and permeabilized in 0.3% Triton X-100/PBS for 2 min at room temperature. For γH2AX immunofluorescence, slides were blocked in 2% BSA/PBS for 1 h at 4 °C and incubated overnight at 4 °C in 2% BSA/PBS with anti-γH2AX antibody (1:500). Slides were then washed 3 times in PBS and incubated for 1 h at room temperature in 2% BSA/PBS with AF488-conjugated goat anti-mouse IgG (1:200). For FLAG-MLKL immunofluorescence, slides were blocked in 2% BSA/PBS for 1 h at 4 °C and incubated overnight at 4 °C in 2% BSA/PBS with anti-MLKL (1:500) and anti-FLAG (1:500) antibody. Slides were then washed 3 times in PBS and incubated for 1 h at room temperature in 2% BSA/PBS with AF647-conjugated goat anti-mouse IgG (1:500) and AF594-conjugated goat anti-rabbit IgG (1:500). Slides were then washed 3 times in PBS, incubated with 1 mg/ml DAPI/PBS for 5 min, and washed twice in PBS. Slides were finally mounted with coverslips by using ProLong Glass or Gold (Invitrogen). Cells were imaged on an A1Rsi inverted confocal microscope with a ×100 objective (Nikon) or an LSM 980 Airyscan inverted confocal microscope with a ×63 objective (Zeiss). For the proximity ligation assay, slides were blocked in Duolink blocking solution (Sigma-Aldrich) and incubated overnight at 4 °C in Duolink antibody diluent (Sigma-Aldrich) with primary antibodies against COX-IV (1:400) and p-MLKL (1:1600). Slides were washed twice in 1× Duolink wash buffer A (Sigma-Aldrich) and incubated for 1 h at 37 °C in Duolink antibody diluent with PLUS and MINUS probes (1:5; Sigma-Aldrich). Slides were then washed twice in 1× Duolink wash buffer A, incubated for 30 min at 37 °C in 1× Duolink ligation buffer with ligase (1:40, Sigma-Aldrich), washed twice in 1× Duolink wash buffer A, and incubated for 100 min at 37 °C in 1× Duolink amplification buffer with polymerase (1:80; Sigma-Aldrich). After being washed twice in 1× and once in 0.01× Duolink wash buffer B (Sigma-Aldrich), slides were finally mounted with coverslips by using Duolink in situ mounting medium with DAPI (1:80; Sigma-Aldrich), and cells were imaged on an N-SIM super-resolution confocal microscope with a 100× objective (Nikon) or an LSM 980 Airyscan inverted confocal microscope with a ×63 objective (Zeiss). For quantification, cells were randomly captured, and γH2AX or PLA foci were counted by eye using an NIS-Elements Viewer (Nikon, v4.11.0) or Image J (v1.53c).
Cytokine profiling
For collecting BM fluids, two femurs and two tibiae per mouse were flushed out with the same 200 µL of 2% FBS/PBS by using a 1 mL syringe with a 23 G needle and were spun down at 300×g for 5 min to remove BM cells. Supernatants were further clarified by centrifugation at 12,000×g for 10 min and stored at –80 °C until use. 50 µL of 2× diluted samples were analyzed with a Bio-Plex Pro mouse cytokine 23-Plex panel on a Bio-Plex 200 analyzer (Bio-Rad) according to the manufacturer’s protocol. Cytokine concentrations were calculated using standard curves. Morpheus was used to generate heatmaps showing normalized cytokine levels with hierarchical clustering of samples and cytokines with Euclidean distance.
RNA-seq
RNA was purified from 10,000 HSCs isolated from WT and Mlkl–/– mice with the RNeasy Plus Micro Kit. Double-stranded cDNA was generated using the SMART-Seq HT Kit and fragmented using the M220 Focused ultrasonicator (Covaris). Sequencing libraries were prepared using the NEBNext Ultra DNA Library Prep Kit (New England Biolabs). Different index primers were used for multiplexing samples in one lane, and pooled libraries were sequenced on NextSeq2000 (Illumina) with single-read 70 base pairs. Data quality was verified by FastQC (v0.12.0), and demultiplexing was performed with bcl2fastq (v2.20). Sequencing reads were mapped to the mouse reference genome (mm10) with HISAT2 (v2.2.1) and quantified with StringTie (v2.2.3). Normalization and pairwise differential expression analyses were performed using edgeR (v3.30.3). Principal component analysis was performed using standard packages in R (v4.0.2), and plots were generated using the first 2 principal components. The Benjamini–Hochberg method was used to correct type I errors for multiple gene-level comparisons, with Wald tests applied and a q-value cutoff of 0.01 set to define differentially expressed genes (DEGs). Identified DEGs were visualized in volcano plots and area-proportional Venn diagrams using R. Gene set enrichment analysis (v4.3.0) was performed using the 50 “MH” orthology-mapped hallmark gene sets in mouse MSigDB collections, and only those with P < 0.05 were displayed as significantly enriched gene sets.
ATAC-seq
For each biological replicate, 10,000 HSCs were isolated from six young WT mice, six young Mlkl–/– mice, three aged WT mice, and three Mlkl–/– mice. All HSC replicates were prepared and processed on the same day to avoid potential batch effects. At harvest, cells were lysed and immediately transposed as described previously. In brief, HSCs were resuspended in cold lysis buffer (10 mM Tris–HCl, pH 7.4, 10 mM NaCl, 3 mM MgCl2, and 0.1% IGEPAL CA-630) and incubated for 10 min on ice. Samples were then spun down at 600×g for 10 min at 4 °C and incubated for 35 min at 37 °C in 50 μL of transposase reaction mix consisting of 25 μL Tagment DNA buffer (Illumina), 2.5 μL Tagment DNA enzyme (Illumina), and 22.5 μL nuclease-free water. Transposed fragments were purified with MinElute PCR Purification Kit (QIAGEN), eluted in 14 µL of nuclease-free water, and stored at –20 °C until library preparation. After the optimization of PCR cycle number, libraries were semi-quantified with SYBER Green I Nucleic Acid gel Stain (Takara Bio) to optimize the number of PCR cycles and then amplified using NEBNext High Fidelity 2×PCR Master mix (New England Biolabs) and index primers. Amplified libraries were purified with the MinElute PCR Purification Kit, size-selected between 240 and 360 base pairs by using BluePippin (Sage Science), and sequenced with NextSeq500 (Illumina) with 70 bp single-read length. Sequencing reads were mapped to the mouse reference genome (mm10) with Bowtie2 (v2.5.3). Peaks were called with MACS2 (v2.2.7.1) using the nomodel function, with a q-value cutoff of 0.001 set to define accessible peaks in each sample. The catalog of all peaks called in any samples was generated by merging all called peaks that overlapped by at least one base pair by using the bedtools (v2.31.0) merge function. As a result, a total of 76,286 merged peaks were detected and used as a map file for downstream processing. Reads at each peak in the catalog were quantified with the bedtools map function by using bed files of each sample. Differentially accessible regions (DARs) were detected using edgeR with a q-value cutoff of 0.01 and visualized as volcano plots and area-proportional Venn diagrams using R.
Transmission electron microscopy
A total of 100,000 HSCs were sorted in 2% FBS/PBS, spun down at 300×g for 5 min at 4 °C, and fixed for 2 h at room temperature with 1% glutaraldehyde in 0.1 M sodium phosphate buffer pH 7.4. After fixation, cells were rinsed and post-fixed on ice for 2 h with 2% osmium tetroxide in 0.1 M sodium phosphate buffer, pH 7.4. Cells were then washed, dehydrated in a graded series of ethanol, and embedded in Epon 812 resin mixture (TAAB). Semi-thin sections of about 0.7 µm thickness were cut on an EM UC7 ultramicrotome (Leica), stained with 0.2% toluidine blue, and examined under an ECLIPSE Si microscope (Nikon). Ultra-thin sections were cut, stained for 5 min at room temperature with uranyl acetate and lead citrate, and imaged on a JEM-1400Flash electron microscope (JEOL). Mitochondria and autophagosomes were counted by eye, and mitochondrial morphology was analyzed with ImageJ.
Immunoelectron microscopy
A total of 100,000 HSCs were sorted in 2%FBS/PBS, spun down at 300×g for 5 min at 4 °C, and fixed for 30 min on ice with 4% paraformaldehyde and 0.2% glutaraldehyde in 0.1 M sodium phosphate buffer pH 7.4. After fixation, cells were rinsed, dehydrated in a graded series of ethanol, and embedded in LR white medium-grade resin (Electron Microscopy Sciences). Semi-thin sections of about 0.7 µm thickness were cut on an EM UC7 ultramicrotome, stained with 0.2% toluidine blue, and examined under an ECLIPSE Si microscope. Ultra-thin sections were cut and blocked with 1% BSA/PBS for 10 min at room temperature. The sections were then incubated for 1 h at room temperature in 1% BSA/PBS with a primary antibody against p-MLKL (1.0 µg/mL). Sections were washed 3 times in PBS and incubated for 1 h at room temperature in 5 nm gold-conjugated secondary antibody against rabbit IgG (1×). Sections were washed 3 times in water, post-fixed in 1% glutaraldehyde for 10 min, and stained with 1% uranyl acetate for 3 min at room temperature. Cells were imaged on a JEM-1400Flash electron microscope (JEOL).
Recombinant protein expression and purification
N-terminal four-helix bundle domain of recombinant mouse MLKL protein (residues 1–169; MLKL-NTD), N-terminal FLAG-tagged MLKL-NTD (FLAG-MLKL-NTD), and C-terminal pseudokinase domain of recombinant mouse MLKL protein (residues 179–464; MLKL-CTD) were expressed and purified from BL21 (DE3)-RIPL Escherichia coli strains. Briefly, cells were grown in 2XTY medium (20 g/L tryptone, 10 g/L yeast extract, 5 g/L NaCl, 50 µg/ml kanamycin, 30 µg/ml chloramphenicol) to an optical density at 600 nm of 0.8 and induced with 0.5 mM isopropylthio-β-galactoside for 16 h at 22 °C. Pellets were resuspended in buffer (25 mM Tris–HCl pH 7.4, 500 mM NaCl, 1 mM TCEP, 10% glycerol, 0.05% Triton-X 100, 25 mM imidazole), lysed at high pressure, clarified by centrifuge, subjected to Ni2+ column, washed and eluted with buffer (25 mM Tris–HCl pH 7.4, 500 mM NaCl, 1 mM TCEP, 10% glycerol, 0.05% Triton-X 100, 250 mM imidazole). Elution was collected and incubated with TEV protease at 4 °C overnight to cleave off the His tag, followed by a reverse Ni2+ column to remove the TEV protease and any undigested His tag protein. The digested proteins were further polished by Superdex S200 gel filtration column pre-equilibrated with gel filtration buffer (20 mM Tris pH 7.4, 200 mM NaCl, 1 mM TCEP, 1 mM EDTA). Selected fractions were pooled and concentrated by centrifugal ultrafiltration to 1 mg/ml and dialyzed in the buffer (10 mM Tris–HCl pH 7.5, 10 mM KCl, 250 mM sucrose, 1.5 mM MgCl₂).
Isolation and treatment of mitochondria
Mitochondria were isolated from mouse liver tissue using the Mitochondria Isolation Kit for Cultured Cells (Abcam) according to the manufacturer’s protocol. Briefly, ~50 mg of liver tissue was dissected, immediately transferred into 500 µL of Reagent A pre-dispensed in the Dounce homogenizer tube, and homogenized by 30 strokes with pestle A. Homogenate was centrifuged at 1000×g for 10 min at room temperature, and the supernatant (SN1) was collected. The pellet was then resuspended in 500 µL of Reagent B, homogenized by pipetting up and down 30 times using a P1000 micropipette, and the supernatant was collected (SN2) after centrifugation at 1000×g for 10 min at room temperature. SN1 and SN2 were combined, and mitochondrial fractions were pelleted by centrifugation at 12,000×g for 15 min at room temperature. The mitochondrial pellet was resuspended in 200 µL of mitochondrial buffer (10 mM Tris–HCl pH 7.5, 10 mM KCl, 250 mM sucrose, 1.5 mM MgCl₂), and 2.5 µL of mitochondria were incubated in 87.5 µL of mitochondrial buffer for 45 min at 37 °C with 20 µM recombinant MLKL-NTD, 20 µM recombinant FLAG-MLKL-NTD, 20 µM recombinant MLKL-CTD, or 50 µM CCCP (Thermo Fisher). Treated mitochondria were stained in mitochondrial buffer containing 500 nM TMRM (Invitrogen) and 200 nM MitoTracker Green (Thermo Fisher) for 30 min at 37 °C before flow cytometry analysis. All procedures were performed without vortexing to avoid mechanical disruption of mitochondria and preserve mitochondrial membrane potential.
Seahorse assays
A total of 50,000–100,000 HSCs were sorted in SF-O3 and spun down at 300×g for 5 min at 4 °C. Cells were resuspended in Seahorse XF basic DMEM (Agilent) supplemented with 10 mM glucose, 1 mM pyruvate, and 2 mM L-glutamine, seeded in a cell-culture plate pre-coated with Cell-Tak (Corning) at a density of 50,000–70,000 cells per well, and spun down by centrifugation at 400×g for 5 min at room temperature. Oxygen consumption rate and extracellular acidification rate were measured at baseline and after sequential injections of 1 μM oligomycin, 2 μM FCCP, 0.5 μM rotenone plus 0.5 μM antimycin, and 50 mM 2-deoxy-D-glucose on a Seahorse XFe96 Extracellular Flux Analyzer (Agilent) according to the manufacturer’s instructions as described previously70. Data were normalized to seeded cell numbers, analyzed with Seahorse Analytics (v1.0.0-520), and exported to GraphPad Prism (v10.4.0).
Quantification and statistical analysis
Data are represented as mean ± standard error (s.e.m.) unless otherwise specified in the figure legends. Statistical analysis was performed using R for RNA-seq and ATAC-seq data and Prism for all the other data. The statistical test used, the number of biological replicates, and the definition of biological replicates are indicated in the figure legends. Briefly, two-tailed Student’s t-test and Mann–Whitney U-test were used when two groups were compared, and one-way ANOVA, two-way ANOVA, Welch and Brown–Forsythe test, and Kruskal–Wallis test were used when three or more groups were compared. For multiple comparisons, p-values were adjusted either by Šídák correction, Fisher’s least significant difference (LSD) test, or the false discovery rate of 5% based on the two-stage linear step-up procedure of Benjamini, Krieger, and Yekutieli, and adjusted p-values were subsequently used to indicate significance. For transplantation experiments, outliers were excluded before statistical analyses based on the PB donor chimerism at 4 months post-transplantation by using the ROUT method with a Q value set to 1%. Recipient mice with <1% PB donor chimerism at 4 months post-transplantation were excluded from the analyses of donor lineage distribution. Survival rates were compared using the Mantel–Cox log-rank test. Statistical significance is reported using exact P values.
Reporting summary
Further information on research design is available in the Nature Portfolio Reporting Summary linked to this article.