
Mapping the spatiocellular principles of lymphoma-induced LN remodeling
To decipher the overarching principles that govern the spatial organization of the human LN and its disruption upon malignant transformation, we performed comprehensive single-cell and spatial analyses of LNs displaying distinct patterns of spatial organization (Fig. 1a,b and Extended Data Fig. 1a). This included non-malignant reactive LNs (rLNs) with a canonical organization into B cell-rich follicles and T cell zones; malignant LNs from patients with FL, characterized by a follicular growth pattern of malignant B cells; and LNs from patients with DLBCL, defined by a highly diffuse growth pattern.

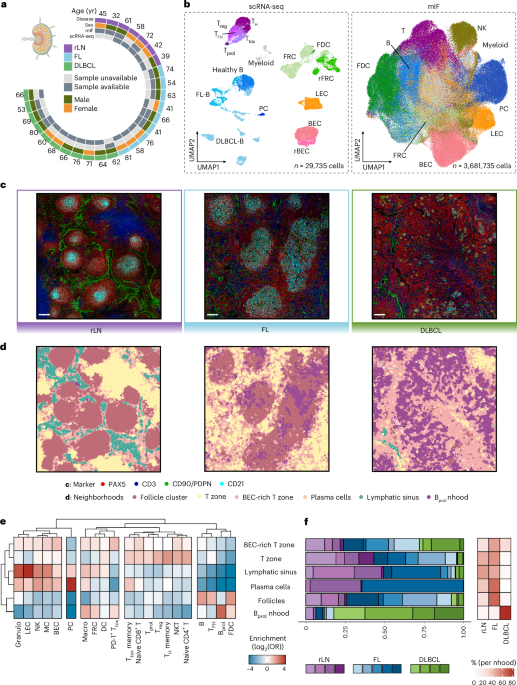
a, Sample and metadata overview for scRNA-seq and mIF data. b, UMAP embeddings of hematopoietic and non-hematopoietic cells obtained using scRNA-seq (left) and mIF (right). c, Representative mIF images of rLN (n = 4), FL (n = 5) and DLBCL (n = 4) patient samples. Scale bar, 50 μm. d, Segmented mIF images as in c, colored by neighborhood identified through k-nearest neighbors analysis. e, Heatmap depicting the enrichment of subpopulations per spatially defined neighborhood across the complete mIF dataset, based on individual cells pooled across patient samples (n = 3,681,735 cells from 13 patient samples). f, Left, bar plots illustrating the proportions of identified neighborhoods across patient samples and disease entities. Right, heatmap displaying the percentage of cells per neighborhood and disease entity. UMAP, Uniform Manifold Approximation and Projection; FDC, follicular dendritic cells; rFRC, remodeled FRCs; rBEC, remodeled BECs; PC, plasma cells; NK, natural killer cells; MC, mast cells; DC, dendritic cells; Granulo, granulocytes; Macro, macrophages; Ttox, cytotoxic T cells; Tprol, proliferating T cells; Treg, T regulatory cells; TH, T helper cells; TFH, T follicular helper cells; Bprol, proliferating B cells; nhood, neighborhood; OR, odds ratio. Schematic in a created in BioRender; Mathioudaki, A. https://biorender.com/b7kro6a (2025).
Source data
To characterize lymphoma-induced changes in LN architecture, we performed single-cell transcriptomics (single-cell RNA sequencing (scRNA-seq)) of primary single cells from rLNs (n = 5), FL-LNs (n = 6) and DLBCL-LNs (n = 8) (Fig. 1a and Supplementary Table 1). Because LNs are dominated by lymphocytes, we experimentally enriched rare mesenchymal and endothelial cells due to their expected key role in spatial LN organization1,2 (Extended Data Fig. 1b,c). This yielded 29,735 single cells with strong representation of rare non-hematopoietic cells (Fig. 1b, left, and Extended Data Fig. 1d). Following data integration and unsupervised clustering, we identified 16 cell types and states covering the majority of hematopoietic (B, T and myeloid cells) and non-hematopoietic stromal cell subsets in healthy and lymphomatous LNs9,10,11,12. The latter included various transcriptionally distinct stromal populations, such as BECs, LECs and FRCs. Among FRCs, we identified B cell zone-derived FRCs characterized by the expression of TNFSF13B (BAFF), as well as a subset of FDCs characterized by the expression of CR2 (CD21) and CXCL13 (Extended Data Fig. 2a–c and Supplementary Table 2). Stromal clusters in rLNs and FL-LNs mapped to established non-hematopoietic populations. In DLBCL, we observed additional populations of FRCs and BECs that could not be mapped to the rLN and FL-LN populations, suggesting strong stromal remodeling in DLBCL (remodeled FRCs (rFRCs) and remodeled BECs (rBECs); Fig. 1b, left, and Extended Data Fig. 2a–c). To enable comparative analyses across disease entities, we adhered to the broad categories of FRCs, BECs and LECs, unless stated otherwise.
To investigate spatial LN organization, we obtained a 56-plex multiplex immunofluorescence (mIF) dataset comprising 3.68 million cells from rLN (n = 4), FL-LN (n = 5) and DLBCL-LN (n = 4) tissue cores, partially overlapping with our scRNA-seq cohort11,12 (Fig. 1a,b, right). We identified 21 hematopoietic and structure-defining non-hematopoietic cell types or states, including PDPN+CD31+ LECs, PDPN−CD31+ BECs and PDPN+CD90+CD31− FRCs. The latter included a distinct subset of B cell zone-residing FDCs defined by CD21 and CXCL13 positivity (Fig. 1b, right, and Extended Data Fig. 2d). To characterize LN spatial organization across lymphoma entities, we defined six spatial neighborhoods using k-means clustering (Methods): (1) follicular neighborhoods dominated by B cells, FDCs and T follicular helper (TFH) cells (follicles); (2) T cell zones (T zone); (3) T cell zones with high numbers of BECs (BEC-rich T zone); (4) plasma cell-rich neighborhoods (plasma cells); (5) lymphatic sinuses; and (6) neighborhoods characterized by a high number of proliferative B cells (Bprol neighborhood) (Fig. 1c,d).
Cellular neighborhoods were largely preserved from rLNs to FL-LNs, yet their structure changed with the malignant expansion of FL cells. As expected, follicular neighborhoods were expanded in both size and number in FL (Fig. 1c–f). In rLNs, FDCs formed compact, round structures at the center of follicles, radially surrounded by B cells, whereas in FL-LNs, FDC networks appeared spatially expanded and poorly demarcated (Fig. 1c,d). Moreover, significantly enlarged plasma cell neighborhoods and an enrichment of BECs in the T cell zone were observed in FL-LNs (Fig. 1c–f). These results suggest FL-driven changes to LN architecture that are specific to stromal cell-defined structures, while overall spatial principles remain intact.
In contrast, the clear separation between B cell- and T cell-dominated neighborhoods was completely disrupted in DLBCL-LNs, consistent with a diffuse growth pattern (Fig. 1c,d). DLBCL-LNs were characterized by a single dominating neighborhood (Bprol) that mainly harbored proliferating B cells, CD8+ T cells, macrophages and expanded FRCs. Remaining FDC-like cells were mostly fragmented into small remnant islands or were entirely absent in some DLBCL-LNs. Moreover, DLBCL-LNs displayed a near-complete depletion of lymphatic vessels and an expansion of non-FDC FRCs, pointing toward a potential role of stromal cell remodeling in the structural reorganization of diffusely growing lymphomas (Fig. 1e,f and Extended Data Fig. 2e).
Together, these analyses unveil global architectural changes in the LN ecosystems of distinct lymphoma entities and provide evidence for the potential involvement of stromal cells in the spatial organization of LNs.
Chemokine rewiring underlies the loss of LN organization in lymphoma
Next, we aimed to identify molecular programs that may underlie the loss of tissue architecture in B cell lymphoma. Given the emergence of remodeled stromal cells (rFRCs and rBECs) in DLBCL (Figs. 1b and 2a), we performed differential expression analysis within each stromal compartment in our scRNA-seq data. Specifically, DLBCL- and FL-LNs were each compared separately to rLN samples (Supplementary Table 3). Notably, DLBCL-derived FRCs displayed downregulation of homeostatic chemokines (CXCL13, CXCL12, CCL19 and CCL21), which act as key players in the development and organization of LN zonation in mice13,14,15,16,17,18,19,20,21 (Fig. 2b). In contrast, interferon (IFN)-inducible inflammatory chemokines (CXCL9, CXCL10 and CXCL11) were upregulated in DLBCL-derived FRCs and BECs (Fig. 2b and Extended Data Fig. 3a,b), suggesting lymphoma-induced reprogramming of the chemokine milieu across stromal subsets. In FL-LNs, FRCs showed a similar shift in chemokine expression compared to that in rLNs, although to a lesser extent than in DLBCL-LNs, indicating a gradual change in the LN microenvironment from indolent to more aggressive disease (Extended Data Fig. 3c–e).

a, Left, UMAP of LN stromal cells by entity. Right, percentages of rFRCs and rBECs (rLN n = 5, FL n = 6, DLBCL n = 8 patients). b, Differentially expressed genes between rLN-derived (n = 2,363 cells) and DLBCL-derived (n = 2,983 cells) FRCs (adjusted P < 0.05, log(fold change) > 0.5). c, Homeostatic (top) and inflammatory (bottom) chemokine expression in bulk data22. d, Pearson correlation of CXCL13 expression and CIBERSORTx-derived FDC fractions. e, CXCL13 plasma protein levels in FL (n = 18 patients) and DLBCL (n = 22 patients). Vertical lines indicate the mean per entity. f, Exemplary rLN and DLBCL mIF images, representative of n = 4 patients per entity. Scale bar, 50 μm. Dashed circles: CD21+ regions. g, mIF-derived CXCL13 and CXCR5 signals averaged across four adjacent pairs of CD21+ follicular and CD21− extrafollicular regions per sample. h,i, Spatial transcriptomics plots of FL-LN (h) and DLBCL-LN (i) cores colored by cell type and CXCL13–CXCR5 ligand–receptor (L–R) score. j, mIF-derived enrichment of CXCL13+ cells per cell type in DLBCL versus rLN/FL samples. Asterisks indicate P < 0.01; exact P values are provided in the source data. k, CXCL13 expression in CD8+ T cells (n = 21,268 cells)12. l, Percentage of CXCR5+ cells within CD3− fractions measured by flow cytometry (rLN n = 7, FL n = 24, DLBCL n = 18 patients). m, Migrated rLN- and DLBCL-derived B cells in the Transwell assay (mean ± s.d., n = 3 patients per condition). For c and d: tonsil n = 10, FL 1/2/3A n = 145, FL 3B n = 48, DLBCL n = 430 patients. For f, g and j: rLN n = 4, FL n = 5, DLBCL n = 4 patients. P values in a, c, e, g and l: two-sided Wilcoxon rank-sum test. P value in m: two-sided unpaired Welch’s t test. P values in j: two-sided Fisher’s exact test. P values in c, g and j were adjusted using the Benjamini–Hochberg method. Box plots: center line, median; box, interquartile range; whiskers, 1.5× the interquartile range; points, data values. FC, fold change; Ttox EM, effector memory cytotoxic T cells; hr, human recombinant.
Source data
LN stromal cells represent only a minor fraction of all cells within LNs, yet they act as the main producers of homeostatic chemokines1,2. Consistent with this, the analysis of a large bulk validation cohort (healthy controls n = 10; FL 1/2/3A n = 145; FL 3B n = 48; DLBCL n = 430)22 confirmed that reprogramming of stromal cells in DLBCL translated into a reduction in the overall synthesis of homeostatic chemokines within the LN microenvironment, along with an upregulation of inflammatory chemokines with a gradual increase from non-malignant controls to FL- and DLBCL-LNs (Fig. 2c). Accordingly, we observed a progressive depletion of FDCs and FRCs, as well as an expansion of rFRCs and rBECs from FL to DLBCL (Extended Data Fig. 4a,b). In line with this, estimates of cell type abundance highlighted a strong correlation between FDC/FRC frequencies and homeostatic chemokine expression, whereas inflammatory chemokine expression was associated with high frequencies of rFRCs and rBECs, linking chemokine levels to stromal cell abundance (Fig. 2d and Extended Data Fig. 4c,d).
The chemotactic recruitment of CXCR5+ B cells to CXCL13+ FDCs is a key mechanism in the organization of LN follicles in mice14,15,17. In DLBCL, local downregulation of CXCL13 translated into a reduction in circulating CXCL13 plasma protein levels (Fig. 2e). To investigate whether downregulation of CXCL13 in stromal cells contributes to the loss of tissue organization in DLBCL-LNs, we quantified the spatial expression patterns of CXCL13 at the transcript level (10x Xenium; gene panel in Supplementary Table 4) and at the protein level (mIF). In rLN, the primary sources of CXCL13 were follicle-resident TFH cells and FDCs, establishing orthotopic chemokine gradients centered toward the follicles (Fig. 2f and Extended Data Fig. 5a). Consistent with effective chemoattraction, CXCR5+ B cells colocalized with CXCL13+ stromal cells (Fig. 2f–i). In contrast, remnant FDC-like islands in DLBCL-LNs were deprived of CXCL13 expression and lost their capacity to recruit CXCR5-presenting B cells, as demonstrated by comparing intrafollicular and extrafollicular signal intensities (Fig. 2g and Extended Data Fig. 5a–e). Both CXCL13 transcript and protein levels, as well as CXCL13–CXCR5 interactions, were diffusely distributed across DLBCL tissue cores with a shift toward extrafollicular regions, indicating a loss of physiologic CXCL13 chemokine gradients (Fig. 2f–i and Extended Data Fig. 5a–e). A global analysis within our dataset and an external single-cell dataset12 revealed that, in addition to the loss of CXCL13 in FDC-like cells, CXCL13 expression was acquired by a newly emerging subpopulation of effector memory PD-1+TIM3loCD8+ T cells in DLBCL (named Ttox EM-II by Roider et al.12), further contributing to the breakdown of structure-regulating chemokine gradients (Fig. 2j,k and Extended Data Fig. 5f–i). Importantly, DLBCL B cells maintained their CXCR5 surface expression levels, as measured by flow cytometry, and their capacity to migrate along CXCL13 gradients in transwell assays of primary DLBCL cells (Methods and Fig. 2l,m). This supports a model in which dysregulation of chemokine gradients in the microenvironment—not a direct aberration in malignant B cells—underlies the loss of tissue organization.
Together, these data reveal lymphoma-induced microenvironmental remodeling, including stromal cell reprogramming and the emergence of ectopic chemokine sources, which disrupt chemokine gradients and LN compartmentalization in DLBCL.
An inflammatory feedback loop drives stromal remodeling in lymphoma
To characterize the pathways driving stromal reprogramming in DLBCL-LNs, we performed Gene Ontology enrichment analysis of differentially expressed genes in stromal cells from non-malignant rLNs and malignant DLBCL-LNs. While rLN stromal cells were enriched for gene programs consistent with normal LN homeostasis, DLBCL stromal cells showed transcriptional reprogramming (Extended Data Fig. 6a). This included increased inflammatory- and IFNγ-driven programs, together with upregulated extracellular matrix genes across all LN stromal populations (Extended Data Fig. 6a–c and Supplementary Tables 5 and 6). Accordingly, FRCs transitioned from a state marked by high expression of homeostatic chemokines to one characterized by upregulation of IFN-driven inflammatory genes, including CXCL9, CXCL10 and CXCL11—known drivers of inflammatory immune cell recruitment (see above; Fig. 3a). In line with this, DLBCL-induced CXCL9, CXCL10 and CXCL11 expression in BECs was restricted to a previously described cellular subset of high endothelial venules, a known site of immune cell trafficking9 (Extended Data Fig. 6d).

a, Homeostatic chemokine expression versus the Hallmark IFNγ response score in FRCs (scRNA-seq). b, Top 15 differentially active transcription factors in FRCs (bottom) (n = 2,363 rLN FRCs; n = 2,983 DLBCL FRCs) and fraction of IFNγ response target genes (top). c, FRC gene regulatory network of transcription factors targeting homeostatic and inflammatory chemokines. d, Average expression of IFNG across T cell subsets12. e,f, UMAPs of CD8+ T cells from 5′ scRNA-seq data12, indicating clonotype size (e) and IFNG expression (f) (n = 75,054 cells). g, IFNG expression in FL and DLBCL-derived CD8+ Ttox cells colored by clonality status. h, T cell-to-FRC interaction analysis. Top, regulatory potential of T cell ligands to FRC target genes (chemokines; left) and ligand–receptor weight (right) (n = 2,983 FRCs and n = 1,738 T cells in DLBCL; n = 2,363 FRCs and n = 1,222 T cells in rLN). Bottom, schematic illustrating the proposed model. i, Fraction of CXCR3+ T cells per sample12. j, Top, spatial transcriptomics plots of FL- and DLBCL-LNs. Bottom, density of CXCR3+ T cells around CXCL9+ or CXCL9− FRCs. k, Schematic (left) and UMAP (right) of scRNA-seq of monocultured and cocultured iFRCs with and without DLBCL-derived B/T cells (n = 3 patients). l, IFNG expression across cell types. m, IFNγ response score in monocultured versus cocultured iFRCs. The dashed line indicates the median of monocultures. n, z-scored chemokine levels in iFRC monoculture versus coculture supernatants with LN-derived B/T cells (rLN, FL and DLBCL; n = 3 patients each). Asterisks indicate P < 0.05 after a two-sided Welch’s t test comparing each condition to monocultures (CXCL12: FL P = 0.018; CCL21: rLN P = 0.028, FL P = 0.003, DLBCL P = 0.039; CXCL10: DLBCL P = 0.021). For panels d and i: rLN n = 8, FL n = 11 and DLBCL n = 12 patients. For panels e–g: rLN n = 3, FL n = 5 and DLBCL n = 3 patient samples. For panels k–m (iFRC counts per culture condition): iFRC n = 8,606; iFRC + B n = 10,051; iFRC + T n = 6,561; iFRC + B + T n = 8,584. P values in g, i, j, l and m: two-sided Wilcoxon rank-sum test. P values in i and m were adjusted using the Benjamini–Hochberg method. Box plots: center line, median; box, interquartile range; whiskers, 1.5× the interquartile range; points, data values. TDN, double-negative T cells; TF, transcription factor; L–R, ligand–receptor. Schematic in h created in BioRender; Mathioudaki, A. https://biorender.com/t61r11n (2025).
Source data
To uncover potential transcriptional regulators mediating stromal cell reprogramming and the dysregulation of chemokine expression in DLBCL-LNs, we determined gene regulatory networks using SCENIC23 and quantified the enrichment of differentially expressed target genes for each transcription factor (Methods). These analyses revealed well-characterized IFN-inducible transcription factors, such as IRF2, IRF7, STAT1 and STAT2, as potential regulators of inflammatory chemokines, and unveiled putative regulators of homeostatic chemokine expression in LN stromal cells, including EGR1, which has previously been linked to mesenchymal cell function24,25 (Fig. 3b,c and Extended Data Fig. 7).
Consistent with increased IFN-induced activity in DLBCL FRCs, IFNG expression levels and the number of tumor-reactive, clonally expanded IFNG+ CD8+ T cells gradually increased from rLN to FL and DLBCL, providing an explanation for the extensive IFN-driven microenvironmental reprogramming in this entity (Fig. 3d–g and Extended Data Fig. 8a–c).
Cell–cell communication analysis using NicheNet26 between T cells and FRCs in our scRNA-seq data suggested an inflammatory feedback loop beginning with IFNγ-secreting tumor-reactive T cells that induce the expression of CXCL9, CXCL10 and CXCL11 in FRCs. These FRCs, in turn, chemotactically attract CXCR3+ T cells, further fueling CXCL9, CXCL10 and CXCL11 expression (Fig. 3h and Supplementary Table 7). Consistent with this, higher infiltration of CXCR3+ effector T cells was observed in FL-LNs and, to a greater extent, DLBCL-LNs, confirming the link between IFN-inducible chemokines produced by FRCs and the recruitment of inflammatory T cells through the CXCR3 receptor (Fig. 3i and Extended Data Fig. 8d). CXCR3+ T cells were located in closer proximity to CXCL9+ FRCs in DLBCL, consistent with increased inflammation-driven chemoattraction (Fig. 3j and Extended Data Fig. 8e). Notably, both cytotoxic T cells and FRCs concurrently increased in areas containing proliferating B cells, including the follicles in FL and the Bprol neighborhood in DLBCL, suggesting a close relationship between malignant B cell proliferation and inflammatory microenvironmental reprogramming (Extended Data Fig. 8e,f). Similarly, Bprol neighborhoods in DLBCL also showed infiltration by myeloid cells, including macrophages and dendritic cells, further corroborating the inflammatory state of the DLBCL microenvironment (Extended Data Fig. 8e,f).
To experimentally validate that cellular interactions with lymphocytes drive inflammatory reprogramming in LN stromal cells, we performed coculture experiments using primary lymphoid cells and DLBCL-derived immortalized FRCs (iFRCs), followed by scRNA-seq (Fig. 3k) and secretome analysis of the supernatant. Indeed, iFRCs underwent pronounced transcriptomic changes after exposure to DLBCL-derived lymphocytes, resembling the T cell-driven IFNγ-induced inflammatory phenotype switch observed in DLBCL-LNs in vivo (Fig. 3l,m). Moreover, upon coculture, an increase in inflammatory chemokines and a reduction in homeostatic chemokines were observed in the culture supernatants, confirming that cellular interactions with lymphoma-derived lymphocytes drive the reprogramming of FRCs (Fig. 3n and Supplementary Table 8).
Taken together, these findings suggest that the spatial disorganization of lymphomatous LNs is driven by an inflammatory feedback loop fueled by IFNγ-secreting tumor-reactive T cells, which reprogram LN stromal cells from a functional tissue-organizing state to an inflammatory, dysfunctional state.
Chemokine-based in silico reconstruction of LN organization
Our data suggest a model in which chemokine gradients, established by distinct subsets of stromal cells, coordinate the spatial self-organization of LNs, whereas inflammatory perturbations of these chemokine gradients in DLBCL underlie the loss of tissue architecture. To test this model, we investigated whether chemokine-based cell–cell attractions are sufficient to explain the organizational principles of LNs and their disruption in DLBCL. First, we defined the chemokine ‘attraction potential’ as the geometric mean expression of all chemokine receptors and their matching ligands (57 chemokine ligand–receptor pairs) across all possible cell pair combinations in our scRNA-seq data (Fig. 4a and Methods). Dimensionality reduction and clustering based on chemokine attraction potentials yielded a total of 63,438 sender–receiver cell pairs forming distinct clusters (Fig. 4b, Extended Data Fig. 9a and Methods)27. Importantly, several of the main clusters accurately recapitulated distinct spatio-organizational LN compartments, including their cellular composition, chemotactic attraction and underlying biology (Fig. 4b–d and Extended Data Fig. 9b). For example, one cluster recapitulated chemokine interactions and the cellular composition of T cell zones, including FRC-to-T cell interactions. Similarly, another cluster was dominated by CXCL13–CXCR5 interactions and enrichment of CXCL13+ FDCs, thus recapitulating the cellular interactions of LN follicles (Fig. 4b–d).

a, Schematic overview of scRNA-seq-based in silico interaction analysis: the geometric mean for all possible cell combinations is calculated using chemokine ligand–receptor expression as input data. b, UMAP embeddings of cell–cell attraction potentials, where each dot represents a cell pair; cell pairs cluster based on their chemokine ligand–receptor expression. Clusters are annotated according to the respective zones. c, UMAPs colored by exemplary zone-defining ligand–receptor pairs. d, Alluvial plot of sender and receiver cell type frequencies in rLN samples. Minor cell type contributions below the 50th percentile were filtered out for representation. e, Scaled fraction of cell type frequencies comparing in silico and spatially mapped interactions in rLN samples from mIF data. f, UMAPs colored by disease entities. g, Left, relative contribution of each disease entity to the annotated in silico neighborhoods and zones. Right, top five main contributing cell–cell interaction pairs within the inflammatory neighborhood. h,i, Scored expression of homeostatic (h) and inflammatory (i, left) ligand–receptor pairs, along with a UMAP colored by the scored expression of inflammatory ligand–receptor pairs (i, right). Dashed lines indicate the mean across disease entities. P values were calculated using a two-sided Wilcoxon rank-sum test and adjusted using the Benjamini–Hochberg method. j, Violin plot representing the diffuseness score (mean Euclidean distance of cells in a high-dimensional principal component space) across entities (rLN n = 17,813, FL n = 16,704, DLBCL n = 28,921 interaction pairs). P values were calculated using a two-sided Wilcoxon rank-sum test and adjusted using the Benjamini–Hochberg method. For panels b–i, analyses were based on scRNA-seq-derived cell–cell interaction pairs (rLN n = 83,570, FL n = 90,087, DLBCL n = 116,536 interaction pairs). Box plots show the median (center line), the interquartile range (box) and whiskers extending to 1.5× the interquartile range; outliers are not displayed. Infl. nhood, inflammatory neighborhood. Illustration in a created in BioRender; Mathioudaki, A. https://biorender.com/jb5q3oh (2025).
Source data
Notably, within this framework, LN stromal cells were almost exclusively identified as chemokine senders, whereas hematopoietic cells were almost always identified as receivers, supporting the notion that stromal cells act as the main organizers of LN spatial architecture (Fig. 4d). We then investigated whether in silico–calculated chemokine attraction potentials of cell pairs predict spatial organization, by systematically comparing the frequencies of predicted cellular interactions with those measured in our mIF data (Fig. 4e). Furthermore, we calculated the ligand–receptor interaction scores of zone-defining chemokine–receptor pairs in our spatial transcriptomics data (Extended Data Fig. 9b). Together, these analyses revealed a high concordance between predicted and observed interactions, suggesting that chemokine-based cell attraction potentials act as major drivers in LN self-organization in humans, in line with mechanistic data from mouse models13,14,15,16,17,18,19,20,21.
Within rLNs and FL-LNs, the vast majority of chemokine-mediated cell–cell attraction potentials were confined to T cell and B cell zones, consistent with these two organizational structures dominating the observed spatial architecture (Fig. 4f,g). As expected, an increase in B cell zone interactions was observed in FL, reflecting the larger size and greater number of B cell follicles in this disease entity. Strikingly, in DLBCL-LNs, the two main clusters representing homogeneous B and T cell zone interactions were largely replaced by a heterogeneous mixture of many small clusters, characterized by interactions specifically involving dysfunctional rFRCs (Fig. 4f,g). To quantify the variability in chemokine-mediated cell–cell attraction potentials within LNs, we calculated a ‘diffuseness score’, defined as the average Euclidean distance between cell pairs in the principal component space (Methods). This analysis confirmed a shift from homogeneous chemokine-mediated cell–cell interactions in rLNs and FL-LNs to a heterogeneous spectrum of interactions characterized by a high diffuseness score in DLBCL and loss of homeostatic chemokine cell–cell interactions (Fig. 4h–j). In line with our hypothesis that inflammation-driven microenvironmental reprogramming underlies the loss of LN spatial organization, the fragmented clusters in DLBCL were largely characterized by IFN-inducible chemotactic interactions between CXCL9, CXCL10 and CXCL11 from stromal cells and CXCR3+ immune cells (Fig. 4h–j).
Together, these data demonstrate that chemokine-mediated cell–cell attraction potentials recapitulate the major organizational principles of LNs without prior knowledge of spatial information, predict their disruption in DLBCL and support a model in which inflammation-based environmental reprogramming contributes to the loss of tissue architecture.
Homeostatic chemokines inform prognosis in B cell lymphoma
In clinical practice, indolent FL and aggressive DLBCL are largely defined by their distinct morphologies. To test whether dysregulation of structure-defining chemokine expression profiles is sufficient to identify them as distinct entities, we determined homeostatic and inflammatory chemokine signatures as proxies for spatial organization in a large bulk transcriptomics dataset22. Notably, dimensionality reduction of chemokine expression patterns was sufficient to differentiate between indolent FL with a follicular growth pattern and aggressive DLBCL with a diffuse growth pattern (Fig. 5a), thus confirming the association between specific chemokine expression profiles and lymphoma architecture across a large patient cohort.

a, UMAP representation of a microarray dataset22 with homeostatic (CXCL12, CXCL13, CCL19, CCL21) and inflammatory (CXCL9, CXCL10, CXCL11) chemokine expression values used as features for dimensionality reduction. Left, UMAP displaying pie charts (within each dot) that represent the k = 20 nearest neighbors, colored according to disease entity. Right, the same UMAP colored according to the mean expression of homeostatic (top) and inflammatory (bottom) chemokines. b, Bulk RNA-seq dataset29 stratified according to homeostatic chemokine expression into high (n = 519 patients) and low (n = 99 patients) groups using maximally selected rank statistics, shown as a dot plot (top) and a Kaplan–Meier curve of overall survival (bottom). The P value was calculated using the log-rank test. c, Forest plot summarizing log10-transformed hazard ratios (center), 95% confidence intervals (error bars) and Wald-derived P values estimated from univariate Cox proportional hazards models assessing the association between homeostatic chemokine expression and overall survival across five individual DLBCL bulk datasets22,28,29,30,31. d, Same UMAP as in a, colored by CIBERSORTx-derived FDC fractions. e, Bulk RNA-seq dataset29 stratified by FDC abundance into high (n = 255 patients) and low (n = 364 patients) groups using maximally selected rank statistics based on CIBERSORTx fractions, shown as a Kaplan–Meier curve of overall survival (left; log-rank test) and a scatter plot of log-transformed FDC fractions and CXCL13 expression (right; Pearson correlation). f, Forest plot summarizing log10-transformed hazard ratios (center), 95% confidence intervals (error bars) and Wald-derived P values estimated from Cox proportional hazards models assessing the association between FDC fraction and overall survival across five individual DLBCL bulk datasets22,28,29,30,31. For panels a and d: tonsil n = 10, FL 1/2/3A n = 145, FL 3B n = 48 and DLBCL n = 430 patients. OS, overall survival; HR, hazard ratio.
Source data
Next, we investigated whether chemokine signatures are associated with clinical endpoints and whether they reflect patient heterogeneity within DLBCL. Indeed, low expression of homeostatic chemokines was associated with adverse overall survival in five independent cohorts of DLBCL bulk transcriptomics data (n = 1,726 patients in total)22,28,29,30,31 (Fig. 5b,c and Extended Data Fig. 10). Higher fractions of FDCs, as a surrogate for remnant CXCL13 expression, translated into better overall survival across all DLBCL datasets (Fig. 5d–f and Extended Data Fig. 4e,f). Notably, homeostatic chemokine expression and survival associations were independent of clinical risk factors such as cell-of-origin annotation and the International Prognostic Index, suggesting spatial LN organization as an additional, orthogonal factor strongly linked to more aggressive disease biology in DLBCL (Extended Data Fig. 10a–f).
Together, these data support our finding that the aggressiveness of B cell lymphoma correlates with the gradual loss of LN spatial organization, which represents a crucial event in lymphomagenesis with a direct impact on patient outcomes.