
Single-immunocyte transcriptional profiling
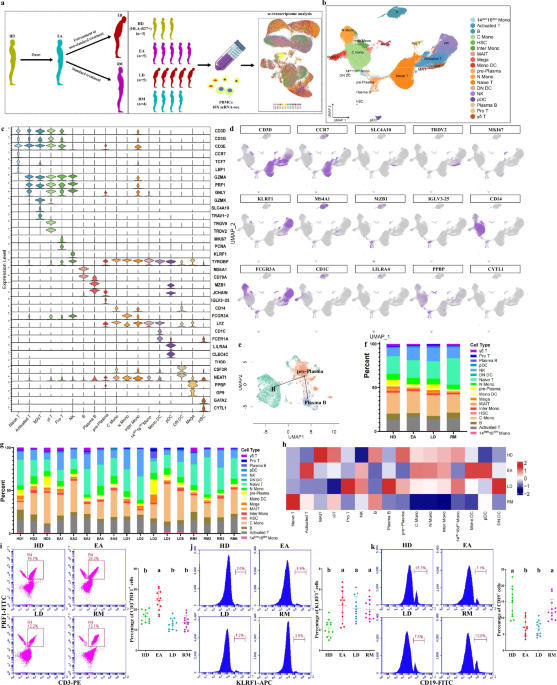
First, we conducted a scRNA-seq to investigate the transcriptomic characteristics of PBMCs from 14 patients and 3 HDs (Fig. 1a and Supplementary Table 1). Patients with AS were divided into three groups based on respective clinical characteristics: initial patients with high activity (EAs); patients with spinal deformities or joint destruction (LDs); and patients with clinical remission (RMs) (Fig. 1a). High-quality cells of each group were subjected to integration after correcting read depth and mitochondrial read count (Supplementary Fig. 1a,b). Relying on Seurat-based clustering of UMAP, we captured transcripts of 18 major cell types as following: naive-state T (naive T), activated-state T (activated T), mucosa-associated invariant T (MAIT), γδ T, proliferative T (pro T), NK, B, plasma B, pre-plasma, classic monocytes (C monos), nonclassic monocytes (N monos), intermediate monocytes (inter monos), monocytes with low expression of CD14 and CD16 (14dim16dim monos)18, monocyte-derived dendritic cells (mono DCs), plasmacytoid DCs (pDCs), CD1C–CD141− DCs (DN DCs)19, megacaryocytes (megas) and hemopoietic stem cells (HSCs) (Fig. 1b–d and Supplementary Table 6). The data highlighted a cluster of cells with low MZB1 expression, high JCHAIN expression and marked expression of multiple IGV genes; these cells were defined as pre-plasma cells on the basis of their genetic characteristics and adjacency to plasma B cells (Fig. 1b–d and Supplementary Table 6). Slingshot-trajectory analysis also revealed that pre-plasma cells were in a transitional position (Fig. 1e), which was also confirmed by the strongest clonal sharing and connectivity between pre-plasma and plasma B cells (Supplementary Fig. 1c,d).

a The overall study design showing that, after AS onset, patients in the early stage develop into patients in late stage due to untreatment or nonstandard treatment, or obtain clinical remission following standard treatment. The scRNA-seq was based on PBMCs across four conditions, and the output data were applied for single-cell transcriptome analysis. b UMAP of 118,334 single cells from HLA-B27+ HDs (n = 3), EAs (n = 5), LDs (n = 5) and RMs (n = 4) showing 18 annotated cell types with representative labels. Each dot corresponds to a single cell and is colored according to cell type. c Violin chart showing the expression distribution of typical cell markers in 18 cell types. The rows indicate various markers, and the columns indicate various cell types. d Typical cell markers in individual UMAP plots were colored according to the expression levels and distributions. e Slingshot trajectory analysis of B cells and two effector B cells revealing a dominantly linear trajectory according to high similarity between two lineages. f Proportions of various cell types from four groups. g Proportions of various cell types at sample levels. h Heat map analysis for intergroup comparison regarding the proportions of 16 main cell types. Columns were normalized, and the transition of blue–white–red indicates an increase in the proportion. i–k Flow cytometry identifying the approximate trend of activated T cells (CD3 and PRF1 antibodies) (i), NK cells (KLRF1 antibody) (j) and B cells (CD19 antibody) (k) calculated from scRNA-seq. Data were obtained from PBMCs of 12 participants in each of the HD, EA, LD and RM groups. Different letters indicate statistically significant decreases with P < 0.05. In i–k one-way ANOVA and Tukey’s post-hoc multiple comparisons were used.
Intergroup comparison of cell types showed that, compared with other groups, the proportion of naive T cells in RMs sharply increased (Fig. 1f–h). The activated T cell proportion in EAs or pro T cell proportion in LDs was the highest among the four groups, respectively (Fig. 1f–h). NK cell proportions in AS groups all increased (Fig. 1f–h). Activated T cell and NK cell trends were identified by flow cytometry showing that CD3+PRF1+ cells were the most abundant in EAs and KLRF1+ cells increased in three AS groups (Fig. 1i,j). Compared with HDs or RMs, B cell proportions in EAs and LDs were lower (Fig. 1f–h). Plasma B cell proportions increased progressively from HDs to LDs, but were decreased in RMs compared with EAs (Fig. 1f–h and Supplementary Fig. 1e). Pre-plasma cell proportions decreased in EAs but sharply increased in LDs (Fig. 1f–h and Supplementary Fig. 1e). Therefore, we suggest that both AS onset and aggravation are characterized by B cell rapid maturation whereas AS remission exhibits delayed B cell development; this was supported by the observation that CD19+ cells were more abundant in HDs/RMs than in EAs/LDs (Fig. 1k). In addition, AS onset displays obvious immune-activating characteristics, as indicated by the increased abundance of three effector-lymphocyte types (activated T, plasma B and NK), in accordance with previous studies showing that the development of immature cells into effector lymphocytes is the basic pathology of autoimmune diseases20,21 and revealing the role of effector lymphocytes in AS/spondyloarthritis (SpA)6,22,23,24,25. These results suggested that some immunosuppressants may possess positive efficacy at an early stage.
Functional changes in immunocytes across AS conditions
We relied on GSVA to explore key functional changes. Chronic inflammatory response in most cell types was stronger in AS groups than in HDs, and that in EAs was the strongest for most cell types (Fig. 2a,b and Supplementary Fig. 2a). Antibacterial peptide production in EAs was stronger than in HDs or LDs and weaker than in RMs for most cell types (Fig. 2a,b and Supplementary Fig. 2a). Bacterial lipoprotein response in EAs was stronger than in HDs or LDs and weaker than in RMs for five T cell types, B cells and NK cells (Fig. 2a,b and Supplementary Fig. 2a). These results are consistent with AS pathogenesis, which is characterized by autoimmune inflammation triggered by multiple bacterial infections26,27. In addition, type-III interferon (IFN) production in AS groups was stronger than in HDs for most cell types, and compared with EAs, LDs had lower values and RMs had higher values for most cell types (Fig. 2a,b and Supplementary Fig. 2a). ELISA results confirmed these trends, showing that serum IFN‑λ1 levels in AS groups were significantly higher than in HDs, with LDs showing the lowest levels and RMs showing the highest within the AS groups (Supplementary Fig. 2b). Type-III IFN with high expression in patients with AS is induced by bacterial ligands and restricts bacterial infection28,29. The mucosal innate immune response in EAs was stronger than in HDs or RMs for most innate immunocyte types but was overall unaltered compared with LDs (Fig. 2a,b and Supplementary Fig. 2a). Therefore, AS onset is associated with strong mucosal innate immunity—the first line of defense against pathogen invasion—which has been shown to play a key role in SpA pathogenesis30. By integrating multiple AS-triggering factors, our data not only provide a detailed interpretation for the characteristics reported in previous studies but also uncover new factors associated with AS, suggesting that infection-induced mucosal innate immunity via type-III IFN is the driving factor for AS lesions. As an antibiotic drug, sulfasalazine is considered an important conventional synthetic disease-modifying antirheumatic drug with significant efficacy in treating axial and peripheral AS5,31, and its relevance was further supported by scRNA-seq analysis. However, AS aggravation was characterized by the reduction in most functions whereas AS remission exhibited optimal antibacterial properties accompanied by weak inflammation and mucosal innate immunity. These results provide insights into achieving and maintaining a mitigatory state by highlighting the role of antibacterial activity in reducing immune inflammation. This is further supported by MR analyses, which indicate that infection serves as a risk factor for AS (Supplementary Fig. 3a–d).

a Heat maps showing relative intergroup comparisons of single-cell GSVA scores in multiple functions from corresponding cell types (lipid antigen processing and presentation via MHC-IB and antigen processing and presentation via MHC-IB are different forms of endogenous antigen presentation). Rows were normalized, and the transition of purple–black–yellow indicates an increase in the scores. b Relative intergroup comparisons of overall GSVA scores for specific functions of various cell types. Columns were normalized, and the transition of blue–white–red indicates an increase in the scores. c,d Correlation analysis between innate defense function scores (antibacterial peptide production, bacterial lipoprotein response and type-III IFN production) of 16 main cell types and various clinical parameters (CRP, ESR, BASDAI and BASFI) from patients. The number of asterisks indicates the FDR-adjusted P value (q value) (*q < 0.05, **q < 0.01, ***q < 0.001), and different colors indicate the correlation coefficient (R value). NS, not significant. e Intercellular communications showing differential action strength from five types of T cells to other cell types between corresponding groups. f Intercellular communications showing differential action strength from other cell types to T cell types between corresponding groups.
Importantly, the above results depict an outline for innate antibacterial defense: bacteria act on immunocytes via mediators such as lipoprotein, driving the bacteriostatic effect of immunocytes, including the production of antibacterial peptides and type-III IFNs.“Integration of multiple datasets revealed a meaningful biological phenomenon: innate defense is enhanced at AS onset but varies inversely with disease severity. This was supported by bulk RNA-seq of multiple PBMC samples, which showed that GSVA scores for antibacterial peptide production and type-III IFN production were increased in EAs, while three innate defense functions were negatively associated with disease severity (Supplementary Fig. 2c). These observations indicate that innate defense may be a favorable factor for improving conditions. Similar to the observed trend for innate defense, antibody-dependent cellular cytotoxicity (ADCC) in N monos and NK cells from EAs was stronger than that from HDs but weaker than that from RMs, and ADCC of LDs was weaker than ADCC of EAs in N monos (Fig. 2a and Supplementary Fig. 2a). The significance of ADCC to innate defense also supports the protective effect of innate defense on patients with AS. As expected, the scores for three innate defense functions in most cell types were negatively correlated with clinical parameters including CRP, ESR, BASDAI and the Bath AS Function Index (BASFI) in patients (Fig. 2c,d). Moreover, endogenous antigen processing and presentation was the strongest in EAs for B and plasma B cells, and that for pDCs was associated with AS severity (Fig. 2a). The simultaneous increase in endogenous antigen presentation, antibacterial peptide production and type-III IFN production for three classic antigen-presenting cells (APCs) in EAs implied the contribution of infection-induced endogenous antigen presentation to AS onset. This not only reinforces the role of abnormal peptide processing in driving AS lesions but also provides additional theoretical support for the hypothesis linking HLA-B27 to AS9,32,33.
Intercellular communications displayed that, based on EAs, T cells showed an overall increased signal output in LDs while showing an overall decreased output in RMs (Fig. 2e), revealing that T-cell-mediated signal transmission is associated with AS severity. T cells use secreted cytokines to influence other immune cells, suggesting that therapeutic improvement could be achieved by inhibiting T cell cytokine production. In addition, signal transmission from other immunocytes to T cells was presented in pDCs and plasma B cells from EAs, but based on EAs, various T cells showed an overall increased signal input in LDs while showing an overall decreased input in RMs (Fig. 2f and Supplementary Fig. 2d), revealing that T-cell-received signal transmission also participates in AS onset and outcomes. The reverse communication of multiple APCs to T cells indicates that antigen presentation is a key factor driving AS onset and progression, and its attenuation is critical for disease improvement.
NK cell dynamics across AS conditions
NK cells play a crucial role in innate defense by directly killing pathogens. We accordingly investigated the significance of NK cell taxonomy to AS lesions. After reclustering, we obtained ten NK subsets, with nine CD56/NCAM1dim subsets and one CD56bright subset (Fig. 3a–c and Supplementary Fig. 4a). We discovered that the CD56bright cell proportion (subset 5) in HDs was the highest (Fig. 3d,e). Consistently, the proportion of CD56dim NK cells to total PBMCs was the lowest in HDs (Supplementary Fig. 4b). After enriching NK cells, flow cytometry showed that CD56bright cells were more abundant in HDs than in AS groups (Supplementary Fig. 4c,e), and among total PBMCs, KLRF1+CD56dim cells from HDs were less abundant than those of other groups (Supplementary Fig. 4d,f); this verified the sequencing data. Compared with CD56dim cells, CD56bright cells possessed higher scores in negative regulation of lymphocyte-mediated immunity/NK cell activation (Supplementary Fig. 4g), and negative regulation of leukocyte-mediated immunity/leukocyte-mediated cytotoxicity/cell killing was significantly enriched in the top genes of CD56bright subset, including XCL1 and CAPG (Fig. 3f,o). This confirms noncytotoxic NK characteristics of CD56bright cells34 and reveals the involvement of noncytotoxic NK cells in AS improvement.

a UMAP projection of 15,464 NK cells. Each dot corresponds to a NK cell and is colored according to cell cluster. b UMAP projection of four conditions. c Typical markers in individual UMAP plots were colored according to the expression distribution. d Proportions of ten NK subsets from four groups. e Intergroup preferences of NK subsets 0–5. Rows were normalized, and the transition of blue–white–red indicates an increase in the proportion. f Bubble plots showing the expression distribution of top genes for subsets 0–5. g The expression distribution of top genes for subsets 0–4 across four groups. Circle size represents the percentage of cells expressing the corresponding gene (PCT), and color intensity represents the average expression level (f and g). h,i Flow cytometry identifying the approximate trend of subset 0 (HLA-DRB1 antibody) calculated from scRNA-seq. The statistical chart in i displays the quantitative results. Data come from enriched NK cells (sorting with KLRF1-APC antibody) of ten participants from each of four groups. j qPCR analysis regarding HLA-DRB1 levels. Data come from enriched NK cells of multiple participants in the HD (n = 10), EA (n = 13), LD (n = 11) and RM (n = 11) groups. Different letters indicate a significant decrease (P < 0.05), while double letters indicate no statistically significant difference between the given group and the compared groups. In h–j one-way ANOVA and Tukey’s post-hoc multiple comparisons were used. k–o Functional enrichment of the top genes in subsets 0 (k), 1 (l), 2 (m), 3 (n) and 5 (o). The enriched GO terms are labeled with their names. Circle size indicates the number of enriched genes, and color depth indicates the q value. The pivotal terms are marked in a red box. p Relative intergroup comparisons of GSVA scores in multiple functions between subsets 0–5. q Relative intergroup comparisons of GSVA scores in the endogenous antigen presentation functions from subset 0. Rows were normalized, and the transition of purple–black–yellow indicates an increase in the scores.
Next, we delved into the major CD56dim subsets. Compared with HDs, the proportion of subset 0 in EAs slightly decreased; compared with EAs, it sharply increased in LDs and decreased in RMs (Fig. 3d,e), implying that subset 0 plays a role in influencing AS severity. MHC-II complex assembly, exogenous antigen presentation and related functions were significantly enriched in the top genes of subset 0, mainly including HLA-DRB1 (Fig. 3f,k), and exogenous antigen presentation and related functions in subset 0 were the strongest (Fig. 3p), indicating that subset 0 is NK cells participating in exogenous antigen presentation. This provides an effective supplement to previous research elucidating the APC properties of NK cells35. HLA-DRB1 performs a key function in MHC-II complex assembly36; and its expression in NK cells decreased at the onset and was associated with AS severity (Fig. 3d,e), which was identified by flow cytometry and HLA-DRB1 mRNA detection for enriched NK cells (Fig. 3h–j). We accordingly believe that APC-NK may be responsible for AS aggravation; this was supported by GSVA showing a trend similar to subset-0 abundances in the exogenous antigen presentation scores from HDs to LDs/RMs (Fig. 3q). In addition, the proportions of subset 1 and subset 2 sharply increased in AS groups, but both were inversely correlated with disease severity (Fig. 3d,e), implying that subsets 1 and 2 participate in AS pathogenesis but exert a protective effect on the conditions. Podosome assembly and related functions were significantly enriched in the top genes of the two subsets, including MSN and LCP1 (Fig. 3f,l,m). Furthermore, the top genes of subset 2 were also associated with positive regulation of cell killing/NK-mediated cytotoxicity, including KLRC2 and KLRC4 (Fig. 3f,m). GSVA corresponded with the above results, describing that subsets 1 and 2 were the strongest in ADCC and positive regulation of podosome assembly (Fig. 3p). The abnormal binding of HLA-B27 to killer inhibitory receptors was implicated in AS pathogenesis37,38, and podosome is a structural foundation for cytoskeleton organization, causing cell–cell/matrix adhesion and determining NK cells–target cells/matrix interaction39. Cytotoxic NK properties of subsets 1 and 2 were accordingly supported. As the representative genes of subsets 1 and 2, MSN and KLRC2 were responsible for podosome assembly and NK-mediated cytotoxicity, respectively40,41, and their expression was significantly higher in AS groups and varied inversely with the severity (Fig. 3g). ADCC and positive regulation of podosome assembly for subsets 1 and 2 were stronger in AS groups (Supplementary Fig. 4h). IFN-γ response and neutrophil chemotaxis/migration were significantly enriched in the top genes of subset 3, including CCL4 and FCER1G (Fig. 3f,n), indicating that NK subset‑3 contributes to the neutrophil-dependent first line of defense. This is consistent with previous reports showing that NK cells promote neutrophil activation, survival and recruitment.42,43. NK subset 3 also exhibited the strongest neutrophil chemotaxis/migration (Fig. 3p). Subset-3 proportions were lower in AS groups than in HDs (Fig. 3d,e), implying that decreased subset-3 abundance contributes to AS pathogenesis. As a marker, FCER1G is responsible for the bacterial defense response and neutrophil-mediated innate immunity41; and its expression in AS groups was lower than that in HDs (Fig. 3f,g). We therefore inferred that impaired initial defense in patients with AS may be advantageous for bacterial infection and trigger subsequent immune responses, further confirming the rationality of sulfasalazine in AS treatment. Both subset-4 abundances and the top genes (CD3D/E/G) showed a sequential decrease from HDs to LDs/RMs (Fig. 3d–g), suggesting that accelerated NK cell development occurs during AS onset and progression, with CD3D/E/G serving as markers of pre‑NK cells44.
Antigen presentation characteristics across AS conditions
There seems to be a link between innate defense and antigen presentation. We therefore provided a comprehensive characterization of endogenous and exogenous antigen presentation across different AS conditions. GO analysis showed that, compared with HDs, EAs exhibited significantly upregulated functions in MHC-IB-dependent endogenous antigen presentation for B cells and pDCs, and MHC protein complex assembly for plasma B cells (Fig. 4a). The total expression of responsible genes, HLA-A/C, increased in EAs (Fig. 4b). However, based on EAs, all parameters in RMs decreased (Fig. 4a,b). B cells and pDCs may serve as the valuable endogenous APCs causing AS onset; these observations advance previous research demonstrating epitope peptide presentation from HLA-B8-expressing B cells to cytotoxic T cells and the relationship between DCs and AS45,46.

a Functional enrichment showing several antigen presentation functions for B cells, plasma B cells and pDCs between corresponding groups. Red indicates the functions associated with upregulated genes, and blue indicates the opposite. The number of asterisks indicates the q value. b The expression distribution of HLA-A/C in B cells and pDCs across four groups. c Correlation analysis between the proportions of NK subsets‑1/2, their positive regulation of podosome assembly (PRPA) and ADCC scores, and the innate defense function scores of NK cells from patients. d Correlation analysis between NK-subset-0 cell proportions, NK-subsets-1/2 cell proportions, NK-subset-0-mediated exogenous antigen presentation (APC1–3) scores, NK-subset-1/2-mediated PRPA and ADCC scores and various clinical parameters from patients. e Correlation analysis between NK-subset-0 cell proportions, NK-subset-0-mediated APC1–3 scores and innate defense function scores of 16 main cell types from patients. In b–e the number of asterisks indicates the q value, and different colors indicate the R value. NS, not significant.
We documented that overall innate defense scores and cytotoxic NK subset abundance shared similar trends and they varied inversely with APC-NK abundance and their presentation functions. Subsets 1 and 2 showed the highest scores in innate defense functions (Fig. 3p), and their functions were stronger in AS groups (Supplementary Fig. 4h). The involvement of NK-dependent cytotoxicity in innate defense is clarified, conforming to conventional understandings47,48,49. As shown in Fig. 4c, the total proportions of subsets 1 and 2 and their podosome assembly functions were positively correlated with NK-related innate defense scores, indicating that NK-dependent cytotoxicity contributes to AS onset but also to condition improvement. Furthermore, AS lesions can produce numerous proinflammatory and dead cells, suggesting that NK-mediated cytotoxicity helps establish postimmune homeostasis by scavenging redundant cells, conforming to the results showing that apoptotic signaling for most types in EAs was weaker than that in LDs but stronger than that in RMs (Fig. 2a and Supplementary Fig. 2a). As shown in Fig. 4d, the proportions of subset 0 and their antigen presentation functions were negatively correlated with the abundance of subsets 1 and 2, positive regulation of podosome assembly scores for subsets 1 and 2, and ADCC scores for subset 2, confirming the trade-off relationship between APC-like NK cells and cytotoxic NK cells. The conflict between two NK cell types suggests a connection between exogenous antigen presentation and innate defense. As expected, the scores for three innate defense functions in most cell types were negatively correlated with subset-0 proportions and their presentation scores (Fig. 4e). Remarkably, subset-0 abundance and their presentation scores were positively correlated with various clinical parameters, and cytotoxic NK abundance and their podosome assembly functions were negatively correlated with ESR, BASDAI, BASFI and Ankylosing Spondylitis Disease Activity Scores (ASDAS) (Fig. 4d). The significance of NK-dependent exogenous antigen presentation for innate defense and AS severity was described.
The impact of APC-NK on CD4+ T cell parameters
The impact of APC-like NK cells and their antigen-presentation functions on AS disease-state alterations was elucidated. The object of exogenous antigen presentation is CD4+ T cells. We accordingly conducted T cell reclustering analysis. After reclustering, we obtained 11 subtypes according to the distribution of classical markers (Supplementary Fig. 5a–d). We discovered that five effector T cell subtypes (CD4+ effector, CD8+ effector-GNLY, CD8+ effector-GZMK, CD8+ NKT and NKT cells) were specifically involved in AS onset and deterioration (Supplementary Fig. 5e,f), suggesting that AS treatment at different stages should take into account T cell specificity. However, AS remission is characterized by the overall reduction in effector T cell abundance and their functions, supporting the crucial role of stable T cell immunity in AS remission (Supplementary Figs. 5e,f and 6a,b). Among CD4+ or CD8+ cells, the trend of naive cells demonstrated that AS is characterized by rapid T cell maturation; this was validated by CCR7 mRNA detection in enriched CD4+ or CD8+ T cells (Supplementary Fig. 5g–j). CD4+ effector-subtype proportions were associated with AS severity (Fig. 5a); this was validated by flow cytometry showing the trend of CD4+GZMB+ cells in enriched T cells (Fig. 5b). GSVA showed that positive regulation of cell killing and T-cell-mediated cytotoxicity for CD4+ effector T cells strengthened in EAs and were associated with severity (Fig. 5c and Supplementary Fig. 6b). These findings suggest that CD4+ effector T cells may represent a potential therapeutic target.

a Intergroup preferences of various T cell subtypes. Columns were normalized, and the transition of blue–white–red indicates an increase in the proportion. b Flow cytometry identifying the approximate trend of CD4+ effector T cells (CD4 and GZMB antibodies) calculated from scRNA-seq. Data come from enriched T cells (sorting with CD3-FITC antibody) of 10 participants in each of four groups. Different letters indicate a significant decrease (P < 0.05). One-way ANOVA and Tukey’s post-hoc multiple comparisons. c Relative intergroup comparisons of GSVA scores in multiple functions from CD4+ effector T cells. Rows were normalized, and the transition of purple–black–yellow indicates an increase in the scores. d CFSE assays showing the proliferative potential of enriched CD4+ T cells (sorting with CD3-PE and CD4-APC antibodies) from four groups (n = 8) in the presence of CD3 and CD28 antibodies. e The expression distribution of cytotoxic genes in CD4+ effector T cells across four groups. f,g Flow cytometry showing the proportions of positive cells for two cytotoxic molecules (IFN-γ (f) and KLRK1 (g)) in CD4+GZMB+ T cells (sorting with CD3-FITC, CD4-APC and GZMB-PerCP antibodies) across four groups (n = 8). h–j Quantitative results for d (h), f (i) and g (j). k Intercellular communications showing differential action number and strength from B cells, plasma B cells, pDCs and NK subset 0 to CD4+ effector T cells between corresponding groups. l Correlation analysis between the number (count) and strength (weight) of signal transmission from APC-NK to CD4+ effector T cells and various clinical parameters from patients. The number of asterisks indicates the q value, and different colors indicate the R value. m Coculture model simulating the presentation of exogenous peptides by HLA-DRB1+ NK (sorting with KLRF1-APC and HLA-DRB1-PE antibodies) to CD4+ T cells. n CFSE assays showing the proliferative ability of CD4+ T cells cocultured with HLA-DRB1+ NK cells from four groups (n = 8) or PBS (n = 4). o Flow cytometry showing the proportions of CD4+GZMB+ cells in the cocultured cells for each group (n = 8). Quantitative results were based on the ratio of CD4+GZMB+ cells to CD4+ cells. p Correlation analysis between CD4+ effector T cell proportions and various clinical parameters from patients. The number of asterisks indicates the q value, and different colors indicate the R value. q H&E, SO-FG and HLA-DRB1/CD4 co-immunostaining (including quantification of HLA-DRB1 and CD4 fluorescence expression) in the ligament tissues from patients with AS and non-AS patients. Scale bars, 400 µm or 100 µm. Data in q come from the collected ligament samples from non-AS patients (n = 4) and patients with AS (n = 5) during surgeries. Different letters indicate a significant decrease (P < 0.05), while double letters indicate no statistically significant difference between the given group and the compared groups. In b, h–j, n and o one-way ANOVA and Tukey’s post-hoc multiple comparisons were used. In q **P < 0.01 by Student’s t-tests.
Notably, CD4+ effector T cell abundance and APC-NK shared a consistent trend; this implies a connection between the two. CFSE assays showed that CD4+ T cell proliferation from LDs increased and that of RMs decreased (Fig. 5d,h), indicating that CD4+ T cell proliferative potential corresponds to AS conditions; this validates CD4+ effector T cell abundance associated with AS severity. The expression trends of various cytotoxic genes in CD4+ effector T cells were similar to their cytotoxic functions (Fig. 5e); this was similar to flow cytometry showing that IFN-γ+ or KLRK1+ cell abundance for CD4+GZMB+ T clusters increased in LDs and decreased in RMs (Fig. 5f,g,i,j). The involvement of CD4+ T-dependent cytotoxicity in AS severity was therefore demonstrated. In addition, GSVA showed that among, three representative cytokines for AS lesions5,6,50, IL-17 or IFN-γ production in CD4+ effector T cells was stronger in AS groups than in HDs, and the production of all three cytokines was associated with disease severity (Supplementary Fig. 7a), suggesting that, besides cytotoxicity, activated CD4+ T cells serve as the producers for key cytokines that alter AS conditions, and further supporting their targetability. Based on EAs, CD4+ effector T cells showed an increase in signal input from APC-NK in LDs while showing a reduced input in RMs (Fig. 5k), indicating that signal transmission from APC-NK to CD4+ effector T cells is a crucial factor in AS severity; this was also validated by the observation showing that signal transmission number and strength from APC-NK to CD4+ effector T cells were positively correlated with various clinical parameters (Fig. 5l).
Flow cytometry showed that HLA-DPB1+ cells were more abundant in enriched HLA-DRB1+ NK cells than in HLA-DRB1− NK cells (Supplementary Fig. 7b), confirming the results in Fig. 3f and supporting the reliability of HLA-DRB1+ NK clusters. To validate the impact of APC-NK on CD4+ T cells, we established coculture systems for HLA-DRB1+ NK cells and enriched CD4+ T cells (Fig. 5m). CFSE assays revealed that coculture with HLA-DRB1+ NK cells indeed enhanced CD4+ T cell proliferation (Fig. 5n). CD4+ T cells cocultured with HLA-DRB1+ NK cells from EAs showed stronger proliferation than those for HDs, and HLA-DRB1+ NK-contributed cell proliferation was associated with the severity (Fig. 5n), supporting that the effects of APC-NK on CD4+ T cell abundance can affect AS conditions. Similarly, GZMB+ cell abundance among CD4+ T clusters was associated with severity (Fig. 5o and Supplementary Fig. 7c). Intercellular communication results were accordingly supported. Clinical parameters were positively correlated with CD4+ effector T cell abundance (Fig. 5p), further revealing their contribution to AS severity.
Next, we further evaluated the contribution of APC-NK–CD4+ T cell interactions to AS lesions using clinical histology. As shown in Fig. 5q, AS-ligament tissues presented massive new-bone formation. Moreover, CD4 and HLA-DRB1 fluorescence expression in AS-ligament tissues (HLA-DRB1 is displayed as HLA-DRB1/CD4 overlapping fluorescence) was significantly stronger than that of non-AS patients (Fig. 5q), further supporting the role of APC-NK–CD4+ T cell interactions in AS lesions from a histological perspective. In addition, the association between CD4+ T cell expansion and AS lesions was also histologically confirmed.
The significance of APC-NK–CD4+ T communication for AS-like phenotypes
Subsequently, we applied SKG mice with curdlan induction, HLA-DRB1+ NK cells and corresponding AAVs that induce specific cell death to observe the impact of NK-dependent exogenous antigen presentation on AS-like phenotypes (Fig. 6a). NK cell exhaustion or CD4+ T cell exhaustion in vivo caused by NK1.1-promoter- or CD4-promoter-diphtheria toxin receptor (DTR)-AAVs was verified, showing that both treatments respectively reduced NK1.1+ cell and CD4+ cell abundance in PBMCs and promoted the apoptosis of enriched cells (Supplementary Fig. 8a,b). Furthermore, curdlan administration increased CD4+GZMB+ T cell abundance in vivo, and the implantation of human HLA-DRB1+ NK cells further increased that of curdlan-treated mice while not affecting that of curdlan-untreated mice (Supplementary Fig. 8c). By contrast, AAV-induced NK cell exhaustion decreased CD4+GZMB+ T cell abundance in vivo (Supplementary Fig. 8d). The stimulation of CD4+ T cell activation by APC-NK was accordingly supported in vivo. As expected, HLA-DRB1+ NK cell implantation did advance the modeling of AS-like mice. In addition to the pronounced stiffness observed when peeling off the spines, mice implanted with HLA-DRB1+ NK cells exhibited marked ankle-joint swelling by week 5, indicating successful model establishment (Fig. 6b). The arthritis scores significantly increased with the above treatment (Fig. 6c). As shown on micro-CT, mice implanted with HLA-DRB1+ NK cells exhibited obvious tissue degeneration and osteophyte formation in the ankles and spines (Fig. 6e,f and Supplementary Fig. 8c). Histological assessment also showed that this treatment led to premature ankle-joint ossification and destruction, as well as spinal ossification and degeneration (Fig. 6g,h). Meanwhile, these changes were inconspicuous in conventionally modeled mice (Fig. 6b,c,e–h). However, CD4+ T cell exhaustion abolished all changes induced by the cell transfer (Fig. 6b,c,e–h). NK cell exhaustion also improved ankle-joint swelling and decreased arthritis scores in AS modeling mice receiving sufficient induction (Fig. 6b,d). NK cell exhaustion effectively improved tissue ossification and destruction in the ankles and spines (Fig. 6e–h). Subsequently, both HLA-DRB1+ and HLA-DRB1− NK cells were implanted into mice with NK cell exhaustion to further validate the precision effect of APC-NK on the above phenotypes. As shown in Fig. 6b,d,e–h, HLA-DRB1+ NK cell implantation recovered AS-like phenotypes repressed by NK cell exhaustion while HLA-DRB1− NK cell implantation had no obvious effects. Given the non-APC-NK attribute of HLA-DRB1− NK cells, these results suggest the specificity of APC-NK on AS lesions. No obvious graft-versus-host disease was found, such as rash, diarrhea or anorexia. Moreover, mouse body weight and blood indicators showed nonsignificant alterations with NK cell transfer (Supplementary Fig. 9). Therefore, the interference of heterologous immune rejection on animal experiments was excluded. These results supported the contribution of APC-NK–CD4+ T signal transmission to AS-like alterations.

a The administration model of NK1.1-promoter-DTR-AAVs, CD4-promoter-DTR-AAVs and different clusters of human NK cells. After curdlan induction, the above AAVs and enriched HLA-DRB1+ or HLA-DRB1− NK cells were applied to treat AS modeling mice by tail-vein injection, and diphtheria toxin was injected intraperitoneally 2 weeks after AAV administration to promote target-cell death. b Comparison of ankle-swelling degree between four groups of mice on the left and four groups of mice on the right (n = 5). c,d The mice from each group were evaluated with clinical arthritis scores once a week, and the overall trend was compared between corresponding groups (c CD4-promoter-DTR-AAVs-related groups; d NK1.1-promoter-DTR-AAVs-related groups) (n = 5). The different letters indicate a significant decrease with P < 0.05. In c, two-way ANOVA and Tukey’s post-hoc multiple comparisons were used. In d ***P < 0.001 by Student’s t-tests. e,f Micro-CT showing the formation of osteophytes in the ankle joints (e) and spines (f) (indicated by red arrows) as well as joint-degeneration degree across each group (n = 5). Scale bars, 2 mm (ankle joint) or 6 mm (spine). g,h H&E (g) or SO-FG (h) staining showing ankle-joint destruction, spinal degeneration and tissue ossification (displayed as green area) across each group (n = 5). The experiment was independently repeated in each group of mice. Scale bar, 200 µm. DT, diphtheria toxin; Cp-Cont-AAVs, CD4-promoter-Cont-AAVs; Cp-DTR-AAVs, CD4-promoter-DTR-AAVs; Np-Cont-AAVs, NK1.1-promoter-Cont-AAVs; Np-DTR-AAVs, NK1.1-promoter-DTR-AAVs; I.P, intraperitoneal injection; I.V, intravenous (tail-vein) injection.
HLA-DPB1/DPA1 in APC-NK participates in AS aggravation
Finally, we attempted to identify meaningful exogenous antigen-presenting molecules in APC-NK. Through intercellular communications, we discovered that HLA-DPB1/DPA1 in APC-NK from LDs had maximum communication strength with CD4 in CD4+ effector T cells (Supplementary Fig. 10a). As a T cell coreceptor, CD4 synergizes with the T cell receptor to convert antigen signals presented by MHC class II molecules into effective T cell activation, suggesting the value of the above molecules. As expected, their levels in APC-NK were similar to APC-NK abundance and their presentation scores in trend (Fig. 7a); this was supported by the association between HLA-DPB1+ cell abundance/HLA-DPB1/DPA1 mRNA levels and severity (Fig. 7b–d), thereby validating communication results. To investigate the impact of HLA-DPB1/DPA1 on CD4+ T cells, we used the lentiviral technique to overexpress these genes in NK cells from HDs and further established coculture systems with CD4+ T cells. The overexpression efficiency of two genes is shown in Fig. 7e. Flow cytometry demonstrated that HLA-DPB1/DPA1 serve as the key HLA molecules linking NK cells with CD4+ T cells by showing that lentivirus-bound EGFP and CD4 double-positive cells existed in the coculture environment (Fig. 7f). In addition, HLA-DRB1+ NK-CD4+ T mixed cells from LDs showed CD4-DPB1/DPA1 interaction that was absent in single CD4+ T cell lysate (Supplementary Fig. 10b); this was supported by the interaction between lentiviruses-binding Flag from infected cells and CD4 (Fig. 7g). Among four conditions, CD4-DPB1/DPA1 interaction for mixed cells exclusively appeared in LDs (Supplementary Fig. 10c), corresponding to communication results in Supplementary Fig. 10a. Moreover, HLA-DPB1/DPA1-overexpressed NK cells both increased the proliferation and GZMB+ cell abundance in cocultured CD4+ T cells, and HLA-DPB1/DPA1-silenced NK cells both inhibited the above parameters from LDs (Fig. 7h–k and Supplementary Fig. 10d), supporting the significance of HLA-DPB1/DPA1 for CD4+ T cell activation and AS severity. Here, we applied ovalbumin peptides to initiate antigen presentation from APC-NK to CD4+ T cells. Therefore, we need to clarify the exogenous antigens presented by APC-NK via HLA-DPB1/DPA1. Relying on the MHC-II Binding Prediction website, we discovered that OVA127-141 peptide exhibits strong binding affinity across multiple alleles of DPB1/DPA1 (Supplementary Table 5: %Rank<2% indicates strong MHC binder). We continued to confirm the association between APC-NK-DPB1/DPA1 and OVA127-141 using the gene transduction technique. As shown in Fig. 7l, OVA127-141-overexpressed NK cells from LDs effectively increased the expression of OVA127-141 in cocultured CD4+ T cells while those from other groups had no significant effect. Furthermore, HLA-DPB1/DPA1 silencing in LD NK cells both inhibited OVA127-141 expression in cocultured CD4+ T cells (Fig. 7m). The role of the OVA127-141-HLA-DPB1/DPA1 complex in APC-NK-dependent exogenous antigen presentation targeting CD4+ T cells was supported. We accordingly infer that HLA-DPB1/DPA1 contributes to AS aggravation by mediating APC-NK–CD4+ T cell antigen presentation.

a The expression distribution of various HLA genes in NK subset 0 across four groups. b,c Flow cytometry showing the proportions of HLA-DPB1-positive cells in HLA-DRB1+ NK cells across four groups (n = 8). d qPCR analysis regarding HLA-DPB1 and HLA-DPA1 levels from enriched HLA-DRB1+ NK cells of 10 participants in each of four groups. e Western blotting validation of HLA-DPB1- or HLA-DPA1-overexpressed NK cells. f Flow cytometry showing the proportions of EGFP+CD4+ cells in the cocultured cells including HLA-DPB1- or HLA-DPA1-overexpressed NK cells and CD4+ T cells (sorting with CD3-PE and CD4-APC antibodies). Data come from three repeated experiments with similar results. g Co-immunoprecipitation analysis regarding the interaction of CD4 and Flag in the cocultured cells including HLA-DPB1- or HLA-DPA1-overexpressed NK cells and CD4+ T cells. Data come from three repeated experiments with unanimous results. IP indicates immunoprecipitating antibody, and IB indicates immunoblotting antibody. h CFSE assays showing the proliferative ability of CD4+ T cells cocultured with HLA-DPB1- or HLA-DPA1-overexpressed NK cells. i Flow cytometry showing the proportions of GZMB+ cells in the CD4+ T cells (sorting with CD3-FITC and CD4-APC antibodies) cocultured with HLA-DPB1- or HLA-DPA1-overexpressed NK cells. j CFSE assays showing the proliferative ability of CD4+ T cells cocultured with HLA-DPB1- or HLA-DPA1-silenced NK cells. k Flow cytometry showing the proportions of GZMB+ cells in the CD4+ T cells cocultured with HLA-DPB1- or HLA-DPA1-silenced NK cells. Data come from six independent samples from HDs (h and i) or LDs (j and k). l Western blotting showing OVA127-141 expression in CD4+ T cells cocultured with OVA127-141-overexpressed NK cells from four groups (n = 5) or PBS (n = 5). m Western blotting showing OVA127-141 expression in CD4+ T cells cocultured with OVA127-141-overexpressed plus HLA-DPB1- or HLA-DPA1-silenced NK cells. Data come from five independent samples from LDs. **P < 0.01; ***P < 0.001; ****P < 0.0001 by Student’s t-tests. The different letters indicate a significant decrease with P < 0.05. In c, d and l one-way ANOVA and Tukey’s post-hoc multiple comparisons were used. LV, lentivirus; V, vector.