
Experimental approaches
Experiments were not performed in a blinded fashion, except where specifically stated. There were no exclusion criteria for human or animal experimentation. Mice were stratified by sex and then randomized to the different groups. Cells from human donors were also randomized.
Human studies and characteristics
Human research was conducted in accordance with protocols approved by the institutional review boards of the Friedrich-Alexander-University (FAU) of Erlangen-Nürnberg, Fondazione Policlinico Gemelli IRCCS and Hospital Clinic de Barcelona after receiving informed consent. Ultrasound-guided, minimally invasive synovial tissue biopsies were collected from individuals with early PsA (N = 6) and those with psoriasis (N = 8) at the SYNGem Biopsy Unit of the Fondazione Policlinico Universitario A. Gemelli RCCS (ID: 4951-2022) and at the Uniklinikum Erlangen (ID: 18-334_4-Bio). Additional synovial tissue from healthy donors (N = 3) was obtained at the Hospital Clinic de Barcelona (ID: HCB/2 020/0100). Punch biopsies (3 mm) from lesional skin were collected from individuals with psoriasis (N = 3) in Erlangen. Blood samples were collected from individuals with PsA (N = 29) in Erlangen. Participant information is provided in Supplementary Tables 1 and 2. All participants included fulfilled the 2006 CASPAR classification criteria for PsA46. Additional human datasets were obtained from online databases listed in the Data availability section and referenced in the text and figure legends.
Mice
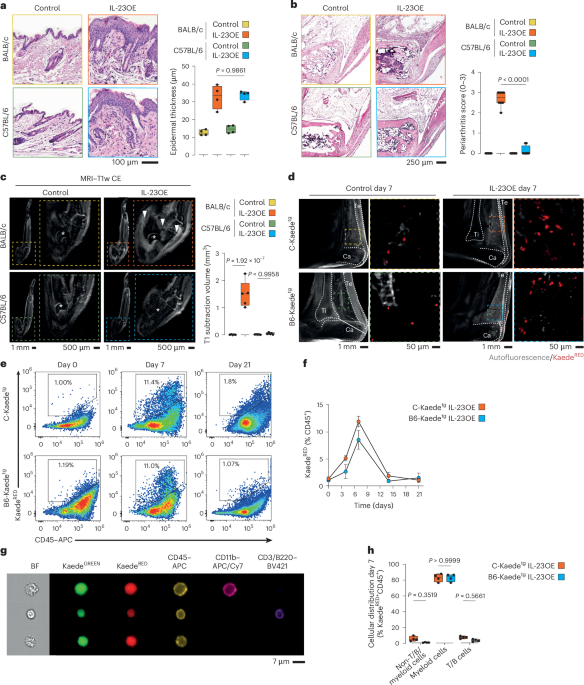
BALB/c JRj and C57BL/6 NRj male and female mice were obtained from Janvier Laboratories. C-Kaedetg (C.Cg-Tg(CAG-tdKaede)15Utr) and B6-Kaedetg (B6.Cg-Tg(CAG-tdKaede)15Utr) mice were described in Tomura et al.16 and were kindly provided by Y. Miwa and M. Tomura from the RIKEN BioResource Research Center through the National BioResource Project of the MEXT/AMED, Japan. C-Kaedetg and B6-Kaedetg mice were backcrossed to BALB/c JRj and C57BL/6 NRj mice, respectively, and only heterozygous Kaedetg male and female mice were used in the experiments. All animals were maintained under specific pathogen-free conditions with a 12-h light/12-h dark cycle, fed chow (sniff Spezialdiäten, V1534-000) and given water ad libitum. Room air temperature and cage climate were standardized at 20–24 °C, 45–65% relative humidity and 15–20 air changes per h. Mice were housed in groups of three to five animals per cage. A period of 1 week was observed between delivery and the start of the study for test animals that did not come from our own breeding program. All mice were 8–10 weeks old at the start of the study. The animal experiments were conducted in accordance with local regulations and were approved by the government of Lower Franconia (protocols 55.2-2532-2-1061, 55.2-2532-2-1886 and 55.2-2532-2-2157).
IL-23-induced model of PsA
Il23 minicircle treatment (3 µg per mouse) was administered on the first day of scoring. Scoring was continued until day 21, the end of the model. The development of skin symptoms (scaling) was monitored and reported as follows: grade 0 (no scaling), 1 (mild scaling), 2 (moderate scaling) and 3 (severe scaling). C-Kaedetg and B6-Kaedetg heterozygous mice were treated with 6 µg per mouse. The Il23 vector, which encodes the two subunits IL-12b (IL-12p40) and IL-23a (IL-23p19) linked by a flexible region under the control of the albumin promoter for efficient expression in hepatocytes, followed by a secretion sequence for efficient release into the circulation, was kindly provided by S. Wirtz (Department of Medicine 1, FAU Erlangen-Nürnberg). The vector was produced in Escherichia coli DH5α grown in terrific broth medium without removal of vector backbone. Plasmids were purified using a PureLink HiPure Plasmid Maxiprep kit (Thermo Fisher), followed by a MiraCLEAN Endotoxin Removal kit (Mirus) to ensure efficient removal of endotoxin. Next, 3 µg of naked plasmid DNA in Ringer’s solution was administered into the lateral tail vein by hydrodynamic gene transfer at a volume equivalent to 10% of body weight47,48. Blocking anti-CD200 (OX-2; clone OX-90, BioXCell) was administered intraperitoneally every other day (100 µg per dose) to C57BL/6 animals, and treatment was started on the same day as Il23 treatment. Agonistic anti-CD200R1 (OX-2R; clone OX-110, BioLegend) was administrated subcutaneously every 5 days to BALB/c animals, and treatment was started 7 days after Il23 treatment.
Imiquimod-induced psoriasis model
A 2 × 3 cm area on the dorsal skin of female BALB/c mice was shaved using an electric shaver, and any remaining hair was removed using depilatory cream (Veet). A total of 100 mg of Aldara cream (Viatris), containing 5% imiquimod, was applied daily for either 7 or 21 consecutive days. Mice treated for 21 days concomitantly received intraperitoneal injections of anti-CD200 (OX-2; clone OX-90, Bio X Cell) or a rat IgG2a isotype control (clone RTK2758, BioLegend) every other day (100 µg per dose).
UV light exposure
Mice were anesthetized with O2/isoflurane (3% (vol/vol) isoflurane, 1.2 l min−1 O2) and placed on a heating pad (37 °C). The psoriatic skin of the lower back and proximal parts of the legs was shaved, whereas the rest of the body, including the distal parts of the legs and hind paws, was shielded with aluminum foil. The skin was exposed to a UV light source for 10 min according to a previous protocol16. Briefly, a BlueWave LED PrimeCure UVA QX4 (Dymax) with a 3-mm-diameter lens was used at 51% power, and a distance of 16 cm was maintained between the skin and the lenses. The exposure was repeated for two consecutive days (–48 and –24 h) before death.
MRI
In vivo MRI of the hind paws was performed with a preclinical 7T MRI (BioSpec, Bruker BioSpin) using a volume resonator (RF RES 300 1H 075/040 QSN TR). The imaging protocol included pre- and postcontrast T1-weighted spin echo sequences and a T2 TurboRARE short tau inversion recovery sequence. During imaging, the mice received an intravenous bolus injection of a low-molecular-weight gadolinium chelating agent (0.15 mmol kg−1 gadobutrol, Bayer Vital) over a time period of 10 s via a tail vein catheter. Mice were placed on a heating pad (37 °C) and anesthetized with O2/isoflurane (3 % (vol/vol) isoflurane, 0.5 l min−1 O2), and eye ointment was applied. The volume of joint inflammation was evaluated on either short tau inversion recovery or T1-weighted images after subtraction of pregadolinium from postgadolinium was performed, and the volume of contrast-enhancing areas of the ankle joint was quantified by manual segmentation (3D Slicer49, version 5.6.1).
Histological processing of mouse samples
Hind paw joints were fixed in PBS containing 4% (wt/vol) formaldehyde for 16–24 h. After removal of the skin, the bone tissue was decalcified in 0.5 M EDTA (pH 7.4) before embedding and sectioning. Tissues were dehydrated, infiltrated and embedded in paraffin, cut into 1-µm-thin sections and mounted on standard histological slides. Thin sections were deparaffinized by heating the slides at 65 °C for 30 min, washed in Histo Clear (National Diagnostics) and rehydrated through a series of 100% (vol/vol) ethanol, 95% (vol/vol) ethanol, 80% (vol/vol) ethanol, 60% (vol/vol) ethanol and water. Mayer’s hematoxylin solution (Merck) was applied for 10 min. Excess hematoxylin was washed off, and the stain was blued by rinsing the slides for 10 min in tap water. Eosin counterstain (0.3% (wt/vol) Eosin Y (Sigma) and 0.01% (vol/vol) acetic acid) was applied for 3 min, and excess stain was washed off with deionized water. The sections were again dehydrated in isopropanol and mounted with Roti Mount mounting medium (Carl Roth). Slides were digitized with a NanoZoomer S60 (Hamamatsu), and regions of interest were exported as .TIFF files. Epidermal thickness was measured using the NDPView2 (2.7.39) program (Hamamatsu). A periarthritis score was established to assess the inflammatory infiltrate in the joints: grade 0 (no infiltrate), 1 (mild infiltration), 2 (moderate infiltration) and 3 (severe infiltration).
Microscopy image analysis
Immediately after death, the hind paws were dissected, and the skin was removed. Samples were immersed in –20 °C cooled acetone and stored at –20 °C overnight for fixation. For light sheet microscopy, ethyl cinnamate was used to clear the tissue, and imaging was performed using an UltraMicroscope II (LaVision). KaedeGREEN and KaedeRED were detected in the 488 and 594 channels. For fluorescence microscopy, the hind paws were decalcified in decalcification buffer for 2 days after fixation. Tissues were cryoprotected in 30% sucrose and 10% PVP in PBS, embedded in 30% gelatine and sectioned at 40 µm. Imaging was conducted using a Leica Thunder Imager 3D Assay with a ×63/1.4- to 0.6-NA oil immersion objective, with subsequent large volume computational clearing and maximum intensity projection. Imaging analysis was performed with IMARIS X64 (Oxford Instruments) software (v. 9.3.0) and Fiji (v. 1.52)50.
Microcomputed tomography imaging and analysis
Structures of tibial bones and paws were measured with a SCANCO Medical μCT 40 or µCT45 scanner and analyzed with SCANCO Application Center evaluation software for segmentation, three-dimensional morphometric analysis and density and distance parameters (SCANCO Medical). Three-dimensional modeling of the bone was performed with optimized grayscale thresholds of the operating system Open VMS (SCANCO Medical) and XamFlow-Workflow51.
Preparation of single-cell suspensions from mouse tissue
After death, the skin covering both legs was shaved and isolated, the subcutaneous fat was removed, and the tissue was minced with scalpels. Legs with intact ankles were dissected, and the nails were cut off. The tibia was removed by dislocation, and the tendons and joint capsules were cut to facilitate enzymatic dissociation. Skin and joint tissues were digested in RPMI 1640 containing 1.2 mg ml−1 collagenase D (Roche), 0.6 (skin) and 0.2 (joint) mg ml−1 Dispase II (Sigma-Aldrich) and 0.2 mg ml−1 DNase I (Roche). Samples were incubated three times at 37 °C for 20 min with constant shaking (2,000 rpm) on a thermal shaker (Eppendorf). After 20 min, the supernatant was collected and filtered (70 µm), and fresh digestion medium was added. The digestion was repeated for a total of three times. Red blood cell (RBC) lysis was performed using RBC lysis buffer (BioLegend) according to the manufacturer’s recommendations. Debris removal solution (Miltenyi Biotec) was used to remove impurities according to the manufacturer’s protocol. Small intestine samples were collected and, after removal of the mesentery, presoaked and rinsed in cold DMEM (Gibco) containing 20% (vol/vol) fetal bovine serum (FBS; Gibco). The tissue was then cut longitudinally and incubated with agitation in HBSS (without Ca2+; Gibco) containing 2 mM EDTA. The mucosal epithelium was isolated, and the subepithelial tissue was further washed with HBSS (without Ca2+; Gibco) and cut into pieces (5 mm2) for enzymatic digestion with HBSS (Gibco; with Ca2+ and 2% (vol/vol) FBS) containing 3.0 mg ml−1 collagenase D (Roche) and 0.2 mg ml−1 DNase I (Roche). Samples were incubated three times for 10 min at 37 °C with constant shaking (800 rpm) on a thermal shaker (Eppendorf). The resulting cell suspension was filtered (100 µm), washed with DMEM (Gibco) containing 10% (vol/vol) FBS (Gibco) and pooled with mucosal isolated cells. Cell counts were determined by trypan blue staining using an automated cell counter (Bio-Rad). For the isolation of bone marrow cells, the femur and tibia were collected, cleaned of muscle and tendons and cut at both ends. After centrifugation at 10,000g for 15 s, the resulting pellet was treated with RBC lysis buffer (BioLegend) and washed. The resulting cell suspensions from all tissues were filtered (40 µm), and cell counts were determined by trypan blue staining using an automated cell counter (Bio-Rad).
Preparation of single-cell suspensions from human tissue
Fresh human skin and synovial tissue or fresh frozen human synovial tissues were thawed, thoroughly minced and digested in RPMI 1640 containing 2 mg ml−1 collagenase D (Roche), 0.2 mg ml−1 Dispase II (Sigma-Aldrich) and 0.2 mg ml−1 DNase I (Roche) for synovial tissue or 7.5 mg ml−1 collagenase D (Roche), 2.5 mg ml−1 Dispase II (Sigma-Aldrich) and 0.5 mg ml−1 DNase I (Roche) for skin. Samples were incubated three times at 37 °C for 20 min with constant shaking (2,000 rpm) on a thermal shaker (Eppendorf). After 20 min, the supernatant was collected and filtered (70 µm), and fresh digestion medium was added. Digestion was repeated for a total of three times, and RBC lysis was performed using RBC lysis buffer (BioLegend) according to the manufacturer’s recommendations. The resulting cell suspensions were filtered (30 µm) and counted in trypan blue using a Neubauer counting chamber (Brand).
PBMC isolation
Human EDTA blood samples were collected from individuals with PsA at the outpatient clinic of the University Hospital Erlangen, as part of routine diagnostics. Written informed consent was obtained from all individuals. PBMCs were purified using Lymphosep (Biowest). Briefly, 6 ml of EDTA blood was mixed with 6 ml of DPBS (Gibco), underlaid with 4 ml of Lymphosep and centrifuged at 1,000g for 30 min without breaking. The plasma component was discarded, and the PBMC ring was collected and washed in 50 ml of PBS by centrifugation at 200g for 30 min. Erylysis (RBC Lysis buffer, BioLegend) and a second centrifugation at 100g for 30 min were performed to remove RBCs and thrombocytes, respectively.
Flow cytometry and cell sorting
Cells were stained for 30 min on ice in PBS containing 2% (vol/vol) FBS and 5 mM EDTA and then fixed with 1% formaldehyde for 20 min. Single-dye staining and fluorescence minus one controls were used to compensate and set up the gating, respectively. Dead cells were excluded using FVS510 (1:200; BD Biosciences) or eFluor 780 Fixable Viability Dye (1:4,000; eBioscience). Detailed information about all antibodies is listed in Supplementary Table 3. Anti-CD45 (30-F11; 1:1,000 dilution), anti-CD3ε (145-2C11; 1:100 dilution), anti-CD45R/B220 (RA3-6B2; 1:200 dilution), anti-Ly6G (1A8; 1:100 dilution) and anti-CD11b (M1/70; 1:1,000 dilution) were used to identify/sort KaedeRED skin-derived migrating cells in the hind paws. Antibodies used for identification of migrating myeloid precursors in the skin and in the hind paws included anti-CD45 (30-F11; 1:1,000 dilution), anti-Ly6G (1A8; 1:1,000 dilution), anti-CD11b (M1/70; 1:1,000 dilution), anti-CD2 (RM2-5; 1:1,000 dilution), anti-I-A/I-E (M5/114.15.2; 1:500 dilution), anti-CD3ε (145-2C11; 1:100 dilution), anti-CD45R/B220 (RA3-6B2; 1:200) and anti-CD11c (N418; 1:500 dilution). Antibodies used to analyze CD200 expression in the fibroblast compartment included anti-CD140a (APA5; 1:500 dilution), anti-CD45 (30-F11; 1:1,000 dilution), anti-CD90.2 (30-H12; 1:500 dilution), anti-podoplanin (8.1.1; 1:200 dilution), anti-CD31 (390; 1:500 dilution), anti-CD49f (GoH3; 1:200 dilution) and anti-CD200 (OX-90; 1:100 dilution). Antibodies used for adoptive cell transfer experiments included anti-CD45 (30-F11; 1:500 dilution), anti-Ly6G (1A8; 1:500 dilution), anti-CD11b (M1/70; 1:200 dilution), anti-CD2 (RM2-5; 1:500 dilution), anti-I-A/I-E (M5/114.15.2; 1:100 dilution), anti-CD3ε (145-2C11; 1:100 dilution), anti-CD45R/B220 (RA3-6B2; 1:200 dilution), anti-CD11c (N418; 1:500 dilution), anti-CCR7 (4B12; 1:100 dilution) and anti-CLEC10A (LOM-14; 1:100 dilution).
PBMCs were freshly analyzed by flow cytometry with anti-CD2 (RPA-2.10; 1:1,000 dilution), anti-CCR2/CD192 (K036C2; 1:500 dilution), anti-CD200R1 (OX-108; 1:100 dilution), anti-HLA-DR (L243; 1:1,000 dilution), anti-CD14 (M5E2; 1:100 dilution), anti-CD16 (3G8; 1:100 dilution), anti-CD45 (HI30; 1:100 dilution), anti-CD3 (UCHT1; 1:100 dilution), anti-CD19 (HIB19; 1:200 dilution), anti-CD56 (HCD56; 1:200 dilution), anti-CD11c (3,9; 1:100 dilution), anti-CD1C (L161; 1:1,000 dilution), anti-CD123 (6H6; 1:1,000 dilution) and anti-CD209 (9E9A8; 1:200 dilution) in the myeloid fraction in humans together with isotype IgG1, κ (MOPC-21; 1:100 dilution) and IgG2a, κ (MOPC-173; 1:200 dilution). PBMCs used for sorting and analysis of coculture experiments were stained for anti-CD3 (UCHT1; 1:200 dilution), anti-CD19 (HIB19; 1:200 dilution), anti-CD8a (SK1; 1:1,000 dilution), anti-CD4 (A161A1; 1:200 dilution), anti-CCR2 (K036C2; 1:500 dilution), anti-HLA-DR (L243; 1:200 dilution), anti-CD2 (RPA-2.10; 1:200 dilution), anti-CD1C (L161; 1:500 dilution), anti-CD123 (6H6; 1:500 dilution) and anti-IL-17A (BL168; 1:500 dilution). IL-17A was stained intracellularly using an IC fixation kit (Thermo Fisher) according to the manufacturer’s recommendations. All antibodies were purchased from BioLegend unless stated otherwise. Acquisition of cytometry data was performed with Beckman Coulter Gallios software v 1.2, while a Beckman Coulter MoFlo Astrios EQ (running with BD Astrios Summit v6.3.1; Beckman Coulter) was used for cell sorting. Sorted populations were reanalyzed to determine target cell purity after sorting (>98% purity). Flow cytometry data were analyzed with FlowJo (v. 10.10, BD Biosciences).
Adoptive cell transfer
Donor BALB/c mice were killed 7 days after Il23 treatment. Hind paws were isolated and digested, and resulting cell suspensions were stained with a cocktail of flow cytometry antibodies, as described above. Skin-derived myeloid cells were sorted from the hind paws of donors and adoptively transferred to hind paws of recipient BALB/c mice via intra-articular injection of the tarsal joints (50,000 cells per 20 µl per paw) 7 days after Il23 treatment.
Imaging cytometry
All samples were acquired using a 12-channel Amnis ImageStreamX Mark II (Cytek Biosciences) imaging flow cytometer equipped with three excitation lasers (405 nm (120 mW), 488 nm (200 mW) and 642 nm (150 mW)) and a MultiMag with three objectives lenses (×20, ×40 and ×60 magnification). Samples were acquired at ×60 magnification, and the excitation lasers (405 nm, 488 nm and 642 nm) were used at 80 mW, 5 mW and 150 mW, respectively.
Image analysis was performed using image-based algorithms in ImageStream Data Exploration and Analysis Software (IDEAS 6.2.189, Cytek Biosciences). Typical files contained imagery for 50,000 to 100,000 cells. Analysis was restricted to single cells in best focus. Single cells were identified by their intermediate size (area) and high aspect ratio (minor axis divided by the major axis) compared to debris (small area and a range of aspect ratios depending on the shape of the debris) and doublets (large area and small aspect ratio). Out-of-focus events were excluded by using the feature brightfield gradient RMS, a measurement of image contrast.
Cell culture
Mouse fibroblast–macrophage cocultures were prepared as follows. Single-cell suspensions from digested hind paws of healthy C57BL/6 mice were seeded in complete DMEM/F12 containing 10% FBS (Gibco), 100 U ml−1 penicillin–streptomycin (Gibco), 0.5 μg ml−1 amphotericin B (Gibco) and 20 mM L-glutamine (Sigma) for fibroblast expansion. The medium was changed on day 3, and the cells were passaged on day 6 using trypsin-EDTA (0.25%; Gibco). In total, 1 × 10⁵ cells of the second passage were seeded per well in a six-well plate. In parallel, 20 × 106 bone marrow cells obtained from the same mice were seeded in IMDM (Gibco) containing 10% FBS (Gibco), 100 U ml−1 penicillin–streptomycin (Gibco), 0.5 μg ml−1 amphotericin B (Gibco), 20 mM L-glutamine (Sigma) and 20 ng ml−1 recombinant mouse macrophage colony-stimulating factor (BioLegend) in a 100-mm Petri dish. The medium was changed on day 4, and on day 6 macrophages were detached using Accutase (Gibco). In total, 5 × 10⁵ cells were seeded with fibroblasts in complete IMDM enriched with 20 ng ml−1 recombinant mouse macrophage colony-stimulating factor. The following day, anti-CD200 (OX-2, clone OX-90, BioLegend; 10 µg ml−1) or isotype control (clone RTK2758, BioLegend) was added to the medium. After 24 h, the cells were collected, and RNA isolation was performed as described below.
Human monocyte–T cell cocultures were prepared as follows. Flow cytometry-based cell sorting was used to isolate CD2+ and CD2− myeloid cells as well as autologous CD8+ or CD4+ T cells from PBMCs of individuals with PsA. Cells were cultured in CD3-coated (1 μg ml−1 anti-human CD3 (clone UCHT1) in DPBS (Gibco), 4 °C overnight) 96-well, flat-bottom plates at a ratio of 1:5 (myeloid cells:T cells) in RPMI 1640 supplemented with 10% heat-inactivated FBS, 2 mM L-glutamine, 100 U ml−1 penicillin, 100 µg ml−1 streptomycin, 1× nonessential amino acid solution and 50 µM β-mercaptoethanol. Human macrophage colony-stimulating factor (50 ng ml−1, BioLegend), recombinant human IL-2 (10 ng ml−1, BioLegend), recombinant human TGFβ (5 ng ml−1, BioLegend), recombinant human IL-6 (25 ng ml−1, BioLegend), recombinant human IL-1β (10 ng ml−1, BioLegend) and recombinant human IL-23 (25 ng ml−1, BioLegend) were added to the culture. Cells were maintained at 37 °C and 5% CO2 for 6 days, with medium and cytokine replenishment every 48 h. On day 6, cells were restimulated with cell activation cocktail (PMA/ionomycin) without brefeldin A (1:1,000 dilution; BioLegend) for 1 h, followed by monensin and brefeldin A (1:1,000 dilution; BioLegend) for 3 h. Then cells were collected for analysis by flow cytometry as described above.
Gene expression analysis
RNA isolation was performed using a Nucleo Spin RNA isolation kit according to the manufacturer’s protocol (Macherey-Nagel). Immediately following extraction, total RNA concentration and ratio of absorbance at 260 and 280 nm (A260:A280) of each sample were determined using a NanoDrop 2000 (Thermo Scientific). In total, 8.2 μl of RNA was used to transcribe mRNA to cDNA, following the manufacturer’s protocol (Applied Biosystems). cDNA synthesis was performed in a total volume of 20 μl, containing 8.2 μl of RNA, 2 μl of 10× PCR buffer Ⅱ, 4.4 μl of MgCl2 solution (25 mM), 4 μl of DNTP mix, 0.5 μl of 10× RT random primers, 0.4 μl of RNase inhibitor and 0.5 μl of Multiscribe Reverse Transcriptase. The reaction mixture was incubated at 20 °C for 10 min, followed by 48 °C for 30 min and 95 °C for 5 min to inactivate the enzyme. Real-time PCR was performed in triplicate using SYBR Green master mix (Applied Biosystems) and a QuantStudio 6 Real-Time PCR System v. 1.3. Fold change expression of target genes was calculated by the change in cycling threshold (ΔCt), ΔΔCt and \({2}^{-\mathrm{\varDelta \varDelta }{C}_{{\rm{t}}}}\) comparative method for relative quantification after normalization. The endogenous control was B2m. A list of primers is provided in Supplementary Table 3.
Droplet-based scRNA-seq libraries
Skin and joint cells from six C-Kaedetg and nine B6-Kaedetg mice with equal sex distribution were pooled and sorted for Ly6G− viable KaedeRED CD45+, KaedeGREEN CD45+ and KaedeGREEN CD45− fractions on day 7 of IL-23OE. Purified cells were stained for 30 min on ice in PBS containing 1% (wt/vol) bovine serum albumin with hashtag antibodies (TotalSeq-B0301/B0302/B0303/B0304B0305 anti-mouse hashtag 1/2/3/4/5, respectively, and anti-APC-B0987 (customized), all from BioLegend) to distinguish all six fractions per inbred strain. Cells were washed, counted and concentrated to 1,000 cells per µl before pooling. In total, 24,000 cells (hyperloading) equally pooled from each strain were loaded into a single well of a Chromium Chip G (10x Genomics). Human synovial cells were loaded immediately after tissue dissociation with up to 25,000 cells in a single well of a Chromium Chip G (10x Genomics), as described above. The 3′ gene expression libraries were generated using a Chromium Next GEM Single Cell 3′ Kit 3.1 with a 3′ Feature Barcode kit and dual indexing (10x Genomics protocol CG000316 Rev C). Libraries were sequenced as paired end, 150 base pairs (bp) by Illumina sequencing to 65–80% saturation. Reads were mapped to the mm10 mouse genome (GENCODE vM23/Ensembl 98) or GRCh38 human genome (GENCODE v32/Ensembl98) using the 10x Genomics Cell Ranger pipeline (6.0.0 and 7.2.0, respectively) with default settings. Detailed descriptions of the analysis of the RNA-seq data are included in the Supplementary Information.
Generation of MAESTER libraries
To trace the lineage of specific cell populations and investigate potential migration from the skin to joints in psoriatic disease, we applied the MAESTER protocol30. In brief, single-cell suspensions were generated from paired lesioned skin and synovial biopsies obtained from individuals with PsA or psoriasis at risk and loaded onto a 10x Genomics Chromium controller using Single Cell 3′ v3.1 chemistry. Following droplet encapsulation and barcoding, cDNA synthesis and amplification were performed according to the manufacturer’s protocol. Twenty-five percent of cDNA was processed for standard scRNA-seq according to the manufacturer’s recommendations as described above, while 10 ng of the remaining cDNA was processed using the MAESTER workflow. This included an initial amplification, followed by a targeted PCR to enrich mitochondrial DNA amplicons and a final PCR to append sequencing adapters and sample indices. Sequences of mitochondrial DNA-enriching primers and sequencing adapters are listed in the original publication30.
Libraries were sequenced on an Illumina NovaSeq X system using standard 10x Genomics settings for scRNA-seq and a custom configuration for MAESTER libraries (28 bp read 1, 8 bp i7, 8 bp i5, 256 bp read 2). Sequencing data were demultiplexed and aligned to both nuclear and mitochondrial genomes to enable integrated transcriptomic and lineage analysis at single-cell resolution. Reads were mapped to the GRCh38 human genome (GENCODE v32/Ensembl98) using the 10x Genomics Cell Ranger pipeline (9.0.1) with default settings.
IMC
Synovial tissue slides were deparaffinized by heating the slides for 30 min at 65 °C and washing in Histo Clear (National Diagnostics) and rehydrated through a series of 100% (vol/vol) ethanol, 95% (vol/vol) ethanol, 80% (vol/vol) ethanol, 60% (vol/vol) ethanol and water. Heat-induced epitope retrieval was performed for 30 min at 95 °C in Tris-EDTA buffer (10 mM Tris and 1 mM EDTA, pH 9.2). After cooling for 15 min, blocking was performed in Tris buffered saline, pH 7.6, 0.05% (vol/vol) Tween 20 (TBS-T) supplemented with 3% (wt/vol) bovine serum albumin and 1% rabbit serum for 1 h at ambient temperature. A precomposed panel of metal-labeled antibodies (Supplementary Table 3) was applied to the sections. Antibodies were prelabeled with metals or conjugated according to the manufacturer’s instructions for the Maxpar X8 Multimetal Labeling kit (Standard Biotools). Indium chloride was purchased from Sigma-Aldrich (natural abundance, 96% of 115In), and 113In was purchased from Trace Science. Incubation with antibodies was performed over 16 h at 4 °C in the presence of 0.3 µM Ir-intercalator (Standard Biotools). Slides were washed twice in TBS-T for 10 min, briefly washed in deionized water, air dried and stored in a desiccated environment until analysis. Acquisition was performed at 200 Hz on a Hyperion Imaging System (Standard Biotools, CYTOF software v. 7.1). MCD files were processed using Steinbock (v. 0.16.0)52. imcRtools52 (v. 1.3.4) and R (v. 4.3.2) were used to load the data and construct a SpatialExperiment53. An inverse hyperbolic sine (arcsinh) transformation with a coefficient of 1 was applied to all the datasets. The data were normalized by computing a z score, which used the entire dataset as a reference. All data were exported as FCS files and further analyzed with FlowJo Software (v. 10.10, BD Biosciences).
Spatial analysis of IMC data
Cells were annotated by gating on the known markers using FlowJo software. After annotation, cellular neighbors were identified by using the imcRtools R package52. Cellular neighbors were defined by a centroid extension of 40 µm. To quantify interacting cells, neighbors of the cell population of interest were first retrieved, and interacting cells were defined as those that had at least one neighbor of the target cell population. Cellular pairwise interactions were analyzed using the imcRtools R package. The statistical significance of each pairwise interaction was assessed by permutation testing54. This approach quantified the average number of neighboring cells for each subpopulation and compared the results to a null distribution generated by randomly reassigning cell-type labels over 1,000 permutations. Pairwise interactions with P values below 0.05 were considered statistically significant. Attraction was defined as a higher number of neighboring cells of a specific type than would be expected in a random distribution, whereas avoidance was defined as a lower number of such neighbors than would be expected in the sample. The results are visualized by dot plots generated by using the R package ggplot2. The dot size represents the median proportion of statistically significant interactions found across samples.
Statistical analysis
Statistical analysis of nonsequencing data was performed using Prism 9. Unless otherwise stated, all data are reported as median, interquartile range and minimum–maximum. No statistical methods were used to prespecify sample sizes, but our sample sizes are similar to those reported in previous publications. Parametric and nonparametric analyses were used where appropriate. When data distribution was assumed to be normal, this assumption was not formally tested. Differences were considered significant when P < 0.05. Corrections for multiple testing were made as appropriate.
Reporting summary
Further information on research design is available in the Nature Portfolio Reporting Summary linked to this article.