
Mice
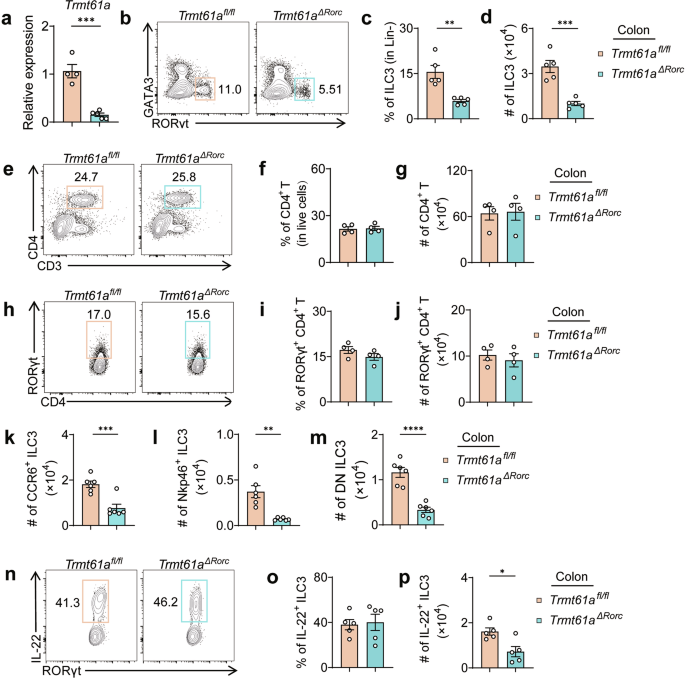
Trmt61afl/fl mice were constructed using the CRISPR-Cas9-based genome-editing system by inserting two loxP sites into the loci flanking the first exon, as previously described. Rorccre mice were kindle provided by Dr. Lei Shen, Shanghai Institute of Immunology of Shanghai Jiao Tong University, Shanghai. We crossed Trmt61afl/fl mice with Rorccre mice to obtain Trmt61afl/fl Rorccre offspring in which the expression of TRMT61A is specifically absent in ILC3s.
Mice used for in vivo studies were littermate controlled. Both male and female mice were used unless otherwise noted. All mice used in this study are on C57BL/6 background, and were maintained in specific pathogen–free facilities and used according to protocols approved by Animal Care and Use Committees of the Shanghai Jiao Tong University School of Medicine.
Isolation of intestinal lamina propria lymphocytes (LPLs) and intestinal epithelial cells
Small intestine or colon were dissected, fat tissues and peyer’s patches were removed. Intestines were cut open longitudinally and washed in PBS. Intestines were then cut into 3-cm-long pieces, washed, and shaken in PBS containing 1 mM DTT for 10 min at RT. Intestines were incubated with shaking in PBS containing 30 mM EDTA and 10 mM HEPES at 37 °C for 10 min for two cycles. Supernatant from the first round of EDTA was saved as intestinal epithelial cells. The tissues were then digested in the RPMI1640 medium (Thermo Fisher Scientific) containing DNase I (150 µg/mL, Sigma) and collagenase VIII (200 U/mL, Sigma) at 37 °C in a 5% CO2 incubator for 1.5 h. The digested tissues were homogenized by vigorous shaking and passed through 100-µm cell strainer. Mononuclear cells were then harvested from the interphase of an 80 and 40% Percoll gradient after a spin at 2500 rpm for 20 min at RT.
Flow cytometry
Anti-mouse CD16/32 antibody (Biolegend) was used to block the nonspecific binding to Fc receptors before all surface stainings. Dead cells were stained with live and dead violet viability kit (Invitrogen), and were gated out in analysis. For nuclear stainings, cells were fixed and permeabilized using a Mouse Regulatory T Cell Staining Kit (Thermo Fisher Scientific). For detection of IL-22 production in ILC3s, cells were stimulated by PMA (50 ng/mL, Sigma) and ionomycin (500 ng/mL, Sigma) for 4 h. Brefeldin A (2 µg/mL, Sigma) was added for the last 2 h before cells were harvested for analysis.
Antibodies used in this study were listed as follows:
LIVE/DEAD™ Fixable Violet Dead Cell Stain Kit, # L34964, Invitrogen, 1:1000 Zombie Aqua™ Fixable Viability Kit, # 423102, Biolegend, 1:500
CD90 BV605, # 140317, Biolegend, 1:200
CD127 FITC, # 135007, Biolegend, 1:200
NKp46 APC-ef780, # 47-3351-82, eBioscience, 1:200
CCR6 PE, # 129804, Biolegend, 1:200
GATA3 PE, # 653804, Biolegend, 1:40
RORψt APC, # 17-6981-82, eBioscience, 1:200
CD4 AF700, # 100430, Biolegend, 1:200
CD45.2 APC-CY7, # 109824, Biolegend, 1:200
CD45 PerCP-CY5.5, # 103132, Biolegend, 1:200
CD3ɛ PE-CY7, #100220, Biolegend, 1:200
CD3ɛ PerCP, # 100326, Biolegend, 1:200
CD3 BV785, # 100355, Biolegend, 1:200
TCRb PE-Cy7, # 109222, Biolegend, 1:200
CD5 PE-CY7, # 100622, Biolegend, 1:200
FcɛRI PE-CY7, # 134318, Biolegend, 1:200
F4/80 PE-CY7, # 123114, Biolegend, 1:200
CD11b PE-CY7, # 101216, Biolegend, 1:200
CD11c PE-CY7, # 117318, Biolegend, 1:200
CD11b FITC, # 101206, Biolegend, 1:200
CD11c FITC, # 117306, Biolegend, 1:200
Ki67 PE-CY7, # 652426, Biolegend, 1:200
IL-22 PE, # 51640,4 Biolegend, 1:150
Bone marrow transplantation
Bone marrow cells were isolated from the femur and tibia of Trmt61aΔRorc, Trmt61afl/fl or CD45.1 wildtype mice. Red blood cells were lysed with Red Blood Cell Lysis Buffer (Solarbio), and the remaining cells were counted. A total of 5 × 10⁶ bone marrow cells in 200 μL PBS were intravenously injected into each lethally irradiated CD45.1 wild-type recipient. Eight weeks post-transplantation, intestinal ILC3s were analyzed by flow cytometry.
Antibiotics treatments
Pregnant mice were treated with a broad-spectrum mixture of antibiotics (ampicillin (1 g/L), vancomycin (0.5 g/L), metronidazole (1 g/L), neomycin (1 g/L), and gentamicin (1 g/L)) in their drinking water. After birth, the pubs were constantly treated with the antibiotics cocktail as describe above until 2 months.
IL-22 in vivo treatment
For IL-22 treatment, 25 μg recombinant protein (novoprotein) was injected intraperitoneally in a volume of 200 μL PBS for each Trmt61aΔRorc mice.
Fecal microbiota transfer
Fresh fecal pellets were collected from Trmt61aΔRorc or Trmt61afl/fl donor mice and suspended in sterile PBS. Recipient wild-type mice were pretreated with a broad-spectrum antibiotic cocktail to deplete endogenous microbiota. 200 μL of fecal suspension was administered to each recipient by oral gavage. Recipients were maintained for 6 weeks post-transplantation before analysis of intestinal ILC3 populations by flow cytometry.
Citrobacter rodentium infection model
Citrobacter rodentium (DBS100 strain) was cultured overnight and bacterial concentration was calculated by measuring optical density at a wavelength of 600 nm (OD600) with spectrometer. Trmt61aΔRorc and Trmt61afl/fl mice or WT mice were orally infected with 1 × 10⁹ CFU of C. rodentium. Mice were weighed daily. At day 5 after infection, the colon was collected from the infected mice. Colon length was measured. Colon was fixed with 4% paraformaldehyde for histology or used for the isolation of colonic immune cells as describe above. For assessment of bacterial burden, feces were collected at day 3 and day 5 after infection, weighed and homogenized with PBS. The homogenates were plated on MacConkey agar plate and counted after overnight incubation at 37 °C under aerobic conditions.
DSS-induced colitis model
Trmt61aΔRorc and Trmt61afl/fl mice were treated with 3% DSS (MP Biomedicals) in the drinking water for 4 days and followed by regular drinking water for 2 days. Body weight was measured daily and mice were euthanized at day 6. Colon length was measured. Colon was fixed with 4% paraformaldehyde for histology or used for the isolation of colonic immune cells or colonic epithelial cells as describe above.
Histological analysis
Tissues from proximal colon were dissected and fixed with 4% paraformaldehyde. Tissues were then embedded in paraffin, sectioned at 5 µm, and stained with H&E. Sections were then blindly analyzed using the light microscope (Olympus), and scored according to a previously described scoring system58. The four parameters used include (i) the degree of inflammatory infiltration in the LP, range 1–3; (ii) Goblet cell loss as a marker of mucin depletion, range 0–2; (iii) mucosal erosion to frank ulcerations, range 0–2; and (iv) submucosal spread to transmural involvement, range 0–2.The severity of inflammation in sections of the colon was based on the sum of the scores in each parameter (maximum score = 9).
Microbiota sequencing
Fresh mouse fecal samples were collected and microbial DNA was isolated from stools of indicated mice by using QiAamp DNA Stool Mini Kit (QIAGEN) according to manufacturer’s instructions. DNA concentration was checked with Nanodrop (ThermoFisher Scientific). The V4 regions of the bacteria 16S rRNA gene were amplified by PCR using primers 515F-806R. 16S rRNA sequencing was performed by Oebiotech (Shanghai, China).
RNA-seq analysis
About 1 × 10⁴ ILC3s (Lin−CD45.2intThy1.2hi) were sorted from the colon of Trmt61aΔRorc and Trmt61afl/fl mice separately and were lysed in Trizol (Invitrogen). The total RNA was extracted. Biological duplicates were generated for each group. The total RNA sample was digested by DNaseІ (NEB), and purified by oligo-dT beads (Dynabeads mRNA purification kit, Invitrogen), then poly(A) containing mRNA were fragmented into 130 bp with First-strand buffer. First-strand cDNA was generated by N6 primer, First Strand Master Mix and Super Script II reverse transcription (Invitrogen) (reaction condition: 25 °C for 10 min; 42 °C for 40 min; 70 °C for 15 min). Then add Second Strand Master Mix to synthesize the second-strand cDNA (16 °C for 1 h). Purified the cDNA with Ampure XP Beads (AGENCOURT), then combine with End Repair Mix, incubate at 20 °C for 30 min. Purified and add A-Tailing Mix, incubate at 37 °C for 30 min. Then combine the Adenylate 3′ ends DNA, Adapter and Ligation Mix, incubate the ligate reaction at 20 °C for 20 min. Several rounds of PCR amplification with PCR Primer Cocktail and PCR Master Mix were performed to enrich the cDNA fragments. Then the PCR products were purified with Ampure XP Beads (AGENCOURT). The Qualified libraries will amplify on cBot to generate the cluster on the flowcell (TruSeq PE Cluster Kit V3–cBot–HS, Illumina). The amplified flowcell will be sequenced pair end on the HiSeq 2000 System (TruSeq SBS KIT-HS V3, Illumina), read length 50. Reads were mapped to Mouse Genome Assembly GRCm38.p5 by STAR v2.5. Gene and isoform expression quantification was called by RSEM v1.2 with default parameters on GENCODE mouse M16 gene annotation file. Differential expression analysis was performed by Bioconductor package edgeR v3.18.1. Significantly changed genes were chosen according to two criteria: (1) significance level p < 0.05; (2) fold change > 2, and were used for gene ontology enrichment analysis using the website of Gene Ontology Consortium (http://www.geneontology.org). Gene set enrichment analysis was performed using GSEA software (Broad Institute). Normalized heatmap was based on the standard score (Z score) and generated with oebiotech cloud platform (https://cloud.oebiotech.com/task/). The standard score of a raw score x is Z = x−μσ, where μ is the mean of the FPKM value of each sample and σ is the standard deviation of the FPKM value of each sample.
Quantitative real-time RT-PCR
RNA was isolated with Trizol reagent (Invitrogen). cDNA was synthesized using the GoScript™ Reverse Transcription kit (Promega). Real-time PCR was performed using SYBR Green (Bio-rad). Reactions were run with the Bio-Rad CFX384. The results were displayed as relative expression values normalized to β-actin.
|
Target |
Primer Sequence (5′-3′) |
|---|---|
|
Trmt61a Forward |
ATGAGTTTCGTGGCATACGAG |
|
Trmt61a Reverse |
CCTCTGCTGCAAATCACCTT |
|
Reg3g Forward |
CAAGGTGAAGTTGCCAAGAA |
|
Reg3g Reverse |
CCTCTGTTGGGTTCATAGCC |
|
Reg3b Forward |
CCACTCTGGGTGCAGAAC |
|
Reg3b Reverse |
AATTCGGGATGTTTGCTGTC |
|
Reg3a Forward |
TCACCTGGTCCTCAACAGTATT |
|
Reg3a Reverse |
GGAGCGATAAGCCTTGTAACC |
|
E2f1 Forward |
CTCGACTCCTCGCAGATCG |
|
E2f1 Reverse |
GATCCAGCCTCCGTTTCACC |
|
E2f1 Forward |
CTGAGCGAAGTATTGGAGACAG |
|
E2f1 Reverse |
CTGCGGATTGTTTGGCTTCC |
|
Birc5 Forward |
GAGGCTGGCTTCATCCACTG |
|
Birc5 Reverse |
CTTTTTGCTTGTTGTTGGTCTCC |
|
Casp6 Forward |
GGAAGTGTTCGATCCAGCCG |
|
Casp6 Reverse |
GGAGGGTCAGGTGCCAAAAG |
Bacterial DNA extraction and real-time PCR
Fecal pellets were collected and total bacterial DNA was extracted using the Stool DNA Kit (Omega Biotek). Quantitative PCR for detection of specific Muribaculaceae strains was performed with SYBR Green (Bio-Rad) and normalized to total bacterial DNA. Reactions were run with the Bio-Rad CFX384. Primers used in this study were shown below59.
|
Target |
Primer Sequence (5′-3′) |
|---|---|
|
All bacteria |
Forward CGGTGAATACGTTCCCGG |
|
All bacteria |
Reverse TACGGCTACCTTGTTACGACTT |
|
Muribaculum intestinale |
3SKV Forward AACAACAACCAGCTGACAAT |
|
Muribaculum intestinale |
3SKV Reverse AGTAGTTCCACTGGCAGG |
|
Muribaculum intestinale |
NM65 Forward GTAACAACAACCAGTTGACAT TG |
|
Muribaculum intestinale |
NM65 Reverse TAATAGTTCCACTGGCATGCA |
|
Muribaculum intestinale |
NM06 Forward CAACAACAACCAGCTGACTAT G |
|
Muribaculum intestinale |
NM06 Reverse AATAGTTCCACTGACATGCC |
|
Muribaculum intestinale |
7GAM Forward AACAACAACCAGTTGACCAT G |
|
Muribaculum intestinale |
7GAM Reverse TAGTAGTTCCACTGGCAGG |
|
Muribaculum intestinale |
8CFAA Forward AACAACAACCAGCTGACAAT |
|
Muribaculum intestinale |
8CFAA Reverse CAACAACAACCAGCTGACA AT |
|
Muribaculum intestinale |
8FP Forward CAACAACAACCAGCTGACAAT |
|
Muribaculum intestinale |
8FP Reverse AGTAGTTCCACTGGCAAGC |
|
Muribaculum intestinale |
6FAAM Forward CAACAACAACCAGCTGACA AT |
|
Muribaculum intestinale |
6FAAM Reverse TAGTTCCACTGGCATGCC |
|
Muribaculum intestinale |
16COLB Forward CAACAACAACCAGCTGACA AT |
|
Muribaculum intestinale |
16COLB Reverse CAATAGTTCCACTGGCATGC |
Statistical analysis
Unpaired Student’s t-tests and two-way analysis of variance (ANOVA) were used to compare pairs of groups, and all data are presented as the means ± SEM. p values of < 0.05 were considered statistically significant.