
Materials
Gibco BRL Co. (Grand Island, NY, USA) provided the tissue culture reagents, fetal bovine serum (FBS) (#16000044), and RPMI-1640 medium (Roswell Park Memorial Institute, #11875093). The primary antibodies obtained from Santa Cruz biotechnology (Santa Cruz, CA, USA), which comprised anti-p65 (#sc-8008), anti-COX-2 (#sc-19999), anti-iNOS (#sc-7271), anti-HO-1 (#sc-10789), anti-β-actin (#sc-47778), anti-Nrf2 (#sc-518036), and anti-PCNA (anti-proliferating cell nuclear antigen; #sc-25280). Rabbit (#AP510), and mouse (#AP308P) secondary antibodies were available from Millipore (Billerica, MA, USA). To measure the levels of PGE2 (#KGE004B), TNF-α (#MTA00B), and IL-6 (#D6050B), we used enzyme-linked immunosorbent assay (ELISA) kits, which were produced from R&D Systems, Inc. (Minneapolis, MN, USA). Kits for transcription factor NF-κB (#10007889) and nuclear extraction (#10009277) were acquired from Cayman (Cayman, Ann Arbor, MI, USA).
Preparation of the S. horneri powder and their extractions
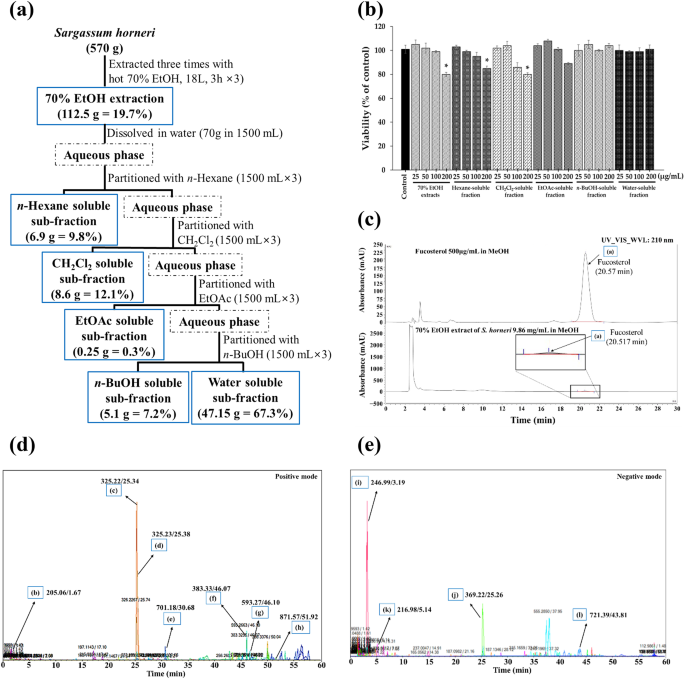
We prepared dried S. horneri powder, its 70% ethanol (EtOH) extract, and its subfractions following a previously described method, with minor modifications21. Briefly, the washed and dried S. horneri samples were provided by Prof. Sang Rul Park (collected in April 2022 from the Jeju coast, Jeju National University, South Korea). Thereafter, 570 g of dried S. horneri powder was extracted three times using 70% EtOH under reflux, and residue (112.517 g) collected. We suspended 70 g of the obtained residue in water, and the soluble extract was sequentially partitioned with equal volumes of ethyl acetate (EtOAc; #270989), n-hexane (#HX0293), n-butanol (n-BuOH; #71363), and dichloromethane (CH2Cl2; #75092) were acquired from Sigma-Aldrich (St. Louis, MO, USA). Each of the subfractions was evaporated using vacuo to yield EtOAc, n-BuOH, n-Hexane, CH2Cl2, and water residues.
High-performance liquid chromatography (HPLC) analysis
During this process, 9.86 mg of S. horneri 70% EtOH extract was dissolved in 1 mL of methanol, and the resulting mixture was subjected to HPLC analysis. An HPLC system containing a quaternary pump (#50400031, LPG-3400SD, Thermo Fisher Scientific) and diode array detector (#50820010, DAD-3000, Thermo Fisher Scientific) was connected to an HPLC column (#501218097, YMC-Triart C18, 5 µm, 4.6 × 250 mm; Thermo Fisher, Waltham, MA, USA) for analysis. In the isocratic solvents, 3:97% of channels (A) and (B) containing 0.1% acetic acid (#64197) with distilled water and methanol (#34860) respectively; which were acquired from Sigma-Aldrich (St. Louis, MO, USA) were used, and maintained at a 1-mL/min flow rate during the analysis. Thereafter, 50 µL of the S. horneri extract was injected, and 50 µL of fucosterol (PubChem CID: 5281328) was subsequently used as a standard (2.5 mg/mL fucosterol (≥ 98%) in methanol; Aktin Chemicals Inc., Chengdu, China). Absorbance was measured at a wavelength of 210 nm. Sample quantity was analyzed using a calibration graph at various fucosterol concentrations (10–500 µg mL−1)21.
Analysis of S. horneri component profiles
The components of the dried S. horneri sample were analyzed using ultra-high-performance liquid chromatography-mass spectrometry (UPLC-MS). A chromatographic column (2.1 mm × 150 mm; 1.6 μm, #176003170, Waters Technologies, Milford, MA, USA) was attached to an Dionex™ Ultimate 3000 column (#57300010, Thermo Dionex, Sunnyvale, CA, USA). The following mobile phases were used: 0.1% formic acid aqueous (A) (#64186) and 0.1% formic acid acetonitrile (B) (#75058), which were produced from Sigma-Aldrich (St. Louis, MO, USA). Briefly, 80% methanol was used to dissolve the S. horneri extract. Then, for component analysis, 3 μL of a 20 mg mL−1 S. horneri extract solution was added to the device. This was the gradient program, with the mobile phase flow rate set at 0.3 mL min−1. The solvent B concentrations were 5% (0–10 min), 30% (10–30 min), 100% (30–55 min), and 1% (55–60 min). To analyze the data, Elements Viewer (version 2.1) was utilized22,68.
Antioxidant activities of S. horneri 70% EtOH extract and its subtractions
S. horneri ethanolic extract and its subfractions antioxidant activity were evaluated by scavenging DPPH (2,2-diphenyl-1-picrylhydrazyl; #1898664, Sigma-Aldrich, St. Louis, MO, USA) and ABTS (2,2′-Azino-bis (3-ethylbenzothiazoline-6-sulfonic acid; #30931670, Sigma-Aldrich, St. Louis, MO, USA) radicals in vitro as described earlier23. In brief, methanol was used to dissolve 0.20 mM of DPPH solution. Samples were generated at different concentrations (0.0625, 0.125, 0.25, 0.5, 1, 2, and 4 mg mL−1). Next, 50 µL of each sample and 150 µL of DPPH solution were added. Following a 15 min dark incubation period, the combination as a whole was tested for absorbance at 517 nm for each sample. The formula for calculating the DPPH radical scavenging activity (%) is (Acontrol−Asample)/Acontrol × 100, where Asample denotes the test sample’s absorbance and Acontrol denotes the control group’s absorbance. Half inhibitory concentration (IC50) values were also calculated using the fraction concentration relationship curve and the DPPH radical scavenging radical activity of the relevant samples.
The ABTS reagent was prepared by adding 7 mM ABTS and 140 mM potassium persulfate solutions. After a 16-h dark period to encourage the production of free radicals, the mixture was diluted with water. A 96-well plate was filled with the sample (100 µL) and the ABTS reagent (100 µL). Following an incubation period of six minutes at room temperature, the absorbance at 734 nm was determined. The equation for the analysis of ABTS scavenging activity (%) is (Blank O.D.−Sample O.D.)/Blank O.D. × 100. The corresponding sample concentration curve against the radical scavenging activity percentage (%) was used to compute the IC50.
The viability assay for RAW264.7 macrophage cell culture
RPMI-1640 medium supplemented with heat-inactivated FBS (10%), streptomycin (100 mg mL−1) (#3810740), penicillin G (100 units mL−1) (#69578), and L-glutamine (2 mM) (#56859) were available from Sigma-Aldrich (St. Louis, MO, USA), and used to culture the RAW264.7 cells at a density of 5 × 10⁵ cells mL−1. Subsequently, the cells were then incubated at 37 °C in a humidified atmosphere containing 5% CO221. To determine S. horneri 70% EtOH extract and its subfractions on macrophage cell viability by the assessment of mitochondrial reductase function. The basic principle of this method follows that the tetrazolium salt 3-[4,5-dimethylthiazol-2-yl]-2,5-diphenyl tetrazolium bromide (MTT) (#298931) was reduced into crystal-type formazan24. To evaluate the viability of the cells, 1 mL of RAW264.7 cells (1 × 10⁵ cell mL−1) from each group were placed in a 96-well microplate. 50 mg mL−1 of MTT was added, and the cells containing formazan crystals were allowed to dissolve in dimethyl sulfoxide (DMSO) (#67685) for 4 h. The optical density value of the samples was then measured at 540 nm wavelength.
Nitrite analysis as an indicator of NO production
To analyze NO production in macrophages, we measured the levels of stable nitrite, which is the end-product of NO oxidation, using the reagents were acquired from Sigma-Aldrich (St. Louis, MO, USA). We determined nitrite concentrations using the Griess reaction method25. In summary, the process involved adding 100 mL of the supernatant portion of the sample to 100 mL of Griess reagent (1% [w/v] sulfanilamide (#63741) and 0.1 percent (w/v) N-(1-naphthyl)-ethylene diamine (#1465254) in 5% (v/v) phosphoric acid (#7664382) and letting it sit at room temperature for 10 min. Next, determine the absorbance at 540 nm spectrophotometrically using an ELISA plate reader.
Determination of PGE2 levels
R&D Systems, Inc. (Minneapolis, MN, USA) used a commercially available kit approach to test the PGE2 concentration levels26. In short, 48-well microplates were used to cultivate the subfractions of RAW264.7 cells after they were subjected to varying doses of S. horneri extract for three hours. The macrophage cells were then exposed to LPS (1 μg mL−1) for 24 h. Following this, the cells were centrifuged for 2 min at 13,000 × g, after which the part of the cell culture supernatants was collected and the particulate debris was eliminated. A 96-well microplate that had been pre-coated with PGE2-specific polyclonal antibodies was filled with the collected supernatant portion. After that, fill the 96-microwell plates with enzyme-linked polyclonal antibodies and allow them to react for 20 h. Finally, wash the plates to get rid of any leftover unbound enzyme-antibody solution. Add a substrate solution after that, then evaluate the color intensity at 450 nm to determine how much PGE2 is present in the sample.
Determination of TNF-α and IL-6 levels
To assess each sample’s TNF-α and IL-6 levels using an ELISA kit in accordance with R-D Systems, Inc. (Minneapolis, MN, USA)21. In summary, 48-well microplates containing 5 × 10⁵ cells/well were seeded with RAW264.7 macrophages, and the cells were pre-incubated for three hours using different doses of S. horneri extracts and its sub-fractions. Thus, LPS treatment (1 μg mL−1) was used to excite macrophages for a duration of 24 h. After that, the supernatant portion was separated and the cytokine ELISA kit method was used to determine the amounts of TNF-α and IL-6.
Preparation of cytosolic and nuclear fractions
The cytosolic and nuclear fractions of RAW264.7 macrophage cells were obtained by lysing each fraction in compliance with the manufacturer’s instructions using Cayman’s Nuclear Extraction Kits (Cayman, Ann Arbor, MI, USA)27.
NF-κB DNA-binding activity
As directed by the manufacturer, we used the NF-κB Transcription Factor Assay kit (Cayman, Ann Arbor, MI, USA) to examine nuclear extracts in order to determine the NF-κB DNA-binding activity21.
NF-κB p65 localization and immunofluorescence analysis
For the NF-κB p65 localization, 100 μg mL−1 S. horneri extracts and their fractions were added to cultured RAW264.7 macrophages in Lab-Tek II slides chambers (#C7057, Sigma-Aldrich) for three hours. The macrophages were then exposed to 1 μg mL−1 LPS (#EC2974730, Sigma-Aldrich) for an hour. The cells were permeabilized using cold acetone after they had been fixed in formalin. After that, macrophages were probed with p65 antibodies and treated with fluorescein isothiocyanate (FITC)-labeled secondary antibody (#174, Alexa Fluor 488, Invitrogen, Carlsbad, CA, USA). Using 1 µg mL−1 of DAPI (4ʹ,6-diamidino-2-phenylindole; #28718903, Sigma-Aldrich) for 30 min, a 5 min phosphate-buffered saline wash, and the addition of 50 μL of Vectashield® mounting medium (#H1800, Vector Laboratories, Burlingame, CA, USA) were the steps involved in the staining method for macrophages. Using a Zeiss fluorescent microscope (#Provis AX70, Olympus Optical Co., Tokyo, Japan), the stained macrophages were observed and photographed28.
Experimental animals and diet
We obtained male ICR mice with an average weight of 32 g at five weeks of age from Orient Bio (Orient Bio Inc., Seongnam, Korea). The animals were housed in accordance with the Chonnam National University Guidelines for the Care and Use of Laboratory Animals. Before beginning the experiment, they took a week to acclimate to a room including a 12 h light/dark cycle and a 55.5% humidity control. After a week of acclimatization, the four groups of six mice each were randomly assigned to the mice in this study: (1) Standard diet-fed normal group (NOR), (2) high-fat/high-cholesterol diet-fed obesity control group (CON), (3) high-fat/high-cholesterol diet group fed with 1.5% S. horneri powder (SH1), and (4) high-fat/high-cholesterol diet group fed with 3% S. horneri powder (SH2). Furthermore, NOR mice were fed the following substances per kilogram of food: 200 g of casein lactic, 100 g of sucrose, 50 g of cellulose, 100 g of lard, 35 g of mineral mix, 10 g of vitamin mix, and 2 g of choline chloride (#AIN76, G-bio Co., Ltd., Gwangju, Korea) were all included. With the exception of maize starch (390 g), lard (200 g), and cholesterol (10 g), the diets (#D12451, RaonBio Co., Ltd., Gyeonggi-do, Korea) of the CON, SH1, and SH2 groups were also identical. In addition, the experimental groups’ diets included S. horneri powder (15 g kg−1 for SH1 and 30 g kg−1 for SH2).
After six weeks, the mice were euthanized by inhalation anesthesia using isoflurane (#1042, Hana Pharm Co., Ltd., Seongnam, Korea) following American Veterinary Medical Association (AVMA) guidelines29. Heparin tubes were used to collect blood samples, which were then centrifuged at 2,000 × g for 10 min at 4 °C. After centrifuging, the serum was then separated in order to evaluate its biochemical properties. After being gathered and cleansed with physiological saline, the organs were dried and weighed. They were stored at –80 °C for analysis after being quickly frozen with liquid nitrogen. The weights of fat came from different sources. For histological analysis, liver and epididymal tissues were preserved in 10% formalin (#50000, Sigma-Aldrich, St. Louis, MO, USA). Using a homogenizer, liver tissues were homogenized 1:9 in phosphate buffer (450 mM) at pH 7. Next, the mixture was centrifuged at 25,000 rpm for 20 min at 4 °C. The supernatant was gathered in order to assess the lipid and antioxidant activity. The Chonnam National University Animal Ethics Committee approved the experimental procedures employed in this study (CNU IACUC-YS-2020-9). This study is reported in compliance with the ARRIVE guidelines.
Analysis of serum biochemical indicators
Serum biochemical indicators were analyzed using an automatic blood analyzer (#06473245001, Cobas C702, Roche Diagnostics, Holliston, MA, USA). Using kit method by following the manufacturer guidelines of Sigma-Aldrich (St. Louis, MO, USA), aspartate aminotransferase (AST, #MAK055), alanine aminotransferase (ALT, #MAK052), blood urea nitrogen (BUN, #MAS008), and creatinine (#C4255) levels were analyzed. Moreover, protein was measured by the biuret reaction (#B3934), albumin was measured with a colorimetric method (#MAK124). These levels were used to assessment toxicities to liver and kidney23.
Serum lipids analysis
To determine the levels of TC (#EBCK109M), HDL-C (#EBCK222S), and TG (#EBCK261M) in serum, using the kit method of Elabscience Inc., (Houston, TX, USA). LDL-C content was computed using the formula TC – (HDL-C)—(TG/5). The formula for AI was (TC-HDL-C)/HDL-C. The formula for cardiac risk factor (CRF) was TC/HDL-C30. Elabscience Inc, Houston, TX, USA.
Antioxidant enzyme activities in liver
Using the kit of Abcam Inc., (Cambridge, MA, USA), the activities of glutathione peroxidase (GSH-Px, #ab102530), catalase (CAT, #ab83464), glutathione S-transferase (GST, #ab53942), superoxide dismutase (SOD, #ab65354), glutathione Reductase (GR, #ab83461), and glutathione (GSH, #ab239727) levels were measured31.
Western blot analysis
The levels of protein expression for iNOS, COX-2, NF-κB-p65, including Nrf2, and HO-1 were determined using Western blot analysis. To lyse the cells intact, a mixture of protease inhibitors (5 mg mL−1 pepstatin A, 5 mg mL−1 aprotinin, 1 mg mL−1 chymostatin, and 0.1 mM phenylmethylsulfonyl fluoride-PMSF) (#11206893001) was added to 20 mM of Tris–HCl buffer (#93313) at pH 7.4; the reagents were acquired from Sigma-Aldrich (St. Louis, MO, USA). For use in vivo studies, the liver tissues were homogenized in a buffer at 4 °C using a homogenizer (#Polytron CH-6010, Kinematica GmbH, Luzern, Switzerland). Once the homogenate was obtained, it was centrifuged (#MX-160, Tomy Seiko Co., Ltd., Tokyo, Japan) for 20 min at 4 °C at 12,000 rpm. Cell Signaling Technology (Danvers, MA, USA) provided the primary and secondary antibodies for Western blotting analysis. The primary antibodies SREBP-1 (#ab28481), FAS (#3180), ACC (# 3662), AMPK (#2532) and p-AMPK (#2535) protein expressions was performed on 100 μg of liver supernatant protein. The membranes were then incubated with secondary antibodies (IgG-HRP) of mouse (#7076S), and rabbit (#7074S)32. By adding protein test dye reagent (#5000006; Bio-Rad Laboratories, Hercules, CA, USA), we ascertained the protein content. After that, the protein expressions were examined using the Western blotting technique in accordance with a previously published protocol26. The quantitative analysis of Western blot band intensities was conducted using ImageJ (Image Processing and Analysis in Java) version 1.52 software (National Institutes of Health, Bethesda, MD, USA; https://imagej.net).
Real-time PCR (RT-PCR) for RNA isolation and quantification
Total RNA was extracted from liver tissue using the TRIzol RNA isolation reagent (#15596018, Invitrogen, Carlsbad, CA, USA). RNA reverse transcription was performed using the Prime Script™ 1st Strand cDNA Synthesis Kit (#2708891, Bio-Rad, CA, USA) in accordance with the manufacturer’s instructions. For quantitative RT-PCR, twenty microliters of Takara Bio Inc.’s SYBR® Premix Ex Taq were utilized. Adjusting for mRNA signals against glyceraldehyde-3-phosphate dehydrogenase (GAPDH), the findings were obtained. In this work, the primer sequences listed in Table 1 were employed33.
Histopathological analysis
For histopathological analysis, liver tissues were fixed with 10% formalin solution, washed with water, dehydrated, rendered transparent, and infiltrated. They were subsequently embedded with paraffin. After embedding, they were sectioned and stained with hematoxylin (#517282, Sigma-Aldrich, St. Louis, MO, USA) & eosin (#548243, Sigma-Aldrich, St. Louis, MO, USA) (H&E). The stained tissues were observed using a microscope (Olympus DP70, Olympus Optical Co., Tokyo, Japan) to determine liver tissue steatosis and inflammation levels in the experimental groups34.
Statistical analysis
GraphPad Prism (version 5.01; GraphPad Software, Inc., San Diego, CA, USA) was used for all statistical analyses. The findings were displayed as the average ± standard deviation (SD) of a minimum of three separate investigations. One-way analysis of variance (ANOVA) was used to analyze the data, and Tukey’s multiple test (p < 0.05) was used for comparison.