
Cell lines and culture conditions
Cell lines used were luciferase-expressing and GFP-expressing Nalm6 (M.S., Columbia University), Kelly, SK-N-AS and Sh-Sy5y (University Children’s Hospital Tübingen) and Daudi (kindly provided by D. Sonanini, University Hospital Tübingen). Cells were PCR-tested for Mycoplasma and found to be negative. SUP-T1 (S. Hailfinger, University Hospital Münster), Sh-Sy5y, Kelly and Daudi cells were cultured in RPMI-1640 (Gibco) with L-glutamine, 10% FBS and 1% penicillin–streptomycin. Nalm6 cells were additionally supplemented with 10 mM HEPES, 1× nonessential amino acids (NEAA), 1 mM sodium pyruvate and 50 μM β-mercaptoethanol (all Gibco). SK-N-AS were cultured in DMEM (Gibco) supplemented with L-glutamine, 10% FBS, 1% penicillin–streptomycin and 1× NEAA.
Isolation, activation and expansion of primary T cells
Fresh blood products from healthy deidentified volunteers were obtained from Zentrum für klinische Transfusionsmedizin, Tübingen. Samples from pretreated participants with cancer were isolated from 60–81-year-old individuals suffering from different cancer entities including sarcoma, lung cancer and breast cancer after several rounds of chemotherapy. Samples from pretreated participants with tumors were obtained from the Medical Department, University Hospital Tübingen. All blood samples were handled following the ethical and safety procedures approved by the ethic commission of the University of Tübingen (783/2023BO2, 846/2020BO2). Informed consent was obtained from the participants. All samples of human origin were destroyed after the analysis. Peripheral blood mononuclear cells were isolated from blood products and T cells were subsequently isolated using human Pan T cell isolation kit (Miltenyi Biotec, 130-096-5359). T cells were activated at a cell-to-bead-ratio of 1:1 with human T activator CD3/CD28 Dynabeads (Thermo Fisher, 11161D) in the presence of 5 ng ml−1 IL-7 and IL-15 (Miltenyi Biotec, 130-095-363 and 130-095-765). Cells were cultured at 1 × 10⁶ cells per ml in X-Vivo15 (Lonza, BEBP02-061Q), which was supplemented with 5% human AB-positive serum and 1% penicillin–streptomycin.
Base editor mRNA in vitro transcription (IVT)
pCMV-ABEmax (Addgene, 112094) and pCMV-AncBE4max (Addgenes, 112095) were used as templates. IVT was performed using the T7MEGAscript kit (Thermo Fisher, AMB13345). The plasmids were linearized through AgeI-HF, followed by IVT according to manufacturer’s instructions. Transcripts were capped with the CleanCapAG (Tebubio, N-7113) and subjected to poly(A) tailing (Thermo Fisher, AM1350) according to the manufacturer’s instructions. mRNA was purified through overnight LiCl precipitation and mRNA was stored at −150 °C.
Retroviral production and pooled base-editing screen in human primary CAR T cells
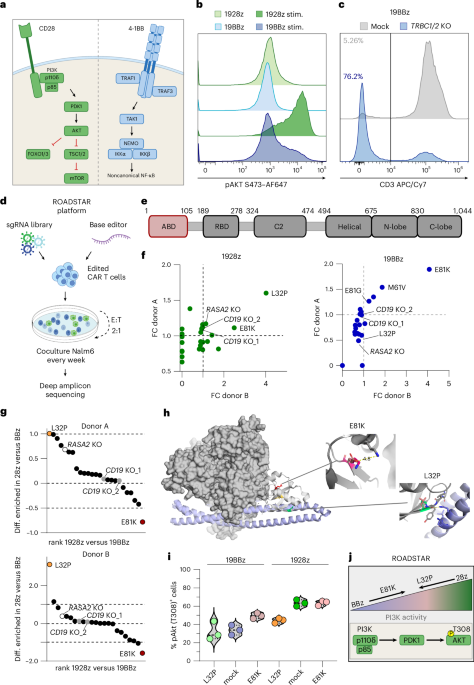
Base-editing sgRNAs (Supplementary Tables 9 and 10) were cloned into the previously described SFGγ retroviral 19BBz and 1928z CAR plasmids (M.S., Columbia University)17,39,56 under a hU6 promoter. CAR constructs coexpressed truncated LNGFR. Single-chain variable fragment sequences against CD22 (EP2912061B1), B7H3 (WO2017044699A1) and L1CAM (US20210085719A1) were cloned into the SFG-19BBz and SFG-1928z vectors using standard molecular biology techniques. Plasmids were used for retrovirus production as previously described17. H29 packaging cells were provided by M.S. (Columbia University) and 293Vec-RD114 packaging cells were provided by BioVec Pharma57. The PI3Kδ amino acid sequence was obtained from UniProt (O00329) and the respective nucleotide sequence was cloned into the SFG-19BBz or SFG-1928z vector, replacing truncated LNGFR. For ABD screening, T cells were transduced with the retroviral pools to express either 1928z or 19BBz CARs and the sgRNA library. Forty-eight hours after transduction, 2 × 10⁶ T cells were resuspended in P3 primary cell buffer (Lonza) and electroporated with 10 µg of the respective base editor mRNA using Lonza Nucleofector device (EC115 program). Edited CAR T cell pools were subjected to weekly Nalm6 stimulations (effector-to-target ratio (E:T) 2:1) for a total of three stimulations. Genomic DNA was purified using the DNeasy blood and tissue kit (Qiagen) from start-point and end-point samples and edited loci were amplified by PCR using NGS 5′ Illumina specific 30-bp partial adaptors. For PIK3CD, exons 1 and 2 spanning the screened p110δ ABD were amplified; for CD19 and RASA2, regions surrounding the respective sgRNA binding sites were targeted. Amplicons were sequenced by AmpliconEZ targeted amplicon deep sequencing (Azenta). Data analysis was carried out using the public Galaxy platform (https://usegalaxy.org/). Adaptor removal and quality trimming were performed using the TrimGalore application with a threshold Phred-score of 25 (https://github.com/FelixKrueger/TrimGalore). Reads were aligned to the reference sequences around the amplified loci using the BWA-MEM2 alignment algorithm58 and variants were called using the LoFreq variant caller application59. Mutations that were represented under 0.4% at the assay start point were excluded from further analysis. Mutational prevalence was normalized to the CAR T cell rate and analyzed as the fold change (FC) compared to start-point prevalence.
Haplotype analysis was performed by extracting reads harboring specific nucleotide substitutions corresponding to the amino acid changes L32P or E81K. Therefore, we implemented a custom filtering pipeline using pysam library (version 0.21.0; https://github.com/pysam-developers/pysam)60. Reads containing the respective codon-altering variants were isolated and subsequently reanalyzed to identify co-occurring mutations within the same sequencing reads.
Base editing in primary human CAR T cells with synthetic sgRNAs
T cells were isolated and stimulated as described above. Then, 48 h after, 3 × 10⁶ T cells were resuspended in 100 µl of buffer T and electroporated with 10 µg of mRNA and 5 µg of each synthetic sgRNA (Integrated DNA Technologies) resuspended in IDTE buffer (Integrated DNA Technologies, 11-05-01-05) at 1,400 V (three pulses, 10 ms) using the Neon electroporator device. Mock-edited T cells were electroporated with scrambled sgRNA (GCACTACCAGAGCTAACTCA); TRBC1/2 KO and E81K and L32P substitutions were induced by use of sgRNA sequences CCCACCAGCTCAGCTCCACG (AncBE4max), GCTCTTGCTGCTCCGCTGTC (AncBE4max) and AAGTTCAGGTAGACCCCTGT (ABEmax), respectively. Cells were rested in antibiotic-free X-Vivo15 supplemented with cytokines for 24 h and transduced with retroviral supernatant in RPMI-1640 (Gibco) with 10% FBS supplemented with cytokines by centrifugation on retronectin-coated (Takara, T110A) plates (300g, 1 h, 34 °C). CAR T cells with TRBC1/2 KO were enriched with human CD3 microbeads (Miltenyi Biotec, 130-097-043).
Base-editing efficiency was routinely assessed by Sanger sequencing followed by analysis with EditR61 default settings (https://moriaritylab.shinyapps.io/editr_v10/).
Substitutions co-occuring with L32P and E81K were analyzed using AmpliconEZ targeted amplicon deep sequencing (Azenta) as described above.
SUP-T1s were electroporated at 1,400 V (three pulses, 10 ms) using the Neon electroporator device, seeded in a single-cell suspension and sequenced for homozygous E81K substitution.
Single-cell DNA isolation
First, 7 days after transduction, unstimulated CAR T cells were single-cell-sorted on the basis of LNGFR expression using a MA900 multiapplication cell sorter (Sony). Single-cell DNA was isolated and amplified using REPLI-g single-cell kit according to the manufacturer’s instructions. Subsequently, amplified DNA was used for PIK3CD exon 1 PCR amplification followed by Sanger sequencing.
Antigen stimulation and proliferation assays
CAR T cells (LNGFR+) were weekly stimulated with target cells in RPMI-1640 + FBS without cytokines (E:T = 2:1, unless otherwise indicated).
Mouse systemic tumor model
NOD/SCID/Il2rγ-null male and female mice (6–9 weeks old; Charles River, strain code 614, NSG) were used for experiments. All mice were housed in pathogen-free conditions with a housing temperature of 22 ± 1 °C, 55 ± 5% humidity and a 12-h dark–light cycle. All ethical regulations and animal use guidelines were followed. Mouse protocols were approved by the Regierungspräsidium Tübingen and Institutional Animal Care and Use Committee of Zhejiang University (R02/22G, R03/22G, R05/23G and no. 20220178). A total of 0.5 × 10⁶ luciferase–GFP-expressing Nalm6 or Sh-Sy5y cells were administered by tail-vein injection followed by intravenous (i.v.) injection of 3 × 10⁶ 19BBz and 1 × 10⁶ (B7H3-BBz) or 0.5 × 10⁶ (B7H3-28z) CAR T cells 4 days later, respectively. Tumor rechallenge experiments were performed by repetitive i.v. injection of 1 × 10⁶ Nalm6 cells at the indicated time points. Tumor-bearing mice were killed according to signs of morbidity, based on approved scoring sheets involving evaluation of face grimace, posture, weight loss (>20%), respiration, activity, social behavior and grooming. Tumor-free mice that had to be killed for unknown reasons were excluded. For assessment of tumor burden, mice were intraperitoneally administered 150 mg kg−1 D-luciferin potassium salt (GoldBio, LUCK-1g) dissolved in sterile PBS for 10 min, followed by imaging under isoflurane anesthesia62. Bioluminescence imaging was performed on the IVIS Lumina III system (PerkinElmer) and signal intensity was quantified using Living Image analysis software (version 4.7.4; PerkinElmer) as total flux (photons per s) from consistent regions of interest. To reduce spillover during bioluminescence imaging, we imaged treatment groups together whenever possible.
Cytotoxicity assays
Ex vivo cytotoxicity was assessed through the generation of single-cell suspensions from spleen, followed by overnight incubation in RPMI-1640 + FBS. In vitro generated or ex vivo obtained CAR+ effectors were cocultured with the respective target cells in triplicate at the indicated E:T ratios in 96-well plates with 2 × 10⁴ target cells per well. Maximal luciferase expression was determined using only target cells; Triton X-100-treated cells were used to assess background levels. After 18 h of incubation, 100 μl of luciferase substrate (D-luciferin; Goldbio) was directly added to each well. Emission was detected and lysis was calculated as (1 − Emsample/Emmax) × 100.
3D migration cytotoxicity assay and time-lapse microscopy assay
Anti-L1CAM-BBz CAR T cells were used after twice-weekly stimulations with Sh-Sy5y (E:T = 2:1). H2B–mGFP-expressing Sh-Sy5y cells were subconfluently seeded in a black 96-well imaging plate and were overlaid with a 3D collagen gel (PureCol, concentration: 1.7 mg ml−1) containing the respective preactivated CAR T cells stained with CellTracker Red CMTPX dye (Thermo Fisher, C34552). After polymerization, T cell dynamics were recorded by time-lapse bright-field microscopy (frame rate = 55 s) for 42–45 h at 37 °C and 5% CO2. The 2 × 2 mosaic images were obtained with an epifluorescence microscope (LeicaMicrosystems, Thunder 3D Assay) with hardware-based auto focus control using a Leica ×20 (numerical aperture: 0.95) air objective and computationally merged using the Leica LasX software. Whole-well end-point images were acquired after 4 days using a Tecan SparkCyto. Images were split and segmented by StarDist (https://link.springer.com/chapter/10.1007/978-3-030-00934-2_30, https://ieeexplore.ieee.org/document/9093435); apoptotic cells were excluded and living cells were counted using FIJI. E:T cell interactions were quantified by automatic analysis based on vicinity. For speed quantification, T cells that could be followed for >30 min were included in the statistical analysis. Cells were segmented and tracked using TrackMate FIJI plug-in63 with Stardist segmentation and LAP Tracker tracking64. T cell analysis was performed using R Studio based on celltrackR65 and the work package (https://github.com/juliaquach02/cellcontacts) to detect E:T cell contacts. An interaction or contact was defined as three frames (155 s) and a maximum distance of 7 µm between T cell and tumor cell. Apoptotic events and T cell contacts until tumor cell apoptosis were quantified by manual analysis. Data were evaluated on the original image set.
Flow cytometric analysis
Cell-surface staining of single-cell suspensions was performed in fluorescence-activated cell sorting (FACS) buffer (PBS with 2% FBS and 2 mM EDTA) for 20 min at room temperature.
Mitochondrial mass was determined by incubation with 10 nM MitoTracker orange CMTMRos (Invitrogen) in culture medium for 30 min at 37 °C, followed by cell-surface staining.
For assessment of intracellular protein levels, effector and target cells were cocultured (E:T = 1:1, 4 h, 37 °C) in the presence of 3 µg ml−1 brefeldin A and 2 µM monensin (both Tonbobio), followed by viability and surface staining in PBS for 25 min. Cells were fixed with IC fixation buffer (eBioscience) for 20 min at room temperature. Intracellular staining was performed in 1× permeabilization buffer (eBioscience) for 30 min at 4 °C.
For glucose uptake experiments, cells were analyzed after final stimulation with Nalm6 cells (E:T = 2:1). Cells were washed and resuspended in glucose-free RPMI-1640 + FBS supplemented with 100 µg ml−1 2-NBD-glucose (Abcam, ab146200) to a cell concentration of 3 × 10⁶ cells per ml. Cells were incubated for 10 min at 37 °C, washed with ice-cold PBS and stained extracellularly.
For phosphoflow analysis, cells were seeded in cytokine-free RPMI-1640 for 2 h and subsequently stimulated with Nalm6 cells for at an (E:T = 1:1). After fixation with 100 µl of warm 4% paraformaldehyde for 15 min, cells were washed and permeabilized in 300 µl of 90% ice-cold methanol for 10 min at 4 °C and washed twice. Subsequently, cells were incubated with phosphoantibodies for 1 h at room temperature, washed and stained with secondary antibody for 30 min at room temperature.
For measurement of antigen surface levels, Quantum Simply Cellular antimouse IgG (Bangs Laboratories) was performed and calculated according to the manufacturer’s instructions.
For CAR T cell sorts, unstimulated CAR T cells were sorted on a MA900 multiapplication cell sorter (Sony, 100-µm chip). LNGFR+ CAR T cells were sorted for indicated CAR T cell subsets (naive, CD45RA+CD62L+; central memory, CD45RA−CD62L+; effector memory, CD45RA−CD62L−; effector, CD45RA+CD62L−).
Samples obtained from in vivo experiments were blocked using mouse FcR Blocking Reagent (Miltenyi Biotec, 130-092-575) in addition to the CAR and surface staining. Blood samples were collected in EDTA-coated microtainer and washed with cold FACS buffer. FACS lysis solution (BD, 349202) was added to lyse red blood cells. CountBright absolute counting beads (Invitrogen) were added to the samples before acquisition. The gating strategy for in vivo samples is exemplarily shown in Extended Data Fig. 10. In all experiments involving TRBC1/2 KO, the CAR+ cells for subsequent analysis were determined as the proportion of CD3− T cells.
Flow cytometry and western blot antibodies and reagents are reported as Supplementary Tables 11 and 12. All samples were acquired on a five-laser Cytek Aurora spectral cytometer with automated compensation calculation. Fluorescence − 1 controls were acquired for accurate gating. Data analysis was performed using FlowJo (version 10.8.0).
Western blot
For immunoblotting, SUP-T1 or T cells were seeded at 2 × 10⁶ cells per ml in fresh RPMI-1640 + FBS. Cells were either left untreated or incubated with Nalm6 cells (E:T = 2:1). Cells were washed with ice-cold PBS and spun down (300g, 5 min, 4 °C). Pellets were resuspended in supplemented RIPA buffer (protease inhibitor (Roche), NaF, Na4P2O7 and Na3VO4) and incubated for 15 min on ice with repetitive vigorous mixing. Protein concentration was measured using BioRad protein assay. Then, 40–60 µg of protein lysate was loaded onto 10% Tris–glycine SDS Gels followed by transfer to nitrocellulose membrane. Membranes were blocked in 5% BSA or milk in TBST; thereafter, primary antibodies were incubated at 4 °C overnight and secondary antibodies were incubated for 2 h at room temperature.
scRNA-seq library preparation and sequencing
First, 19BBz CAR T cells carrying either a TRBC1/2 stop mutation and/or the E81K base edit were stimulated twice with Nalm6 cells (E:T = 2:1). Then, 48 h after the last stimulation, living CAR T cells were single-cell-sorted (LNGFR+CD3−) and single-cell sequenced (CeGaT). Cell count and viability (>90%) were determined using a Cellaca MX cell counter (Revvity). The scRNA-seq library was prepared using Chromium NextGEM single-cell 3′ kit, version 3.1 (10x Genomics) according to the manufacturer’s instructions. Briefly, the cell suspension was loaded into a Chromium NextGEM ChipG aiming for a cell recovery of 10,000 cells per sample. For cDNA amplification, 11 PCR cycles were used and the final sample index PCR was performed with 12 cycles. Libraries were sequenced using a NovaSeq X Plus 1.5B flow cell (mean reads per cell: 19BBz TRBC, 113,977; 19BBz E81K, 121,606).
scRNA-seq analysis
Demultiplexing of the sequencing reads was performed with bcl2fastq (version 2.20). For each sample, FASTQ files generated with bcl2fastq were subsequently processed with the Cell Ranger software (version 7.1.0) provided by 10x Genomics.
Processing and analysis of scRNA-seq data were performed with Scanpy (version 1.11.1)66. Genes with <20 total counts and cells with >100,000 total or 10% mitochondrial gene counts, <2,000 distinct genes or 10% ribosomal gene counts were filtered out. The gene expression matrix was normalized to the median of total counts per cell, log-transformed and scaled per gene. The 2,000 most highly variable genes were determined with the ‘seurat_v3’ method on the basis of raw counts67. Scaled expression of these highly variable genes was used to compute a principal component analysis and a neighborhood graph with 30 nearest neighbors was constructed on the basis of 50 principal components using cosine similarity. Leiden clustering (resolution 1.0) was performed and uniform manifold approximation and projection (UMAP) embedding was computed with default parameters for visualization.
For cell type annotation, differentially expressed genes (DEGs) between Leiden clusters were determined using a Wilcoxon rank-sum test on log-normalized counts with the Scanpy function ‘rank_genes_groups’ (ref. 66). Overrepresentation analysis of differentially upregulated genes for each cluster (false-discovery-rate-corrected P value < 0.05, log2FC > 0.5) and GSEA68 based on differential expression scores were performed using GSEApy (version 1.1.8)69 with the Kyoto Encyclopedia of Genes and Genomes pathway, Gene Ontology biological process, MSigDB Hallmark, MSigDB C7 immunologic signature and additional exhaustion-related gene sets45 to aid with functional annotations. Clusters with similar marker gene expression profiles (Extended Data Fig. 7c) were aggregated into functional cell types. Gene module expression46 was scored using the Scanpy function ‘score_genes’ (ref. 66) on the basis of log-normalized counts.
Untargeted metabolomics and targeted metabolite analysis
First, 19BBz CAR T cells with a TRBC1/2 stop mutation and/or E81K substitution were twice stimulated with Nalm6 cells (E:T = 2:1). Then, 24 h after last stimulation, the absence of Nalm6 cells was controlled by flow analysis and 1 × 10⁻⁷ to 1.2 × 10⁻⁷ CAR T cells were thoroughly washed followed by quenching with 400 µl of ice-cold methanol (≥99.9%) and storage at −80 °C. Metabolite extraction was performed on ice using a two-phase extraction with methanol, methyl tert-butyl ether and H2O as previously described70. Liquid chromatography (LC)–mass spectrometry (MS) analysis was performed using a chromatography system coupled to a timsTOF Pro2 mass spectrometer (Bruker Daltonics) equipped with a vacuum-insulated pressure-heated electrospray ionization source (Bruker Daltonics). Hydrophilic interaction LC (HILIC) was performed using a BEH amide column (150 × 2.1 mm, 1.7 µm; Waters). To manually assess signal linearity, a pooled quality control sample was injected (0.25–5 µl). Mass and ion mobility were recalibrated using sodium formate and Agilent’s ESIS tuning solution per run. The MS analysis for nontargeted metabolomics was performed using parallel accumulation serial fragmentation mode with data-dependent MS/MS acquisition and trapped ion mobility spectrometry stepping, following the four-dimensional (4D) metabolomics standard method in TimsControl software (Bruker Daltonics). HILIC was run in both ionization modes; reverse phase LC was run in negative mode only.
Raw data were processed in MetaboScape 2025b using the T-ReX 4D algorithm and matched to commercial and in-house target lists and libraries (Bruker HMDB 2.0, METLIN-CCS, PNNL, IROA MSMLS). Metabolite identification followed Metabolomics Standards Initiative level 2 criteria (m/z deviation < 2.0 ppm, mSigma < 20, MS/MS score < 900 or collision cross-section deviation < 1%). Features had to be ≥3× blank, detected in ≥5 samples and have ≥1,500 ion counts and ≥125 4D points. Recursive extraction and quality-control-based batch correction were applied.
Data preprocessing and further statistical processing were performed using MetaboAnalyst 6.0. Missing values were imputed as one fifth of the minimum positive value, normalized by probabilistic quotient normalization, log10-transformed and merged across HILIC and RP modes. Redundant features were retained from the method with fewer missing values and higher intensity. Samples were run in five technical replicates unless stated otherwise. Hierarchical clustering was performed using Euclidean distance and the ward.D2 linkage method. Joint transcriptomics from overall scRNA analysis and metabolomic pathway analysis was conducted using the MetaboAnalyst 6.0. For this analysis, 222 upregulated genes (adjusted P value < 0.05, FC > 1) and 27 upregulated metabolites (P value < 0.05 in at least one donor) were included. Pathway enrichment was assessed using hypergeometric testing and pathway topology was evaluated on the basis of betweenness centrality.
Absolute NADH levels of CAR T cells were measured 24 h after second antigen stimulation using a NAD+/NADH assay kit (Sigma-Aldrich, MAK460) according to the manufacturer’s instructions.
Seahorse analysis
Metabolic profiling was measured using a flux analyzer (Seahorse XF Pro, Agilent) according to the manufacturer’s instructions. A total of 2 × 10⁵ T cells per well were seeded in 5–8 replicates in 180 µl of Seahorse XF RPMI medium (Agilent) containing 2 mM L-glutamine, 1 mM sodium pyruvate and 10 mM D-glucose in poly(D-lysine)-coated 96-well microplates. After 30 min of incubation at 37 °C, mitochondrial respiration analysis was performed using the Seahorse XF cell mito stress test kit (Agilent, 103015-100) according to the manufacturer’s recommendation. Basal oxygen consumption was calculated from the difference in oxygen consumption rate (OCR) before oligomycin treatment and after rotenone + antimycin A treatment. Maximal oxygen consumption was calculated from the difference of the OCR after rotenone + antimycin A treatment and after FCCP treatment. Basal and maximal extracellular acidification rate (ECAR) was defined as the ECAR measured before and after oligomycin addition. Spare respiratory capacity and spare ECAR were defined as the difference between maximal and basal oxygen consumption and ECAR, respectively.
Multiplex immunoassay and cytokine secretion analysis
For cytokine quantification, the LEGENDplex human essential immune response panel (BioLegend) was performed according to the manufacturer′s instructions. Data analysis was performed according to manufacturer’s instructions using the LEGENDplex data analysis software. In brief, serum samples from mice were collected on day 16 and used both undiluted and in a 1:100 dilution for the assay. For in vitro experiments, CAR T cells and target cells were cocultured (24 h, E:T = 1:1). All measurements were performed in duplicates.
RNA extraction and bulk RNA-seq analysis
CAR T cells were harvested either unstimulated or after twice-weekly stimulations with Nalm6. Then, 4 days after the last stimulation, no Nalm6 cells were detectable in the culture as determined by flow cytometry. All cells were washed twice with ice-cold PBS and RNA was directly extracted using the RNeasy mini kit with RNase-Free DNase set (Qiagen) according to the manufacturer’s instructions.
Transcriptomic data analysis of bulk RNA-seq
Quality control, read mapping and counting were performed using the Nextflow-based nf-core/rnaseq (version 3.12.0) pipeline (https://nf-co.re/rnaseq). Quality control assessment of the raw data was performed using FastQC (version 0.11.9) and RSeQC (version 3.0.1). Reads were mapped to the reference genome (GRCh38) using the STAR aligner (version 2.6.1d)71. Quantification of raw gene expression was performed with Salmon (version 1.10.1)72 and downstream analysis was performed with the Nextflow-based rnadeseq (version 2.2.0) pipeline (https://github.com/qbic-pipelines/rnadeseq). This workflow integrates DESeq2 (version 1.40.2)73 for differential expression analysis used in the R language (version 4.3.1). Genes with an adjusted P value ≤ 0.05 were considered differentially expressed. The DEG lists were obtained from simple pairwise comparisons extracted from a linear model. The DEG lists, together with their associated log2FC were fed into gprofiler2 for pathway enrichment analysis. The gene selection for the comparative analysis between 19BBz CAR T cells with and without the E81K substitution in Extended Data Fig. 6h was based on the FOXO3-dependent gene set reported by Litvak et al.41 (Fig. 1a). Specifically, the top 30 genes upregulated in FOXO3-KO versus WT conditions and expressed across both human and murine species were selected for further analysis. For the GSEA, fgsea (version 1.28.0)71 was used to run the analysis on the output of DESeq2. The reference gene list used included two custom gene sets and MSigDB (version 7.2) Hallmark gene sets.
Histological analysis
All tissues were fixed in 4% buffered formalin and embedded in paraffin. For histology 3–5 µm-thick sections were cut and stained with hematoxylin and eosin. The histologic samples were analyzed by an experienced pathologist (L.Q.-M.). All samples were scanned with the Ventana DP200 (Roche) and processed with the Image Viewer MFC Application. Final image preparation was performed with Adobe Photoshop 2024.
Statistical analysis
Any additional statistical analyses not detailed above were conducted using Prism 7 (GraphPad). Mouse condition and survival were observed by an operator who was blinded to treatment groups in addition to the main investigator who was not blind to group allocation. Tumor burden was measured by a blinded operator; analysis of data was not performed in blinded fashion. No data were excluded throughout the studies. No blinding was performed for in vitro experiments. No statistical sample size was predetermined. Mice were randomly allocated to the respective groups after ensuring similar tumor burden. Comparisons between two groups were conducted using two-sided Student’s t-tests. When normality could not be assumed (Shapiro–Wilk test), the Wilcoxon matched-pairs signed-rank test was applied for paired data. For values normalized to their respective control, two-sided one-sample t-tests were used if the data were normally distributed; otherwise, a two-sided one-sample Wilcoxon test was applied. For comparing multiple groups, we applied one-way analysis of variance. For in vivo experiments, overall survival was analyzed using Kaplan–Meier curves and survival differences between groups were assessed with the log-rank (Mantel–Cox) test. P values < 0.05 were considered statistically significant. Specific statistical tests used are detailed in the corresponding figure legends. Scientific illustrations were generated by J. Zenker with BioRender.com drafts.
Reporting summary
Further information on research design is available in the Nature Portfolio Reporting Summary linked to this article.