
Pal promotes M2-like macrophage polarization and upregulates Arg1 expression
We initially investigated the potential of the CDK4/6 inhibitor Pal to modulate the TIME of HR + /HER2− breast cancer. To further explore its impact on the TIME in vivo, we performed scRNA-seq on breast tumors from mice. Twenty female BALB/c mice were orthotopically implanted with 67NR mouse breast cancer cells that were ER-positive [35, 36] (Fig. 1A and Supplementary Fig. S1A). We assessed the expression of ER α (ERα) in 67NR cells and found that 67NR cells express ERα at a lower level than the ER-positive control MCF7, but markedly higher than the ER-negative cell lines MDA-MB-231, 4T1, and EMT6 (Supplementary Fig. S1B). The data regarding tumor volume and mass indicated that Pal suppressed tumor growth in the mice (Fig. 1B, C). Initially, the cells were categorized as epithelial, fibroblast, endothelial, myeloid, or lymphoid cells (Fig. 1D–E, Supplementary Fig. S2). Lymphoid cells were divided into CD4 + T cells (CD4T), CD8 + T cells (CD8T), Tregs, natural killer (NK) cells, and B lymphocytes (B), no significant differences were observed between the Veh and Pal groups (Fig. 1F, Supplementary Fig. S3). The myeloid cells were further divided into neutrophils, macrophages, dendritic cells (DCs), and monocytes; no significant differences were observed between the Veh and Pal groups (Fig. 1G, Supplementary Fig. S4). We performed flow cytometric analysis of murine tumor tissues and found that the numbers of CD4⁺ and CD8⁺ T cells within the TIME showed no marked changes following Pal treatment (Supplementary Fig. S1C). This finding contrasts with existing studies reporting that CDK4/6 inhibitors can increase the numbers of CD4 + T cells and CD8 + T cells in the blood [15, 16]. The observed effect may be attributed to the immunosuppressive actions of CDK4/6 inhibitors within the TIME.

A ER + 67NR breast cancer cells derived from BALB/c mice were orthotopically implanted into 20 female BALB/c mice. B Pal reduced the tumor volume in the mice (Veh: n = 10; Pal: n = 10). C Pal reduced the tumor weight in the mice (Veh: n = 10; Pal: n = 10). D, E Cell clustering annotation of mouse tumor tissues. F Pal did not affect the number of lymphoid cells. G Pal did not affect the number of myeloid cells. H Macrophage UMAP plot. I Macrophage AUCell analysis of M2-like cells (n = 10621). J GSEA of the NOS2, TGFB, and MACROPHAGE_M1_VS_M2 gene sets revealed that the macrophages in Clusters 3, 4, and 7 were similar to M2-like macrophages. K–M UMAP, AUCell and cell count analyses revealed the polarization of macrophages toward M2-like macrophages after Pal treatment (n = 10621). N Pal promoted the expression of Arg1 in macrophages. O Pal increased the number of ARG1+ macrophages. Pal decreased the number of M1-like macrophages (PANCK − /CD68 + /CD86 + ) and increased the number of M2-like macrophages (PANCK − /CD68 + /CD86 − /CD206 + ) (Pre: n = 3; Post: n = 3). P No significant differences in the numbers of CD4T (PANCK − /CD4 + /CD8 − /FOXP3-), CD8T (PANCK − /CD4 − /CD8 + /FOXP3 − ), or Tregs (PANCK − /CD4 + /CD8 − /FOXP3 + ) were observed (Pre: n = 3; Post: n = 3). mIHC: multiplex immunohistochemistry. Veh: vehicle, Pal: palbociclib. The data are shown as the means ± SEMs. *P < 0.05, ***P < 0.001, ns: not significant, Wilcoxon rank sum test, Kruskal–Wallis test, two-way repeated-measures ANOVA and t test.
The macrophage UMAP plot revealed that the macrophages consisted of Clusters 3, 4, 7, 8, and 12 (Fig. 1H). According to the AUCell score analysis, the cells with higher scores (represented in red) resembled M2-like macrophages, whereas the cells with lower scores (represented in blue) resembled M1-like macrophages (Fig. 1I, Supplementary Fig. S5A). GSEA of the NOS2, TGFB, and MACROPHAGE_M1_VS_M2 gene sets revealed that the macrophages in Clusters 3, 4, and 7 were similar to M2-like macrophages (Fig. 1J), and CXCR4 and PDGF were also enriched in M2-like macrophages (Supplementary Fig. S6A, B). UMAP, AUCell and cell count analyses revealed the polarization of macrophages toward M2-like phenotypes after Pal interference (Fig. 1K–M, Supplementary Fig. S5B). Cell cycle analysis and GSEA revealed that Pal induced cell cycle arrest in M1-like macrophages (Supplementary Figure S6C–H). Since Pal treatment markedly affected macrophage populations within the TIME, we further analyzed the expression of key macrophage functional genes, including ARG1, NOS2, CCL, IL10, TGFB, CD163, and CD206. Arg1 expression in macrophages was upregulated at the transcriptomic level (Fig. 1N).
To validate the findings from the animal experiments, we performed mIHC staining in triplicate on FFPE samples. Samples from HR + /HER2− breast cancer patients receiving neoadjuvant therapy, including Pal, were subjected to mIHC staining (Supplementary Fig. S7A). mIHC revealed that post-Pal neoadjuvant therapy led to an increase in the number of ARG1+ macrophages, an increase in the number of M2-like macrophages (PANCK − /CD68 + /CD86 − /CD206 + ), and a reduction in the number of M1-like macrophages (PANCK − /CD68 + /CD86 + ) (Fig. 1O, Supplementary Fig. S7D, E). There were no significant changes in the numbers of CD4-positive T cells (CD4T) (PANCK − /CD4 + /CD8 − /FOXP3 − ), CD8-positive T cells (CD8T) (PANCK − /CD4 − /CD8 + /FOXP3 − ), or regulatory T cells (Tregs) (PANCK − /CD4 + /CD8 − /FOXP3 + ) (Fig. 1P, Supplementary Fig. S7F, G). These findings were further confirmed by flow cytometry analysis of human tumor tissues (Supplementary Fig. S8). Therefore, we hypothesize that the CDK4/6 inhibitor Pal may inhibit lymphocytes in the TIME by promoting macrophage polarization toward an M2-like phenotype.
Pal attenuates lymphocyte communication within the TIME and reduces Ki-67 expression in T and NK cells
Based on a preliminary analysis of immune cell numbers in the TIME of mice, we decided to further analyze immune cell function using scRNA-seq data. Transcriptomic analysis using GO and KEGG methodologies revealed significant enrichment of chemokine-associated signaling pathways (marked by green indicators) in tumor tissue samples (Fig. 2A, Supplementary Fig. S9). Transcriptome analysis of tumor tissues revealed that Pal intervention promoted the expression of various chemokines (Ccl3, Ccl4, Ccl6, and Ccl8) (Fig. 2B, C). These ligands are primarily secreted by myeloid cells within the tumor, including Ccl3, Ccl4, Ccl6, and Ccl8 (Supplementary Fig. S10A). The detection of mouse tumors and blood indicated that the expression of Ccl3, Ccl4, Ccl6, and Ccl8 increased after Pal interference (Fig. 2D, E). Studies have shown that Ccl3, Ccl4, Ccl6, and Ccl8 can promote the chemotaxis of lymphocytes [37]. Therefore, Pal should increase lymphocyte accumulation within the tumor. However, we employed CellPhoneDB to analyze the probability of communication (the likelihood of observing receptor‒ligand interactions between two cell types) and the strength of communication (influenced by the expression levels of receptors and ligands, reflecting the intensity or impact of signal transmission once communication occurs). The probability of communication between chemokines and lymphoid cells did not increase significantly (Fig. 2F–G). The strength of most communication related to lymphoid activation decreased (Fig. 2H, Supplementary Fig. S10B). The probability of communication related to lymphoid activation (MHC-II, CD80, FASLG and CD86) decreased (Supplementary Figs. S11–14), and the changes in the communication probability for MHC-I and ICOS were not significant (Supplementary Figs. S15–16). Transcriptome analysis revealed that the expression of Cd28 in CD4 + T cells and that of Klrb1c in NK cells was downregulated (Supplementary Fig. S10C, D). Transcriptome analysis revealed that the expression of Mki67 was decreased in T and NK cells (Fig. 2I–J). The expression of Ki-67 in T and NK cells was reduced, as demonstrated by mIHC in mouse and human tumors (Fig. 2K–L), and this finding was validated by flow cytometry (Supplementary Fig. S17). Thus, we considered the possibility that Pal promotes macrophage polarization toward the M2-like phenotype and Arg1 expression, affecting lymphocytes and thereby creating an immunosuppressive TIME.

A GO and KEGG enrichment analyses of the mouse tumor tissue transcriptome revealed multiple pathways related to chemokines (indicated by green dots). B, C Pal induces the secretion of Ccl3, Ccl4, Ccl6, and Ccl8 in mouse tumors (n = 9879). D ELISA detection of Ccl in mouse tumor tissues. E ELISA detection of Ccl in the peripheral blood of the mice. F, G The probability of communication between chemokines and lymphoid cells did not increase significantly. H The strength of most communication related to lymphoid activation decreased. I Transcriptome analysis revealed that the expression of Mki67 is decreased in T cells. J Transcriptome analysis revealed that the expression of Mki67 is decreased in NK cells. K The expression of Ki-67 in T and NK cells was reduced, as demonstrated by the mIHC assay (Veh: n = 3; Pal: n = 3). L The expression of Ki-67 was decreased in CD3-positive T cells (CD3T) (PANCK − /CD3 + /CD56 − ) and NK cells (PANCK − /CD3 − /CD56 + ) (Pre: n = 3; Post: n = 3). mIHC: multiplex immunohistochemistry. Veh: vehicle, Pal: palbociclib, TIME: tumor immune microenvironment. The data are shown as the means ± SEMs. *P < 0.05, **P < 0.01, ***P < 0.001, Wilcoxon rank sum test and Welch’s t test.
Pex inhibits macrophage infiltration and promotes lymphocyte infiltration within tumors
On the basis of previous experimental results, we administered targeted immunotherapy drugs for macrophages, the CSF1R inhibitor Pex and the CCR2 inhibitor INCB3344 (INC), to mice. Pex primarily inhibits the proliferation and survival of macrophages through CSF1R, whereas CCR2 inhibitors mainly inhibit the migration of macrophages. The mouse tumors were divided into four groups—Veh, Pal, Pex, and Pal combined with Pex (Pal+Pex)—and treated accordingly. Experiments with 67NR mouse tumors revealed that the effects of Pex and INC monotherapy were not significantly different from those of Veh. A significant difference was not observed between the combination of Pal and INC or Pal alone. The tumoricidal efficacy of Pal+Pex surpassed that of Pal monotherapy (Fig. 3A, B). Compared with that in the first week (days 12–18), tumor growth accelerated in the second week (days 18–24) in both the Pal and Pal+INC groups, whereas Pex inhibited accelerated tumor growth in the Pal group (Fig. 3C). Experiments using the mouse 4T1 tumor model and genetically engineered Stat − /− C57BL/6 mice yielded similar results (Supplementary Figs. S18 and S1A). These results suggest that Pal may induce immune tolerance within the tumor, whereas Pex counteracts this mechanism, increasing antitumor efficacy.

A, B Pex enhanced the killing effect of Pal on mouse tumors, whereas INC did not enhance the tumor-killing effect of Pal (Veh, Pal, Pex and Pal+Pex: n = 10; INC and Pal+INC: n = 5). C The tumor growth rate ratio of mouse tumors (Veh, Pal, Pex and Pal+Pex: n = 10; INC and Pal+INC: n = 10). D Pex intervention reduced the number of myeloid cells (n = 14). E Pex intervention increased the number of lymphoid cells (n = 14). F Pex decreased the number of macrophages (F4/80 + ) within the tumor according to mIHC (Veh: n = 3; Pal: n = 3; Pal+Pex: n = 3). G Pex decreased the number of Arg1+ macrophages (F4/80 + /Arg1 + ) within the tumor according to mIHC (Veh: n = 3; Pal: n = 3; Pal+Pex: n = 3). H Pex increased the number of CD4 + T cells (Cd4 + /Cd8 − /Foxp3-) and CD8 + T cells (Cd4 − /Cd8 + /Foxp3 − ) within the tumor according to mIHC (Veh: n = 3; Pal: n = 3; Pal+Pex: n = 3). I Pex increased the number of NK cells (CD3 − /Dx5 + ) within the tumor according to mIHC (Veh: n = 3; Pal: n = 3; Pal+Pex: n = 3). Veh: vehicle, Pal: palbociclib, Pal+Pex: palbociclib+pexidartinib. The data are shown as the means ± SEMs. *P < 0.05, **P < 0.01, ns: not significant, one-way ANOVA, Kruskal–Wallis test, two-way repeated-measures ANOVA and Welch’s one-way ANOVA.
Subsequent scRNA-seq of mouse tumors across all groups, which were analyzed on the basis of the cell classification annotations in Fig. 1 (Supplementary Fig. S19A–C), revealed that Pex intervention reduced the infiltration of macrophages, DCs, and monocytes in the TIME but had no significant effect on neutrophils (Fig. 3D and Supplementary Fig. S19D). Pex intervention increased the numbers of CD4 + T cells, Tregs, NK cells, and B cells in the tumors (Fig. 3E and Supplementary Fig. S19E). Mouse tumor tissues were subjected to mIHC staining. Compared with those in the Veh group, a decrease in the number of M1-like macrophages (F4/80 + /Cd86 + /Cd163 − ) and an increase in the numbers of M2-like macrophages (F4/80 + /Cd86 − /Cd163 + ) and Arg+ macrophages (F4/80 + /Arg1 + ) were detected in the Pal group, whereas the Pal+Pex group showed a decrease in macrophage numbers (Fig. 3F–G). Compared with those in the Veh group, the numbers of CD4 + T cells (Cd4 + /Cd8 − /Foxp3-), Tregs (Cd4 + /Cd8 − /Foxp3 + ), CD8 + T cells (Cd4 − /Cd8 + /Foxp3 − ), and NK cells (CD3 − /Dx5 + ) did not change significantly in the Pal group, but increases in the numbers of CD4 + T cells, CD8 + T cells and NK cells were observed in the Pal+Pex group (Fig. 3H–I), which was further confirmed by flow cytometry analysis of mouse tumor tissues (Supplementary Fig. S20). The consistency between protein data from mIHC staining of mouse tumor FFPE samples and transcriptomic data from scRNA-seq of mouse tumors, along with their similarity to mIHC results from breast cancer patients, suggests a strong correlation. Additionally, Pex intervention resulted in a decrease in macrophages and an increase in lymphocytes within the TIME, indicating that Pex enhanced the therapeutic effects of Pal. Next, we investigated the underlying mechanisms involved.
Pex reduces Arg1 expression and is associated with attenuation of CD8+ T cell exhaustion and Treg-mediated immunosuppression
Transcriptome analysis of tumor tissues revealed that Pex intervention inhibited the tumor expression of Arg1, Ccl3, Ccl4, Ccl6, and Ccl8, which were upregulated by Pal, in tumors (Fig. 4A). elisas of mouse tumor tissues revealed that Pex reduced the expression of Ccl3, Ccl4, Ccl6, and Ccl8 in tumor tissues (Fig. 4B). The results of the cell communication analysis indicated that Pex weakened the probability of a chemotactic effect of tumors on lymphocytes (Fig. 4C). Arg1 in tumor tissues is expressed primarily by macrophages, and transcriptome analysis of macrophages revealed that Pal and Pex upregulated and downregulated the expression of Arg1, respectively, in macrophages (Supplementary Fig. S21). Western blot analysis of mouse tumor tissues revealed that Pal tended to upregulate the expression of the Arg1 protein within tumors, whereas Pex inhibited the expression of the Arg1 protein (Fig. 4D). This effect is twofold: the CSF1R inhibitor Pex suppresses ARG1 expression in macrophages and reduces the number of macrophages. Pal treatment reduced arginine levels, whereas Pex increased the arginine content within the tumor (Fig. 4E). This difference was relatively modest, likely due to the continual replenishment of arginine consumed within the tumor microenvironment [38]. Pex increased the degree of communication strength between signaling pathways related to the activation of lymphocytes within the TIME (Fig. 4F). The probability of communication related to lymphoid activation (MHC-I, MHC-II, CD80, CD86 and ICOS) decreased (Supplementary Figs. S22–26), and the change in the communication probability for FASLG was not significant (Supplementary Fig. S27). As a critical amino acid for lymphocyte function, arginine plays an essential role in sustaining T-cell activity. In our study, Pal treatment reduced arginine levels, potentially impairing lymphocyte viability and function. In contrast, Pex treatment restored arginine levels within the TIME. We screened a broad set of CD8⁺ T cell functional genes to comprehensively assess their activation, cytotoxicity, and exhaustion status. Among these, exhaustion-associated markers including Pdcd1, Tigit, Lag3, and Havcr2 (TIM-3) showed the most significant changes and were therefore highlighted (Fig. 4G–H), which was further confirmed by flow cytometry analysis of mouse tumor tissues (Supplementary Fig. S28A). These findings suggest that Pex may alleviate CD8⁺ T-cell exhaustion by reversing key molecular features associated with the exhausted phenotype.

A Pex inhibited the expression of Arg1, Ccl3, Ccl4, Ccl6, and Ccl8 within the tumor. B Pex reduces the secretion of Ccl3, Ccl4, Ccl6, and Ccl8 by mouse tumors (Pal: n = 10; Pal+Pex: n = 10). C Pex weakened the probability of a chemotactic effect of tumors on lymphocytes. D WB analyses of mouse tumors revealed that Pal tended to upregulate the expression of the Arg1 protein within tumors, whereas Pal+Pex downregulated Arg1 expression in mouse tumors. E Pal treatment reduced arginine levels, whereas Pex increased the arginine content within the tumor (Veh: n = 12; Pal: n = 9; Pex: n = 6; Pal+Pex: n = 3). F Pex increased the strength of signaling pathway communication related to lymphocyte activation. G RNA-seq analysis revealed that Pex reduced the expression of Pdcd1, Tigit, Lag3 and Havcr2 in CD8T (n = 18156). H mIHC staining revealed that Pex reduced Pdcd1 and Havcr2 expression on CD8T cells in mouse tumors (Pal: n = 3; Pal+Pex: n = 3). I Pex reduced the expression of the Il2ra, Foxp3, Icos, Ctla4, and Tnfrsf18 genes in Tregs. J, K Pex intervention weakened the communication of signaling pathways related to the activity of Tregs within the tumor microenvironment. L mIHC staining showed that Pex reduced Ctla4 and CD25 (Il2ra) expression on Tregs in mouse tumors (Pal: n = 3; Pal+Pex: n = 3). Veh: vehicle, Pal palbociclib, Pex pexidartinib, Pal+Pex palbociclib + pexidartinib. The data are shown as the means ± SEMs. **P < 0.01, ***P < 0.001, the Kruskal‒Wallis test and Wilcoxon rank sum test.
Pex intervention reduced the expression of the Il2ra, Foxp3, Icos, Ctla4, and Tnfrsf18 genes in Tregs (Fig. 4I). Cell communication analysis revealed that Pex intervention weakened the activation of signaling pathways related to the activity of Tregs within the TIME (Fig. 4J–K). mIHC revealed that Pex reduced Ctla4 and CD25 (Il2ra) expression on Tregs in mouse tumors (Fig. 4L). This finding was further validated by flow cytometry (Supplementary Fig. S28B). These findings suggest that the CSF1R inhibitor Pex suppresses Tregs. On the basis of the aforementioned hypothesis regarding Pal, Pex appears to remodel the antitumor TIME by restoring lymphocyte viability, potentially through targeting macrophages and reducing both their infiltration and Arg1 expression. Further studies are warranted to elucidate the mechanisms underlying this effect.
Pal promotes fibroblast senescence and induces the secretion of IGF1 and FGF7
Pal alone did not directly modulate the polarization of PMA-induced THP-1-derived macrophages (Fig. 5A). Intercellular communication within the TIME was analyzed to explore the mechanism by which Pal promotes the polarization of tumor macrophages toward the M2-like phenotype and the overexpression of Arg1. In mouse tumors, the IGF and FGF signaling pathways both presented a certain degree of increase among the top 30 conserved signaling pathways (Fig. 5B). Cell communication targeting macrophages increased the extent to which the IGF signaling cascade was activated by macrophages (Fig. 5C). GSEA indicated that M2-like macrophages received more IGF1 signaling (Fig. 5D). Cell communication analysis indicated that intercellular communication involving IGF and FGF within the TIME is primarily mediated by fibroblasts (Supplementary Fig. S29A), and the probability of IGF and FGF communication between fibroblasts and M2-like macrophages increased, whereas the probability of communication between fibroblasts and M1-like macrophages decreased (Fig. 5E, Supplementary Fig. S29B). These findings suggest that Pal may influence macrophage polarization and Arg1 expression through the IGF and FGF pathways between fibroblasts and macrophages within the tumor, thereby affecting lymphocytes in the TIME.

A Pal alone did not directly modulate the polarization of PMA-induced THP-1-derived macrophages. B In mouse tumors, the IGF and FGF signaling pathways both presented a certain degree of increase among the top 30 conserved signaling pathways. C Ranking of cell communication received by macrophages revealed that Pal increased the strength of the ability of IGF to communicate with macrophages. D GSEA revealed that M2-like macrophages were enriched in the IGF1 pathway. E The probability of IGF and FGF communication between fibroblasts and M2-like macrophages was increased, whereas that between fibroblasts and M1-like macrophages was decreased. F Pal upregulated the expression of Igf1, Fgf7, Cdkn1a, Cdkn2a and Glb1, while downregulating Mki67 in mouse tumors (n = 4335). G ELISAanalysis revealed increased levels of IGF1 and FGF7 in fibroblasts from mouse tumor tissues. H Transcriptome analysis of the cell cycle revealed that Pal arrested fibroblasts in the G1 phase. I mIHC staining of mouse tumor tissues revealed that Pal suppressed Ki-67 expression in fibroblasts (a-SMA+Fap + ) and upregulated the senescence marker p16 (Veh: n = 3; Pal: n = 3). J mIHC analysis of HR⁺/HER2⁻ breast cancer tissues from patients treated with Pal also revealed reduced Ki-67 expression and increased P16 levels (Pre: n = 3; Post: n = 3). K ELISA results indicating that treatment of human primary mammary fibroblasts with Pal for four days upregulated the expression of IGF1 and FGF7. L Cell cycle analysis confirmed that Pal blocked the cell cycle of HMFs in the G1 phase. M β-Galactosidase assays indicated that Pal intervention caused senescence in human primary fibroblasts after four days (n = 3). Veh: vehicle, Pal: palbociclib. The data are shown as the means ± SEMs. *P < 0.05, **P < 0.01, ***P < 0.001, ns: not significant, t test, Welch’s one-way ANOVA and one-way ANOVA.
Studies have shown that CDK4/6 inhibitors induce fibroblast senescence by disrupting the cell cycle of tissue fibroblasts [11], leading to the expression of SASP factors, which include IGF1 and FGF7. In our study, we screened fibroblast genes related to cell-cycle regulation, senescence, and key functional activities, and found that Pal promoted the expression of Igf1 and Fgf7 in fibroblasts (Fig. 5F). Additionally, Pal upregulated the expression of Cdkn1a, Cdkn2a, and Glb1, indicating that the fibroblast cycle was inhibited and that senescence was induced (Fig. 5F). ELISA revealed increased levels of IGF1 and FGF7 in fibroblasts from mouse tumor tissues (Fig. 5G). The analysis of the scRNA-seq data revealed that Pal blocked the cell cycle of fibroblasts in the G1 phase within mouse tumor tissues (Fig. 5H). mIHC of mouse tumor tissues revealed that Pal suppressed Ki-67 expression in fibroblasts (a-SMA + /Fap + ) and upregulated the senescence marker p16 (Fig. 5I). Consistently, mIHC analysis of fibroblasts isolated from HR + /HER2− breast cancer tissues of patients treated with Pal further showed decreased Ki-67 expression and elevated P16 levels, indicating the induction of fibroblast senescence. Notably, IGF1 expression in fibroblasts was also elevated following Pal treatment (Fig. 5J). This finding was validated by flow cytometry (Supplementary Fig. S30).
On the basis of the plasma concentration, the Pal concentration for human primary mammary fibroblasts (HMFs) was set at 0.4 μM [39]. After treating HMFs with Pal for four days in vitro, an increase in the protein expression of IGF1 and FGF7 in fibroblasts was detected via ELISA (Fig. 5K). Cell cycle analysis revealed that Pal blocked the cell cycle of HMFs in the G1 phase (Fig. 5L). Pal intervention induced senescence in HMFs after four days, as evidenced by β-Galactosidase assays (Fig. 5M, Supplementary Fig. S31).
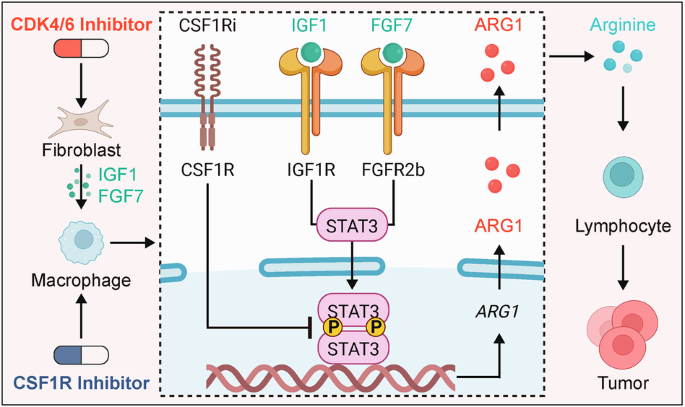
Pal promotes fibroblast secretion of IGF1 and FGF7 to activate macrophage Stat3 (Tyr705) phosphorylation leading to ARG1 expression and lymphocyte suppression
Next, we investigated whether IGF1 and FGF7 expressed by fibroblasts affect the expression of ARG1 in macrophages. We cocultured HMFs, human peripheral blood primary macrophages (HPBMs), and human peripheral blood primary lymphocytes (HPBLs) in vitro. Cells were cultured in serum-free RPMI 1640 medium for four days. WB revealed that IGF1 and FGF7 upregulated ARG1 expression in HPBMs (Fig. 6A). Knockdown of IGF1 and FGF7 at the RNA and protein levels reduced the expression of IGF1 and FGF7 in HMFs (Supplementary Fig. S32A). Knockdown of IGF1 and FGF7 in HMFs, as well as treatment with Pex, inhibited ARG1 protein expression in HPBMs (Fig. 6B). Pex did not affect the expression of IGF1 or FGF7 in HMFs (Fig. 6C). Pal did not increase ARG1 expression in HPBMs (Fig. 6D). After the addition of 0.4 μM Pal to the coculture in RPMI 1640 medium without L-arginine and serum and the addition of 3 mM L-arginine followed by culture for four days, the WB results revealed that ARG1 protein expression was upregulated in the HPBMs from the Pal group, whereas siIGF1, siFGF7, and Pex inhibited the expression of ARG1 protein in the HPBM group. Elizas of the arginine content in the coculture medium revealed the lowest arginine content in the b2 group and the highest content in the b5 group (Fig. 6E). After HPBLs were cocultured in RPMI 1640 medium lacking L-arginine and serum, 3 mM L-arginine was added and the cells were cultured for an additional four days. CCK-8 assays revealed that arginine supplementation restored the viability of HPBLs (Fig. 6F), whereas PCR and ELISA results indicated the upregulation of MKI67 expression (Supplementary Figures S32B). After coculturing HMFs, HPBMs, and HPBLs for four days in RPMI 1640 medium without L-arginine or serum and adding 3 mM L-arginine, WB analysis revealed that ARG1 protein expression was upregulated in the HPBMs of the Pal group and the interference with Pex inhibited the expression of the ARG1 protein in HPBMs (Fig. 6G). The cell viability of HPBLs was lowest in the d2 group and highest in the d5 group (Fig. 6H). We validated the cellular communication and metabolic mechanisms identified in scRNA-seq analyses among fibroblasts, macrophages, and lymphocytes through the coculture of human primary cells. Using in vitro primary cell coculture, we verified that Pal promoted fibroblast secretion of IGF1 and FGF7, which in turn stimulated macrophage ARG1 expression and affected lymphocyte viability. We then investigated the underlying mechanisms.

A IGF1 and FGF7 upregulated ARG1 expression in HPBMs. B Knockdown of IGF1 and FGF7 in HMFs, as well as treatment with Pex, inhibited ARG1 protein expression in HPBMs. C Pex did not affect the expression of IGF1 or FGF7 in HMFs. D Pal did not increase ARG1 expression in HPBMs. E ARG1 protein expression was upregulated in the Pal group of HPBMs, whereas siIGF1, siFGF7, and Pex inhibited ARG1 protein expression in HPBMs. ELISAof the arginine content in the coculture medium revealed the lowest arginine content in the b2 group and the highest content in the b5 group. F CCK-8 results indicating that arginine restored HPBL viability. G WB results showing that ARG1 protein expression was upregulated in the Pal group of HPBMs and that Pex inhibited ARG1 protein expression in HPBMs. H CCK-8 results revealed that the cell viability of the d2 group of HPBLs was the lowest and the survival rate was the highest in the d5 group. I IGF1 and FGF7 induced the phosphorylation of the STAT3 protein at tyrosine 705 in macrophages. J Pex inhibited STAT3 phosphorylation at tyrosine 705 in macrophages. K THP-1 cells were treated with 5 µM Stattic (a STAT3 phosphorylation inhibitor) for two days. Western blot (WB) analysis revealed that Stattic inhibited the expression of ARG1 protein, while IGF1 and FGF7 upregulated ARG1 expression in THP-1 cells. L mIHC analysis of HR + /HER2− breast cancer patient samples demonstrated that Pal induced STAT3 phosphorylation at tyrosine 705 in macrophages(Veh: n = 3; Pal: n = 3). M mIHC analysis of breast cancer-bearing mice revealed that Pal promoted STAT3 phosphorylation at tyrosine 705 in macrophages, whereas macrophage depletion resulted in the downregulation of STAT3 phosphorylation at this specific site (Veh: n = 3; Pal: n = 3; Pal+Pex: n = 3). Veh: vehicle, Pal: palbociclib, Pex: pexidartinib, Pal+Pex: palbociclib+pexidartinib, HMFs: human primary mammary fibroblasts, HPBMs: human peripheral blood primary macrophages, HPBLs: human peripheral blood primary lymphocytes. The data are shown as the means ± SEMs. *P < 0.05, **P < 0.01, ***P < 0.001, t test, Welch’s one-way ANOVA and one-way ANOVA.
Studies have shown that the activation of signaling pathways, such as the STAT3 and STAT6 pathways in macrophages, is closely related to the expression of ARG1 [40, 41]. To further investigate whether IGF1 and FGF7 affect macrophage ARG1 expression through these pathways, we selected THP-1 cells for in vitro mechanistic studies. THP-1 cells were treated with 100 ng/ml PMA for one day to induce their differentiation into macrophages and promote their adhesion. The macrophages were then treated with 100 ng/ml LPS and 20 ng/ml IFN-γ for two days to induce M1 macrophage polarization. Macrophages were treated with 20 ng/ml IL-4 and 20 ng/ml IL13 for two days to induce M2 macrophage polarization [42, 43]. After induction, the macrophages were treated with the corresponding recombinant proteins or drugs for two days (Supplementary Fig. S32C). Pex (5 μM) was used to inhibit the proliferation of THP-1 cells exposed to PMA (Supplementary Fig. S32D). The WB results obtained after THP-1 cell induction are shown in Supplementary Fig. S32E. Subsequently, THP-1 cells were treated with 50 ng/ml IGF1 and 50 ng/ml FGF7 for two days [44], and WB analysis revealed that IGF1 and FGF7 upregulated ARG1 protein expression in unpolarized macrophages and M2 macrophages (Supplementary Fig. S32F). IGF1 and FGF7 induced the phosphorylation of the STAT3 protein at site 705 in both unpolarized macrophages (Fig. 6I) and M2-polarized macrophages, whereas the STAT3 protein in M1 macrophages remained unphosphorylated (Supplementary Fig. S32G), possibly because negative regulatory factors are activated in M1 macrophages by IL4/IL13 induction, which inhibits the STAT3 pathway. Furthermore, LPS/IFN-γ-induced M1 macrophages typically lean toward inflammatory responses, whereas the STAT3 pathway in macrophages is associated primarily with anti-inflammatory or repair signaling, as observed in M2 macrophages. IGF1 and FGF7 slightly induced the phosphorylation of the AKT, ERK, and JNK proteins in macrophages (Supplementary Fig. S32H), and GSEA revealed that the ERK and MAPK signaling pathways were enriched in M2-like macrophages (Supplementary Fig. S32I). Subsequently, THP-1 cells were treated with 50 ng/ml CSF1, 50 ng/ml IL-34, and 5 μM Pex for two days in vitro [45,46,47], and CSF1 and IL-34 are ligands for the CSF1R receptor. WB results revealed that Pex inhibited the expression of the ARG1 protein in unpolarized macrophages and M2 macrophages (Supplementary Fig. S32J, K) and inhibited the phosphorylation of the STAT3 protein at tyrosine 705 in macrophages (Fig. 6J). THP-1 cells were treated with 5 µM Stattic (an inhibitor of STAT3 phosphorylation at tyrosine 705) (Supplementary Fig. S32D) for two days, and the WB results revealed that Stattic inhibited the phosphorylation of the STAT3 protein at tyrosine 705 and that the expression of the ARG1 protein was upregulated by IGF1 and FGF7 in THP-1 cells (Fig. 6K and Supplementary Fig. S32L). This may be due to the primary expression of ARG1 in M2 macrophages [48]. mIHC analysis revealed increased phosphorylation of STAT3 at tyrosine 705 in macrophages within tumor tissues from both post-Pal HR + /HER2− breast cancer patients and mouse models (Fig. 6L, M). This finding was validated by flow cytometry (Supplementary Fig. S33). Pex slightly inhibited the phosphorylation of the ERK protein in macrophages (Supplementary Fig. S32M). scRNA-seq and WB results indicated that Pal upregulated the expression of IGF1R and FGFR2 in unpolarized macrophages and M2-like macrophages (Supplementary Fig. S32N, O). On the basis of the above experiments, we found that IGF1, FGF7, and Pex affect ARG1 expression in macrophages by influencing STAT3 phosphorylation.
The combination of Pal and Pex inhibits the growth of HR + /HER2− breast cancer organoids
Breast cancer organoids were established from primary tumor cells isolated from two untreated HR + /HER2− breast cancer patients, and subsequently cocultured with peripheral blood mononuclear cells (PBMCs). The cells were divided into groups according to the treatments received—Veh, Pal, Pex, and Pal+Pex, and the duration of treatment was seven days (Fig. 7A).

A Breast cancer organoids were established from primary tumor cells isolated from untreated HR + /HER2− breast cancer patients, and subsequently cocultured with peripheral blood mononuclear cells. The cultures were treated with Pal or Pex (n = 3). B Pal+Pex reduced the volume and number of organoids. C–E EdU incorporation experiments in organoids demonstrated that Pal+Pex inhibited the proliferation of breast cancer organoids. ATP and LDH assays further confirmed these findings, showing that Pal+Pex inhibited the growth of breast cancer organoids, as validated by confocal microscopy. Veh: vehicle, Pal: palbociclib, Pex: pexidartinib, Pal+Pex: palbociclib + pexidartinib.
The breast cancer organoids were treated with Pal or Pex for seven days, and both agents inhibited tumor cell growth as early as the third day of treatment. After 7 days, Pal+Pex significantly inhibited tumor organoid growth. The organoid size and number were measured and analyzed using segmentation across different time points (Supplementary Figure S34). Compared with that on Day 0, the volume of the organoids in the Veh group increased by Day 7, while no significant change in the volume of the organoids in the Pal and Pex groups was observed by Day 7, and the volume of the organoids in the Pal+Pex group decreased. Compared with those on Day 1, the number of organoids in the Veh group increased by Day 7, while the number of organoids in the Pal and Pex groups decreased, and the volume of the organoids in the Pal+Pex group decreased (Fig. 7B). After the organoids were dispersed into a cell suspension, EdU staining was performed. In addition, ATP and LDH assays were conducted, and the results consistently demonstrated that Pal+Pex inhibited the growth of the breast cancer organoids, as confirmed by confocal microscopy (Fig. 7C–E).