
MHC-II is highly expressed in psoriatic skin lesions
First, our scRNA-seq analysis of epidermal samples from patients with psoriasis and HCs showed an enrichment of the antigen presentation pathway in psoriasis (Fig. 1a). Focusing on the major KC compartment (Supplementary Fig. 2a, b), we identified a significant upregulation of multiple MHC-II gene loci in psoriatic lesions (Fig. 1b). These genes exhibited distinct expression patterns across KC subpopulations, with the strongest enrichment observed in basal KCs (Supplementary Fig. 2c). MHC-II expression was also shown to be increased in the epidermis of patients with psoriasis by immunochemistry (Fig. 1c, d) and demonstrated good predictive performance for psoriasis diagnosis, with an area under the curve (AUC) value greater than 0.7 (Supplementary Fig. 2d). Meanwhile, the mRNA and protein levels of the classical murine MHC-II specific epitope H2-Ab1 were also increased in the epidermis (Fig. 1e, f) and whole skin tissues (Supplementary Fig. 2e–g) after IMQ topical application. These results suggest that MHC-II, particularly when expressed in the epidermis, may play a critical role in psoriasis.

a Enriched KEGG pathways in epidermal tissues from patients with psoriasis (Pso) and HCs based on scRNA-seq analysis. b Dot plot showing the increased expression of MHC-II genes in the KC cluster of the patients with psoriasis. c, d Representative image of immunohistochemical staining and statistical analysis of MHC-II expression in the epidermis of healthy volunteers (HC, n = 39) and patients with psoriasis (Pso, n = 39). Scale bars, 100 μm. e H2-Ab1 mRNA expression in IMQ-treated epidermal tissues. n = 6. f Immunoblot for the H2-Ab1 level in IMQ-treated epidermis lysate. n = 3. g Schematic diagram of anti-MHC-II intraperitoneal administration (200 μg) in IMQ-treated mice. h–k Phenotypic presentation (h) and H&E staining (i) as well as statistical analysis of the epidermal thickness (j) and PASI scores (k) of back skin from control or IMQ-treated mice injected with isotype IgG or anti-MHC-II. Scale bars, 100 μm, n = 7. l, m Flow cytometric analysis of the I-A/I-E percentage gated on the total live cells (l) or TH17 cell percentage gated on the CD4+ T cells (m) in the skin as indicated. n = 7. Data are shown as the mean ± s.d. P values were determined using one-way ANOVA with Tukey’s multiple comparisons test or two-tailed Student’s t-test. *P < 0.05, **P < 0.01, ***P < 0.001, ****P < 0.0001.
To further investigate the role of MHC-II, we blocked its function by administering an anti-MHC-II antibody and conducted experiments using the IMQ-induced psoriasis-like mouse model (Fig. 1g). Flow cytometry analysis of splenocytes indicated that MHC-II (I-A/I-E) expression was successfully blocked (Supplementary Fig. 2h). Anti-MHC-II treatment significantly reduced psoriatic dermatitis with ameliorated epidermal thickness, erythema, scaling and infiltration (Fig. 1h–k). Moreover, the I-A/I-E expression in the skin was also decreased after anti-MHC-II treatment (Fig. 1l), accompanied by a predominant TH17 cell percentage reduction in the IMQ-treated skin (Fig. 1m), indicating that MHC-II may facilitate the psoriasis process.
Genomic deletion of H2-Ab1 in the epidermis alleviates psoriasis-like inflammatory responses
Next, we constructed the epidermis-specific H2-Ab1 KO mice by crossing the H2-Ab1fl/fl mice with the K14-cre mice (Supplementary Fig. 3a). The expression of H2-Ab1 was successfully deleted in the epidermis (Supplementary Fig. 3b–d). As expected, the H2-Ab1 deficiency in the epidermis significantly attenuated IMQ-induced psoriasis-like inflammatory responses (Fig. 2a). The psoriatic severity regarding redness, scaling and infiltration in skin lesions, as well as epidermal thickness, was markedly reduced in K14.H2-Ab1fl/fl mice (Fig. 2b-d). The accumulation of TH17 cells as well as psoriasis-related molecules including Il17a, Il17c, Cxcl2, S100a8 and S100a9, was inhibited in the K14.H2-Ab1fl/fl mice (Fig. 2e, f). In addition, the spleen index was also reduced in K14.H2-Ab1fl/fl mice (Supplementary Fig. 3e). Meanwhile, H2-Ab1 deficiency in the epidermis did not affect skin thickness, inflammatory cell accumulation or the expression of psoriasis-related molecules under normal conditions (Fig. 2a–f).

a–d Phenotypic presentation (a) and H&E staining (b) as well as statistical analysis of the epidermal thickness (c) and PASI scores (d) of the ear skin in H2-Ab1fl/fl and K14.H2-Ab1fl/fl mice treated with sham or IMQ. Scale bars, 100 μm. e Representative flow cytometric plots and quantification of skin TH17 cell percentage gated on the CD4+ T cells as indicated. f The mRNA expression of psoriasis-related factors in the skin as indicated. g–j Phenotypic presentation (g) and H&E staining (h) as well as statistical analysis of epidermal thickness (i) and PASI scores (j) of the ear skin in H2-Ab1fl/fl and K14.H2-Ab1fl/fl mice treated with IL-23. Scale bars, 100 μm. k Quantification of skin TH17 cell percentage gated on the CD4+ T cells as indicated. n = 6. Data are shown as the mean ± s.d. P values were determined using one-way ANOVA with Tukey’s multiple comparisons test or two-tailed Student’s t-test. *P < 0.05, **P < 0.01, ***P < 0.001, ****P < 0.0001.
We also performed the IL-23-induced psoriasis-like mouse model using H2-Ab1fl/fl and K14.H2-Ab1fl/fl mice. Consistent with the above results, the psoriatic phenotype was relieved in K14.H2-Ab1fl/fl mice, compared with H2-Ab1fl/fl mice (Fig. 2g–j). TH17 cell infiltration in skin lesions was also attenuated in the H2-Ab1 KO mice under IL-23 treatment (Fig. 2k). These results indicate that the epidermal expression of MHC-II plays essential functions in the psoriasis process.
MHC-II expressed in KCs triggers antigen-dependent naive CD4+ T cell activation and proliferation
MHC-II expression could be enhanced in KCs under the stimulation of IFN-γ (Supplementary Fig. 4a-c), and IMQ treatment increased IFN-γ levels in skin tissue (Supplementary Fig. 4d). However, whether KCs functioned as APCs remained undefined. KCs alone were unable to activate naive CD4+ T cells isolated from the spleens of OT-II mice (Supplementary Fig. 4e). Following pretreatment with IFN-γ, KCs loaded with OVA resulted in the initiation and amplification of CD4+ T cell activation (Supplementary Fig. 4f). Moreover, KCs have features to enhance the proliferation of CD4+ T cells in an IFN-γ- and OVA-dependent manner (Supplementary Fig. 4g). However, the co-culture of KCs and naive CD4+ T cells did not affect TH17 cell differentiation (Supplementary Fig. 4h), even under TH17-skewing conditions (Supplementary Fig. 4i).
Next, primary KCs isolated respectively from the newborn H2-Ab1fl/fl mice and K14.H2-Ab1fl/fl mice were co-cultured with naive CD4+ T cells under IFN-γ and OVA pretreatment. As expected, KC-specific H2-Ab1 deficiency significantly restrained T cell activation and clonal expansion (Supplementary Fig. 4j,k), suggesting that the MHC-II molecule is required for the antigen presentation function of KCs.
The KO of H2-Ab1 expression in the epidermis reshapes the cellular and functional landscape of IMQ-induced psoriatic dermatitis
Then, we performed scRNA-seq to analyze the cell landscapes and transcriptional alterations in K14.H2-Ab1fl/fl mice with IMQ topical application (Fig. 3a). Many pivotal signaling pathways including the epidermal cell differentiation and IL-17 signaling pathway, were significantly enriched based on differentially expressed genes (DEGs) according to the scRNA-seq results (Supplementary Fig. 5a, b). Through Uniform Manifold Approximation and Projection (UMAP) plotting analysis, we identified eight cell clusters (Fig. 3b) based on the unique marker expressions (Fig. 3c). As previously reported, KCs and fibroblasts occupied the majority of the skin (Fig. 3d). The percentage of KCs was reduced in the K14.H2-Ab1fl/fl mice (Fig. 3e). Further subclustering of KCs identified four subpopulations according to differently expressed feature genes (Fig. 3f and Supplementary Fig. 6a), with the decreased proportion of inflammatory KC in the K14.H2-Ab1fl/fl mice (Fig. 3g). Moreover, KCs demonstrated a dynamic pseudo-temporal ordering from basal KC and cycling KC to inflammatory KC or spinous KC according to the transcriptional trajectory (Supplementary Fig. 6b–d). Key differentiation-related genes drove this progression (Supplementary Fig. 6e, f), while branch-dependent genes (for example, Krt17, Krt6a and Krt6b) influenced cell fate decisions (Supplementary Fig. 6g). Moreover, different trajectory structures were detected in KCs of H2-Ab1fl/fl and K14.H2-Ab1fl/fl mice (Supplementary Fig. 6h). MHC-II-deficient KCs inhibited abnormal epidermal differentiation owing to decreased retention of basal KC and cycling KC in the late stages of KC development for K14.H2-Ab1fl/fl mice (Supplementary Fig. 6i).

a Workflow of scRNA-seq for ear skin samples from the H2-Ab1fl/fl and K14.H2-Ab1fl/fl mice treated with IMQ (n = 3). b Representative UMAP plot of major cell populations in the ear skin of IMQ-treated mice. c Feature plots of expression distribution for cluster-specific marker genes in the identified cell types revealed by the heatmap. d Cell number of the major cell subsets shown by the bar plot. e The relative frequency of the major cell types in the H2-Ab1fl/fl and K14.H2-Ab1fl/fl mice. f UMAP visualization of cell subpopulations of KCs. g The proportions of subpopulations of KCs in the H2-Ab1 and K14.H2-Ab1fl/fl mice. h The proportions of immune cell subpopulations in the H2-Ab1fl/fl and K14.H2-Ab1fl/fl mice. i Heatmap of enriched KEGG pathways across differentiated genes of NK/NKT cells in the H2-Ab1fl/fl and K14.H2-Ab1fl/fl mice using GSVA. j Heatmap showing the differential interaction number or strength between KC subsets and NK/NKT cells. The color on the heatmap indicates whether H2-Ab1fl/fl or K14.H2-Ab1fl/fl mice predominate in terms of the number or strength of interactions for each cell type pair (blue: H2-Ab1fl/fl; red: K14.H2-Ab1fl/fl).
In myeloid cells, we identified five distinct clusters composed of DCs, Langerhans cells, macrophages, monocytes and neutrophils (Supplementary Fig. 7a), and each cell subpopulation was defined by characteristic markers (Supplementary Fig. 7b). T cells were further separated into γδT, TH17, cycling T, Treg, NK/NKT and CD8+ T cells (Supplementary Fig. 7c,d). Among these immune cells, proportions of DCs, Langerhans cells, TH17 cells and NK/NKT cells were predominantly reduced in the K14.H2-Ab1fl/fl mice (Fig. 3h). The roles of DCs, Langerhans cells and TH17 cells in the pathogenesis of psoriasis have been well known, while the function of NK and NKT cells in psoriasis remains unclear.
Based on the gene set variation analysis (GSVA) results, functional states especially cytotoxic characteristics of NK/NKT cells were significantly inhibited after specific KO of H2-Ab1 in KCs (Fig. 3i). CellChat analysis showed a reduction in both the number and strength of cell interactions in the K14.H2-Ab1fl/fl mice (Supplementary Fig. 8a). KCs mainly established mutual interaction with immune cells under the IMQ-induced psoriasis-like condition (Supplementary Fig. 8b). In particular, the number and strength of interactions between KC–NK/NKT cell pairs, especially basal-KC–NK/NKT pairs, were significantly reduced in K14.H2-Ab1fl/fl mice (Fig. 3j).
Depletion of NK/NKT cells by an inhibitor attenuates the IMQ-induced psoriasis-like phenotype
As KC-specific H2-Ab1 expression impaired proportions and functions of NK/NKT revealed by scRNA-seq results, we investigated the role of NK/NKT (expressing NK1.1 markers in flow cytometry) in the IMQ-induced mouse model and discovered the NK1.1+ cell accumulation and the GZMB released from NK1.1+ cells had been gradually raised during consecutive IMQ topical application (Fig. 4a, b). Both NK and NKT cell percentages were elevated in the IMQ-treated skin tissues (Fig. 4c, d) while only GZMB from NK cells had been remarkably increased with IMQ applications for 6 days (Fig. 4e, f), indicating that NK1.1+ cells, especially NK cells, might play a cytotoxic role in controlling their capacity to release GZMB, thereby exacerbating the development of psoriasis.

a, b Flow cytometric analysis of the percentage of NK1.1+ cells gated on the total live cells (a) and the GZMB release ratio gated on the NK1.1+ cells (b) as indicated. n = 6. c–f Flow cytometric analysis of the percentage of NK (c) or NKT cells (d) gated on the total live cells and the GZMB release ratio gated on the NK (e) or NKT cells (f) as indicated. n = 6. g Schematic diagram of anti-NK1.1 intraperitoneal administration (200 μg) in mice with IMQ topical application. n = 4. h–k Phenotypic presentation (h) and H&E staining (i) as well as statistical analysis of the epidermal thickness (j) and PASI scores (k) of the ear skin in the control or IMQ-treated mice with isotype IgG or anti-NK1.1 application. Scale bars, 100 μm. l, m Representative flow cytometric analysis of the NK1.1+ cell percentage gated on total live cells (l) or TH17 cell percentage gated on the CD4+ T cells (m) as indicated. n The mRNA expression of psoriasis-related factors in the skin as indicated. o Immunoblot for GSDME and its cleavage form in skin lysates. p The mRNA expression of pyroptosis-related factors in the skin as indicated. Data are shown as the mean ± s.d. P values were determined using one-way ANOVA with Tukey’s multiple comparisons test or two-tailed Student’s t-test. *P < 0.05, **P < 0.01, ***P < 0.001, ****P < 0.0001.
Then, we administered anti-NK1.1 antibodies to IMQ-induced psoriasis-like mice following a predefined time schedule (Fig. 4g). Depletion of NK1.1+ cells significantly abrogated the progression of psoriasis-like pathology induced by IMQ (Fig. 4h), as indicated by the reduced Psoriasis Area and Severity Index (PASI) score and decreased epidermal thickness (Fig. 4i–k). Moreover, the depletion of NK1.1+ cells by anti-NK1.1 antibody (Fig. 4l) significantly reduced TH17 cell responses (Fig. 4m) and mRNA expression of psoriasis-related inflammatory molecules, such as IL-17c, S100a8 and S100a9 (Fig. 4n).
A recent report showed that GZMB could cleave gasdermin E (Gsdme) and form nonselective pores on the cell surface, ultimately leading to pyroptosis25. The cleavage of GSDME was significantly elevated in IMQ-induced psoriasiform skin (Fig. 4o), whereas anti-NK1.1 antibody suppressed GSDME-related pyroptosis (Fig. 4o) as well as the mRNA levels of pyroptosis-related molecules, including Il1b, Ifng, Gzmb and Hmgb1 (Fig. 4p), indicating that NK/NKT cell-mediated pyroptosis exerts a vital role in psoriasis.
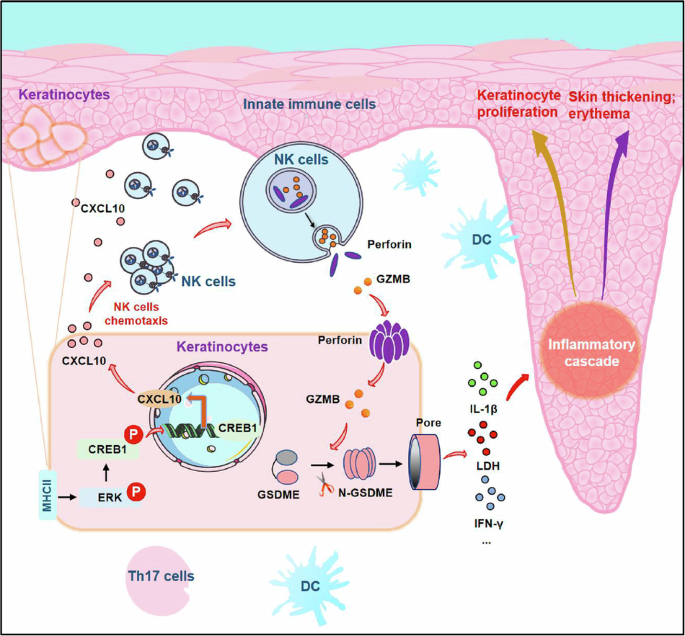
Deletion of MHC-II in KCs reduces NK cell recruitment through the regulation of CXCL10 via the ERK1/2–CREB axis
Next, we examined the percentage of NK (CD3⁻NK1.1⁺) or NKT(CD3⁺NK1.1⁺) cells in K14.H2-Ab1fl/fl mice under IMQ-induced psoriasis inflammation. The percentages of NK cells (rather than NKT cells) were decreased in these mice compared with the control mice (Fig. 5a). Moreover, GZMB release from NK cells was also reduced in epidermal-specific H2-Ab1-deficient mice under IMQ treatment (Fig. 5b).

a Representative flow cytometric plots and quantification of skin NK (top-left quadrants) or NKT cell (top-right quadrants) percentage. n = 6. b Flow cytometric quantification of the GZMB abundance in NK cells. n = 6. c Schematic diagram of the KC–NK cell co-culture systems. d The migration ratio of NK cells co-cultured with KCs from H2-Ab1fl/fl and K14.H2-Ab1fl/fl mice stimulated with or without IL-17A for 24 h. e Cxcl10 expression in the KC cluster based on the scRNA-seq analysis of IMQ-treated skin. f Cxcl10 mRNA level in the epidermis of H2-Ab1fl/fl and K14.H2-Ab1fl/fl mice treated with or without IMQ for 6 days. n = 6. g Cxcl10 mRNA expression in KCs isolated from the newborn H2-Ab1fl/fl mice and K14.H2-Ab1fl/fl mice with or without IL-17A stimulation for 24 h. h CXCL10 mRNA level in HaCaTs infected with vector or HLA-DQB1 lentivirus. i The KEGG enrichment analysis of KCs between H2-Ab1fl/fl and K14.H2-Ab1fl/fl mice based on DEGs from scRNA-seq results. j Cell lysates were extracted from KCs isolated from the newborn H2-Ab1fl/fl mice and K14.H2-Ab1fl/fl mice with or without IL-17A stimulation for 30 min; immunoblotting for p-Erk 1/2 and p-CREB levels in KCs was then performed. k CXCL10 mRNA level in HaCaTs infected with vector or CREB1 lentivirus. l ChIP–quantitative PCR (qPCR) assays for evaluating CREB1 binding to the CXCL10 promoter sites in HaCaTs. Data in d, g, h, j and k are representative of three independent experiments. Data are shown as the mean ± s.d. P values were determined using one-way ANOVA with Tukey’s multiple comparisons test or two-tailed Student’s t-test. *P < 0.05, **P < 0.01, ***P < 0.001, ****P < 0.0001.
To confirm MHC-II’s role in KC-mediated NK cell recruitment, we established a KC–NK cell co-culture system in vitro (Fig. 5c). We generated HLA-DQB1 (human MHC-II gene, corresponding to H2-Ab1) knockdown HaCaTs (Supplementary Fig. 9a, b) and then co-cultured these HaCaTs with NK92. The result showed the knockdown of HLA-DQB1 in HaCaTs significantly inhibited the NK92 migration under the treatment of IL-17A (Supplementary Fig. 9c). We also isolated KCs from the H2-Ab1fl/fl and K14.H2-Ab1fl/fl mice, which were co-cultured with primary NK cells, sorted from the spleen (purity >95%; Supplementary Fig. 9d). As shown in Fig. 5d, deletion of H2-Ab1 in KCs reduced the migration of NK cells.
To determine whether KC-mediated NK cell migration was linked to impaired chemokine signaling, we analyzed scRNA-seq data and found a significant reduction in Cxcl10 mRNA levels in the KC cluster of K14.H2-Ab1fl/fl mice (Fig. 5e). CXCL10 is a key chemokine implicated in both NK cell chemotaxis and psoriasis pathogenesis26,27, and its transcriptional expression was increased in the KC cluster of psoriatic skin lesions (Supplementary Fig. 9e, f) and decreased in the epidermis of K14.H2-Ab1fl/fl mice after IMQ treatment (Fig. 5f). Meanwhile, under IL-17A stimulation, the mRNA expression of CXCL10 was downregulated in HaCaTs with HLA-DQB1 knockdown or primary KCs isolated from K14.H2-Ab1fl/fl mice (Fig. 5g, h). Therefore, MHC-II deficiency in epidermal KCs might impair IMQ-induced NK cell recruitment by downregulating CXCL10 expression.
Subsequently, we investigated the possible mechanism of how MHC-II upregulated CXCL10 expression in KCs. Enriched KEGG pathway and GSVA analysis indicated that the MAPK signaling pathway was differentially regulated in KCs after H2-Ab1 KO (Fig. 5i and Supplementary Fig. 9g). Depletion of H2-Ab1 in the epidermis dramatically attenuated IL-17A induced activation of ERK1/2 and cyclic AMP response-element binding protein (CREB), but not that of p38 or JNK1/2 (Fig. 5j and Supplementary Fig. 9h). Knocking down expression of CREB1 (Supplementary Fig. 9i) inhibited the CXCL10 transcriptional expression (Fig. 5k). Meanwhile, ChIP results indicated that CREB1 could directly bind to the promoter of CXCL10 (Fig. 5l and Supplementary Fig. 9j, k). Taken together, MHC-II in KCs could transcriptionally regulate CXCL10 expression mediated by CREB1, consequently recruiting NK cells in psoriasis skin lesions.
GSDME-mediated pyroptosis facilitates the pathogenesis of psoriasis
Furthermore, we confirmed the increased NK cell percentage (Fig. 6a) and GZMB abundance in psoriasis skin lesions (Fig. 6b), consistent with the public scRNA-seq data. The GSDME level was increased in psoriatic skin cell populations (Fig. 6c). The transcriptional expression of GZMB and GSDME was also upregulated in psoriatic skin, as revealed by analysis of the psoriasis GEO database (Fig. 6d), supporting the important role of GZMB-mediated GSDME activation during psoriasis pathogenesis.

a–c scRNA-seq analysis of NK cell percentage (a), GZMB abundance (b) and the GSDME expression projected on the UMAP plot (c) under different skin conditions based on datasets GSE162183 and GSE173706 (healthy skin (HC), paralesional skin (PL) and psoriatic skin (Pso)). d Bioinformatic analysis of GZMB and GSDME expression in psoriatic lesions compared with healthy skin using psoriasis GEO data. e–h Phenotypic presentation (e) and H&E staining (f) as well as statistical analysis of the epidermal thickness (g) and PASI scores (h) of back skin in Gsdme−/− and WT mice with IMQ treatment. Scale bars, 100 μm. i Flow cytometric quantification of the TH17 percentage gated on the CD4+ T cells as indicated. j The mRNA expression of pyroptosis-related factors in the skin of Gsdme−/− and WT mice with IMQ treatment. k Schematic diagram of si-Gsdme topical application (2.5 nmol) every other day in the mice with IMQ treatment. l–o Phenotypic presentation (l) and H&E staining (m) as well as statistical analysis of the epidermal thickness (n) and PASI scores (o) of back skin in the control or IMQ-treated mice with or without si-Gsdme topical application. Scale bars, 100 μm. p Flow cytometric quantification of skin TH17 cells gated on the CD4+ T cells as indicated. q The mRNA expression of pyroptosis-related factors in the back skin as indicated. n = 5. Data are shown as the mean ± s.d. P values were determined using one-way ANOVA with Tukey’s multiple comparisons test or two-tailed Student’s t-test. *P < 0.05, **P < 0.01, ***P < 0.001, ****P < 0.0001.
Then, we applied the pyroptosis inhibitor Z-DEVD-FMK to the IMQ-induced psoriasis-like mouse model (Supplementary Fig. 10a), which blocked the cleavage of GSDME and indirectly inhibited pyroptosis. Interestingly, the application of Z-DEVD-FMK significantly alleviated the psoriatic phenotype (Supplementary Fig. 10b), including epidermal thickness and PASI scores (Supplementary Fig. 10c–e). Cleavage of GSDME in the skin was inhibited after the Z-DEVD-FMK treatment (Supplementary Fig. 10f), which also abrogated IMQ-induced psoriasis-like inflammatory responses characterized by decreased TH17 cell infiltration (Supplementary Fig. 10g) as well as reduced mRNA levels of pyroptosis-related molecules (Supplementary Fig. 10h).
To further investigate the effects of GSDME-mediated pyroptosis on psoriasis, we constructed the IMQ-induced psoriasis-like mouse model on the Gsdme−/− (KO) mice. The expression of Gsdme was significantly blocked in the Gsdme KO mice, identified by rtPCR and WB (Supplementary Fig. 11a, b). Gsdme−/− mice presented significantly alleviated psoriatic skin lesions compared with WT mice (Fig. 6e). The epidermal thickness (Fig. 6f, g) as well as the PASI scores (Fig. 6h) were remarkably reduced in Gsdme−/− mice. TH17 cell infiltration (Fig. 6i) as well as pyroptosis- and psoriasis-related molecules (Fig. 6j and Supplementary Fig. 11c, d) were also suppressed in skin lesions of Gsdme KO mice. The KO of Gsdme proved the similar alleviative effects on impeding the psoriatic pathological progression in the IL-23-induced psoriasis-like mouse model (Supplementary Fig. 11e–j).
Then, we validated the suppression effect on Gsdme expression by si-Gsdme (Supplementary Fig. 11k, l) and topically applied the siRNA targeting Gsdme on the IMQ-treated mice for inhibiting the Gsdme expression in the skin (Fig. 6k). The GSDME expression suppression blocked IMQ-mediated psoriasis-like dermatitis (Fig. 6l). The epidermal thickness and the psoriatic phenotype, including redness, scaling and thick infiltration, were significantly reduced in the si-Gsdme-treated mice (Fig. 6m–o). The accumulating TH17 cells in the IMQ-induced skin were suppressed after si-Gsdme topical application (Fig. 6p). Inhibition of GSDME expression in the skin by siRNA also reduced mRNA levels of pyroptosis-related molecules, including Il1b and Tnf (Fig. 6q), as well as psoriasis-related factors, such as Cxcl2 and S100a8 (Supplementary Fig. 11m). The above results confirmed the pivotal role of GSDME-mediated pyroptosis in driving the inflammatory changes associated with psoriasis.
NK cells predominantly target KCs to induce the GSDME-mediated pyroptosis through GZMB
Given that GSDME is a key molecule to initiate the pyroptosis procedure, we tested the effect of epidermal expression of MHC-II on the activation of GSDME. As expected, the cleavage of GSDME was significantly blocked in the skin of K14.H2-Ab1fl/fl mice, compared with the control mice (Fig. 7a). Moreover, under IMQ-induced psoriatic conditions, K14.H2-Ab1fl/fl mice exhibited significantly reduced mRNA expression of pyroptosis-related genes and lower secretion levels of IL-1β and HMGB1 in the skin (Fig. 7b–e), consistent with the scRNA-seq results that Ucell scores for pyroptosis-related gene signatures were reduced after specific H2-Ab1 KO in epidermis (Supplementary Fig. 12a).

a Immunoblot for GSDME and its cleavage form in skin lysates of H2-Ab1fl/fl and K14.H2-Ab1fl/fl mice treated with IMQ. n = 3. b, c The mRNA expression of pyroptosis-related factors in the skin of H2-Ab1fl/fl and K14.H2-Ab1fl/fl mice treated with or without IMQ. n = 6. d, e The secretion of IL-1β (d) and HMGB1 (e) in the skin of H2-Ab1fl/fl and K14.H2-Ab1fl/fl mice treated with or without IMQ measured by ELISA. n = 6. f Phase-contrast images of cell morphology for HaCaTs co-cultured with or without NK92. g HaCaTs co-cultured with or without NK92 were stained with PI and visualized under bright field or the fluorescence microscopy. h The cell death level of HaCaTs co-cultured with or without NK92 was measured by LDH. i Cell lysates were extracted from HaCaTs co-cultured with or without NK92. Immunoblot for the GSDME and its cleavage form was then performed. j Phase-contrast images of cell morphology for primary KCs transfected with or without GZMB. k Primary KCs transfected with or without GZMB were stained with PI and visualized under bright-field or fluorescence microscopy. l The cell death level of primary KCs transfected with or without GZMB was measured by LDH. m Cell lysates were extracted from primary KCs transfected with or without GZMB. Immunoblot for the GSDME and its cleavage form was then performed. Data in f–m are representative of at least three independent experiments. Data are shown as the mean ± s.d. P values were determined using one-way ANOVA with Tukey’s multiple comparisons test or two-tailed Student’s t-test. *P < 0.05, **P < 0.01, ***P < 0.001, ****P < 0.0001.
However, it is still necessary to determine which cell type was the major target of NK cells in MHC-II-mediated GSDME-related pyroptosis alterations. GSDME was mainly expressed in fibroblasts and KCs (especially basal KC) (Supplementary Fig. 12b, c). Based on the mouse scRNA-seq results, pyroptosis level scores were significantly higher in KCs than in fibroblasts (Supplementary Fig. 12d). Furthermore, in the CellChat analysis, NK/NKT predominantly established cell–cell communication with KCs rather than fibroblasts (Supplementary Fig. 12e). The number and strength of interactions were reduced, particularly in basal KCs of K14.H2-Ab1fl/fl mice, when NK/NKT cells acted as the major signal inputs (Supplementary Fig. 12f).
To verify the spatial orientation and connection between NK cells and KCs, we conducted the spatial transcriptomic sequencing using IMQ-induced ear skin samples from H2-Ab1fl/fl and K14.H2-Ab1fl/fl mice. Major cell populations were identified in the spatial context. Generally, the KC cluster was predicted to be preferentially in the epidermal layers of the skin tissues, while the fibroblast cluster was predicted to predominantly occupy the dermal region of the skin tissues (Supplementary Fig. 13a). NK cells were located in the epidermal compartment around the KC cluster but were detected at low levels in the skin tissues of K14.H2-Ab1fl/fl mice (Supplementary Fig. 13b). Nkg7, Gzmb and Gsdme expression was mapped mostly within epidermal regions (Supplementary Fig. 13c), with a co-expression or local distribution in the lower layer of the epidermis or the vicinity of basal KCs (Supplementary Fig. 13d). Intercellular communications between KCs and NK cells were more predominant in H2-Ab1fl/fl mice compared with K14.H2-Ab1fl/fl mice (Supplementary Fig. 13e).
Moreover, HaCaTs co-cultured with NK92 promoted cell death and pyroptotic pores (Fig. 7f), measured as increased PI uptake (Fig. 7g) and lactate dehydrogenase (LDH) release (Fig. 7h). The expression of N-GSDME was also enhanced in the KC/NK cell co-culture condition (Fig. 7i). KCs transfected with GZMB exhibited pyroptosis-related cell death morphology, accompanied by increased PI uptake, LDH release and elevated N-GSDME expression (Fig. 7j–m).
MHC-II in the epidermis drives the skin trafficking of NK cells by CXCL signaling and induces subsequent GSDME-elicited pyroptosis in psoriatic skin lesions
To further validate the relationships between MHC-II and NK cell-mediated pyroptosis in psoriasis, we examined the expression of MHC-II, CD56 (NK cell characteristic marker), GZMB and cleaved-GSDME in psoriasis and healthy skin samples by using multicolor immunohistochemistry (Fig. 8a and Supplementary Fig. 14a). As expected, the expression of MHC-II+ in the epidermis was elevated in psoriatic skin tissues, while the numbers of CD56+, GZMB+ and cleaved-GSDME+ cells in the skin were also markedly increased in individuals with psoriasis compared with HCs (Fig. 8b). Most importantly, we found significant positive correlations between the expression of MHC-II in the epidermis and the levels of CD56, GZMB and cleaved-GSDME in the psoriasis skin lesion (Fig. 8c). In the epidermal region, colocalization of CD56+GZMB+ NK cells with N-GSDME+ cells was observed, supporting the role of NK cells in inducing pyroptosis in KCs (Supplementary Fig. 14b).

a, b Representative multiple immunohistochemical staining images at 100× magnification (a) and the statistical analysis of expression levels of MHC-II in the epidermis and CD56, GZMB and N-GSDME in the skin of HC (n = 10) and psoriasis (Pso) (n = 10) (b). MHC-II+ cells are in white, CD56+ cells are in orange, GZMB+ cells are in green, and N-GSDME+ cells are in red. c The correlations of MHC-II+ cell number in epidermis and CD56+, N-GSDME+ and GZMB+ cell numbers in whole skin. d Representative H&E image and corresponding spatial distribution of NK cells in skin samples from HC and Pso. e Cell clustering analysis for cells from Pso and HC skin tissues. f Heatmaps showing the differential interaction number or strength among cell clusters. The color on the heatmap indicates which group predominates in the number or strength of interactions for each cell type pair (blue, HC; red, Pso). g Communication quantities of CXCL signaling pathway network among cell clusters in skin samples from HC and Pso. Panels d–g are based on the spatial transcriptomic data from GSE202011. Data are shown as the mean ± s.d. P values were determined using one-way ANOVA with Tukey’ s multiple comparisons test or two-tailed Student’s t-test. *P < 0.05, **P < 0.01, ***P < 0.001, ****P < 0.0001.
The public spatial transcriptomic data for patients with psoriasis confirmed the increased expression of MHC-II in the epidermis (Supplementary Fig. 15). Cell type identification in the spatially resolved regions (Supplementary Figs. 16–18) revealed that NK cells were preferentially located near the basal layer of the epidermis and increased in psoriatic lesions (Fig. 8d). Furthermore, graph-based clustering of skin spots was classified into eight cell clusters (C0–C7) (Fig. 8e), of which C2 and C3 had enhanced mutual cell communications in patients with psoriasis (Fig. 8f). C3 was mainly located in the epidermal region, predominantly composed of KCs while NK cells belonged to C2. As our above data supported that KCs mediated the NK cell migration under the chemotactic role of CXCL10 in psoriasis, we further validated and extended our findings on how CXCL signaling coordinates cellular communication in a spatial context. Psoriatic lesions showed enhanced CXCL signaling (Supplementary Fig. 19), particularly from C3 to C2 (Fig. 8g). These results suggest that CXCL signaling may mediate the recruitment of C2 cluster-resident cells (including NK cells) to KC-rich regions, laying the foundation for subsequent KC–NK cell crosstalk.