
CRISPRa screens identified T cell cytotoxicity regulators
T cells recognize cancer (neo)antigens via the T cell receptor (TCR) and, on binding, release granzymes and perforins via the cancer–T cell-immune synapse to elicit cell death only in the target cells. TCR-specific T cell cytotoxicity provides one of the most precise mechanisms to eliminate cancer cells.
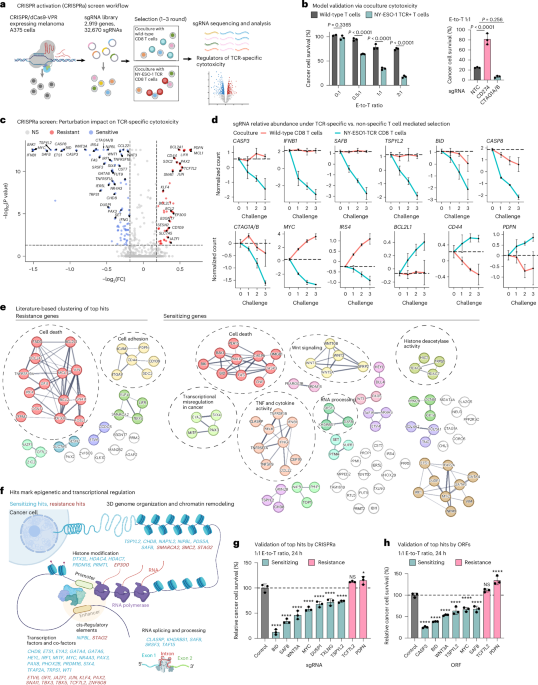
To uncover genes that (de)sensitize cancer cells to TCR-specific cytotoxicity, we conducted a CRISPRa screen in melanoma cells under selection with TCR-specific and TCR-nonspecific T cells (Fig. 1a and Extended Data Fig. 1a). In brief, we isolated human primary CD8 T cells from blood samples and transduced them to express a TCR with clinical activity23,24,25 that recognizes the NY-ESO-1 antigen, constitutively expressed by A375 melanoma cells (Fig. 1b and Extended Data Fig. 1b–f). We transduced A375 cells to stably express CRISPR–dCas9-VPR26,27 (Extended Data Fig. 1g–i) and a library of 32,670 single-guide RNAs (sgRNAs), targeting a total of 2,919 genes (10 sgRNAs per gene) and 560 nontargeting control (NTC) gRNAs (Supplementary Table 1), enriched with genes associated with immunotherapy response in patients with melanoma28. We challenged the melanoma cells with up to three rounds of coculture (0.25:1 effector-to-target (E-to-T) ratio for 24 h) with either the NY-ESO-1 TCR or wild-type T cells from the same donor (Fig. 1a and Extended Data Fig. 1a).

a, Overview of the CRISPRa screen. b, Model validation: TCR-specific cytotoxicity recorded in melanoma A375 cells cocultured for 24 h with wild-type or NY-ESO-1 TCR T cells (from the same donor) at different E-to-T ratios (left) and in A375 cells with CRISPRa of CD274 (encoding for PD-L1), CTAG1A/B (encoding for the antigen NY-ESO-1) or NTC sgRNA at a 1:1 E-to-T ratio (right). Data are presented as mean ± s.d. with each data point representing a technical replicate (n = 3 per group). Groups were compared via two-way analysis of variance (ANOVA) and Šídák’s multiple-comparison test (left) and one-way ANOVA and Dunnett’s multiple-comparison test (right). c, Summary statistics of the CRISPRa screen results identifying perturbations that result in a selective (dis)advantage specifically in coculture with NY-ESO-1 TCR T cells versus wild-type T cells from the same donor, shown as an adjusted P value (BH FDR, MAGeCK; Methods and y axis) and fold-change (FC; x axis). d, Normalized counts of sgRNAs targeting the indicated genes in coculture with NY-ESO-1 TCR T cells or wild-type T cells (from the same donor). Normalized counts on the y axis are log21p-transformed counts scaled to have a 0 value at challenge 0. Data are presented as mean ± s.d., n = 10 sgRNAs pre-target, except for BCL2L1 with n = 20. The genes encoding for NY-ESO-1 (CTAG1A and CTAG1B) are targeted by the same ten sgRNAs and thus denoted as CTAG1A/B. e, CRISPRa top TCR-specific cytotoxicity hits (nodes) with edges denoting connections based on the STRING database65. f, Graphic depiction of the sensitizing (cyan) and resistance (red) hits involved in epigenetic and transcriptional regulation. g,h, Single hit validation with isogenic A375 cells. Relative survival of cancer cells in coculture with NY-ESO-1 TCR T cells versus wild-type T cells (from the same donor) is shown for A375 melanoma cells with CRISPRa-based (g) and ORF-based (h) overexpression of different hits. The values were normalized to the percentage survival observed in control cells and shown as mean ± s.d., with each data point representing a technical replicate (n = 3 per group). ****P < 0.0001, *P < 0.05, NS, nonsignificant; one-way ANOVA, Dunnett’s multiple-comparison test. Illustrations in a and f created in BioRender; Jerby Lab https://biorender.com/qdelxmb (2026).
A total of 38 and 90 genes showed significant enrichment and depletion specifically in the context of TCR-specific cytotoxicity and were denoted as resistance and sensitizing hits, respectively (Benjamini–Hochberg (BH) false discovery rate (FDR) <0.05, MAGeCK29,30; Fig. 1c–f, Extended Data Fig. 2a, Supplementary Table 2 and Methods). Resistance and sensitizing sgRNAs were monotonically enriched and depleted with every challenge, respectively (Fig. 1d) and CTAG1A/B (encoding for NY-ESO-1) were sensitizing hits (BH FDR < 1 × 10⁻¹⁷, MAGeCK; Fig. 1c,d). Validating the results of the screen, isogenic A375 lines, each transduced with a single sgRNA or open reading frame (ORF) to overexpress one of a selected set of top hits (Extended Data Fig. 2b), confirmed the expected increase or decrease in TCR-specific cytotoxicity (Fig. 1g,h) and a follow-up mini-screen focused on top hits recapitulated the top hits identified in the large screen (Extended Data Fig. 2c,d).
Comparing the hits identified here to those identified in a collection of eight cancer immune evasion CRISPR knockout screens10,11,12,16,31,32,33,34, nine of the CRISPRa-resistance hits (P = 2.31 × 10⁻⁴, hypergeometric test: BCL2, BCL2L1, CD44, EP300, FADD, ITGAV, JUN, MAN2B2 and MCL1) and 13 of the sensitizing hits (P = 1.64 × 10⁻⁴, hypergeometric test: CASP3, CASP8, CHD8, CLASRP, ETS1, FAS, IRF1, KHDRBS1, NIPBL, PPP2R3C, SAFB, TNFRSF1A and TNFRSF1B) were previously reported to sensitize or confer resistance on knockout, respectively, indicating the distinction between knockout and activation-based assessment of gene function. Comparing the hits identified here to those identified in an in vitro CRISPRa screen previously conducted in A375 cells to identify genes that confer resistance to T cell cytotoxicity31, only five of the resistance hits overlap (P = 6.27 × 10⁻³, hypergeometric test, five overlapping hits: BCL2A1, COL4A3, LIFR, MCL1 and SDC2), indicating the distinction between general and TCR-specific T cell cytotoxicity.
The hits identified here are functionally diverse (Fig. 1e,f), spanning the full spectrum of transcriptional and epigenetic regulation (BH FDR < 7.54 × 10⁻⁵, hypergeometric test), including regulators of three-dimensional (3D) DNA architecture, chromatin and histone modifiers, transcription factors and RNA processing or splicing genes (for example, resistance: EP300, ETV6, JAZF1 and TCF7L2; and sensitizing: ETS1, EYA2, GATA4, GATA6, KHDRBS1, NIPBL, NR4A3, PRDM16, SAFB, SRSF3 and TSPYL2; Fig. 1f). Many of the hits are involved in developmental processes (for example, resistance: GFI1, PAX2, SNAI1, TCF7L2 and ZIC2; and sensitizing: MITF, PAX8, PHOX2B and TNC) and insulin sensing (for example, resistance: TCF7L2 and JAZF1; and sensitizing: IRS4 and PEA15) and include a suite of receptors, cell surface and secreted proteins (for example, resistance surface glycoproteins: CD44 and PDPN; and sensitizing: WNT1, WNT3, WNT3A and TNC).
As expected, the resistance hits are enriched for anti-apoptotic genes (BH FDR = 2.58 × 10⁻⁵, hypergeometric test: BCL2A1, MCL1, BCL2L1 and BCL2), whereas the sensitizing hits are enriched for pro-apoptotic genes (BH FDR = 2.37 × 10⁻⁴, hypergeometric test: for example, BAK1, BID, CASP3, CASP8 and FAS). The expression of resistance and sensitizing hits in The Cancer Genome Atlas melanoma cohort (>400 patients)35 is associated with worse and better overall survival, respectively (BH FDR < 0.05, Cox’s regression; Supplementary Fig. 1a and Supplementary Table 2a).
Based on baseline fitness effects (irrespective of T cell cytotoxicity), the screen resulted in 115 and 33 positive and negative fitness hits (Extended Data Fig. 2e,f and Supplementary Table 2a,c), which are enriched for oncogenes and tumor suppressors, respectively (P = 5.61 × 10⁻⁶, 0.017, hypergeometric test, respectively) and distinct from the TCR cytotoxicity hits (r = −0.056, −0.037, P = 0.002, 0.048, Pearson’s correlation). Of the 90 sensitizing hits, 68 did not show a significant connection to fitness at baseline, indicating that these perturbations are synthetically lethal with TCR-specific cytotoxicity. These TCR-specific sensitizing hits include central cell death regulators, such as CASP3, BID and BAK.
Further investigating CASP3, we demonstrated the concept of ‘immune RNA-based synthetic lethality’, where the expression of a gene is not lethal at baseline, but enhances TCR-specific cytotoxicity. First, melanoma (A375) and cervical cancer (CaSki) cells with ORF-based overexpression of CASP3 (CASP3OE) were significantly more sensitive to TCR-specific cytotoxicity (Figs. 1h and 2a and Extended Data Fig. 3) but showed no significant change in their viability and proliferation (Fig. 2b). Second, CASP3OE A375 cells were not more susceptible to tumor necrosis factor (TNF), IFNγ and a Bcl-2 inhibitor compared to control A375 cells (Fig. 2c and Supplementary Fig. 1b–d). Third, ORF-based overexpression of CASP3 in primary CD8 T cells did not impact T cell viability, expansion and cytotoxicity (Fig. 2d,e). Fourth, CASP3 RNA delivery to a coculture of wild-type A375 and NY-ESO-1 TCR T cells via a cationic lipid-based or polymer-based nanoparticle significantly enhanced TCR-specific cytotoxicity (Fig. 2f). Mechanistically explaining this immune RNA-based synthetic lethality, CASP3OE A375 cells maintain the protein in its inactive pro-caspase-3 form in monoculture, which is cleaved to its active form in coculture with targeting T cells (Fig. 2g,h). In contrast, cleaved caspase-3 is undetectable in the control A375 cells, both in monoculture and in coculture (Fig. 2g), demonstrating how restoration of CASP3 expression restores cancer cell responsiveness to T cell cytotoxicity.

a, Left: illustration of the coculture used to test top hits in a different cancer type and with a different TCR and antigen. HPV16+ CaSki cells express the HPV16 oncoprotein E7 and present it on major histocompatibility complex (MHC)-I (HLA-A2 allele), allowing E7 TCR-specific cytotoxicity. Validations of this model are depicted in Extended Data Fig. 3. Right: percentage of surviving CaSki cells (y axis) in coculture with E7 TCR T cells, shown for CaSki cells transduced to express different ORFs (mean ± s.d., n = 6 technical replicates per group). The P value is from two-way ANOVA and Dunnett’s multiple-comparison test. b, Confluency of different A375 (left) and CaSki ORF (right) lines (that is, transduced with different ORFs for constitutive expression of different hits) measured via Incucyte. Cells were monitored for 16 h, with images taken every 1.5 h (mean ± s.d., n = 4–6 technical replicates per group). c, Viability of A375 ORF lines measured via PrestoBlue after 24-h treatment with varying doses (x axis) of IFNγ (left) or TNF (right) (mean ± s.d., n = 2–3 technical replicates per group). d,e, Primary CD8 T cells transduced with lentivirus for ORF-based overexpression of CASP3. CASP3 expression was measured via quantitative PCR (qPCR) and normalized to GAPDH (d, left); cytotoxicity was measured in 24-h coculture with A375 cells at 0.5:1 and 1:1 E-to-T ratio (d, right). Data are presented as mean values (n = 3 technical replicates per group). **P < 0.01, two-tailed Student’s t-test. e, T cell counts over 6 d in monoculture (mean ± s.d., n = 2–3, technical replicates per group). NS, two-way ANOVA. f, Delivery of CASP3 RNA via cationic lipid-based or polymer-based nanoparticle in A375 cancer cell coculture with NY-ESO-1 T cells. CASP3 expression in the A375 cells was measured via qPCR and normalized to GAPDH (left) and cancer cell survival with RNA delivery in coculture versus monoculture measured via PrestoBlue (right). Data are presented as mean values (n = 3 technical replicates per group). ****P < 0.0001, unpaired, two-tailed Student’s t-test. g, Western blot of pro-caspase-3 and cleaved caspase-3 protein levels measured in control and CASP3OE A375 cells that were untreated in monoculture, treated with etoposide (24 h at 2.5 μM) in monoculture or untreated in cocultured with NY-ESO-1 TCR CD8 T cells (1:1 E-to-T ratio, 24 h; Methods). The experiment was conducted once to demonstrate this protein-level property of caspase-3 in accordance with the screen data and other experiments conducted here. h, Proposed model of CASP3 RNA-based synthetic lethality with TCR-specific cytotoxicity. Illustrations in a and h created in BioRender; Jerby Lab https://biorender.com/qdelxmb (2026).
Source data
Perturb-seq reveals converging effects across hits
As hits were enriched for transcriptional and epigenetic regulators (BH FDR < 7.54 × 10⁻⁵, hypergeometric test; Fig. 1f), we turned to investigate underlying mechanisms via a CRISPRa Perturb-seq screen17 (276 sgRNAs targeting 61 genes or hits; Supplementary Table 3). CRISPRa A375 cells, cultured in monoculture or with the NY-ESO-1 TCR T cells (24-h coculture at 1:1 E-to-T ratio), were profiled via 5ʹ-droplet-based single-cell RNA sequencing (scRNA-seq) together with direct capture and sequencing of the sgRNA spacer36 (Fig. 3a), resulting in a total of 20,207 high-quality scRNA profiles from monoculture (12,640 cells) and coculture (7,567 cells), with 2,660 control cells (that is, carrying NTC sgRNAs; Fig. 3b,c).

a, Overview of Perturb-seq screen. b, Concordant transcriptional shifts of sgRNAs targeting the same gene. Pearson’s correlation coefficients of the transcriptional shifts (z-scores) of pairs of sgRNAs stratified to sgRNAs targeting the same or different genes and to pairs of NTC sgRNAs (Methods). The coefficient distributions are shown when computed based on the monoculture (left) and coculture (right) Perturb-seq data. c, Uniform Manifold Approximation and Projection (UMAP) of Perturb-seq single-cell gene expression profiles, with cells colored based on (from left to right) culture conditions, MYC sgRNA detection, expression of a cell-cycle signature66 and expression of the anti-apoptotic gene BIRC3 (log21p-transformed transcript per 100,00 (tp100K); Methods). d, Normalized expression values (centered and scaled log1p-transformed tp10k) shown across the control (NTC) cells (columns) in monoculture or 24-h coculture with NY-ESO-1 TCR T cells at a 1:1 E-to-T ratio. They were further stratified based on cell-cycle status (top horizontal bar). The genes depicted are immune-resistance (red) and immune-sensitizing (black) hits identified based on this and prior CRISPR screens10,11,12,16,31,32,33,34, which are also overexpressed in the control cells in coculture compared to monoculture. e, Left: the number of CRISPRa-sensitizing and CRISPRa-resistance hits included in each of the 61 GA signatures, shown for both upregulated and downregulated subsets of each signature. Right: the total number of genes (x axis) included in each GA signature (y axis). f, Clustering of sensitizing and resistance genes based on their co-regulation in the Perturb-seq screen (Supplementary Note 1). g, Regulatory Perturb-seq-based network. Nodes represent resistance (red) and sensitizing (light-blue) hits; edges denote that the source node is upregulating (red) or downregulating (blue) the transcription of the target node based on the Perturb-seq data. Hits that regulate other hits are to the left and those that are regulated by other hits are to the right, such that the more hits that regulate the gene (that is, a higher number of incoming edges), the further it is to the right (bottom bar). Importantly, only the CRISPRa hits that were perturbed in the Perturb-seq screens can have outgoing edges. This network thus captures only a subset of the regulatory interactions between CRISPRa hits. h, Combining the regulatory Perturb-seq-based network (annotations as in g) with ligand–receptor interactions (dashed lines) demonstrating that multiple hits either regulate or interact with a ligand–receptor hub. Nodes include CRISPRa-resistance (red) and CRISPRa-sensitizing (light-blue) hits, as well as resistance Perturb-seq hits (yellow), which are annotated as such because they are downregulated by two or more CRISPRa-sensitizing hits. Illustration in a created in BioRender; Jerby Lab https://biorender.com/qdelxmb (2026).
T cells substantially impacted the cancer cell transcriptome (Fig. 3c), both priming and protecting the cancer cells from the immune attack (Fig. 3d and Supplementary Table 4). Genes overexpressed in coculture compared to monoculture (denoted as co-UP genes, log(fold-change) >0.25, BH FDR < 0.01, edgeR37,38; Methods) include pathways required for TCR-based target cell recognition—antigen presentation, cell adhesion (for example, ICAM1), cytokines (for example, CXCL1, CXCL11, CXCL9 and/or CXCL10), JAK-STAT pathway and IFN response genes (for example, IRF1, IRF2, IRF7, IRF9, ISG15, ISG20, JAK2, STAT1, STAT2, STAT3)—potentially explaining why further activation of these pathways via CRISPRa did not sensitize the cancer cells to TCR-specific cytotoxicity. Co-UP genes are enriched for both immune-sensitizing (P = 8.88 × 10⁻¹⁶, hypergeometric test) and immune-resistance genes (P < 1 × 10⁻¹⁷, hypergeometric test; Fig. 3d) identified here and in previous CRISPR screens10,11,12,16,31,32,33. Co-UP genes are enriched for positive regulators of apoptosis (P < 1 × 10⁻¹⁷, hypergeometric test) but also include central anti-apoptotic genes (for example, BCL2A1, MCL1, BCL3, BIRC2 and BIRC3; P < 1 × 10⁻¹⁷, hypergeometric test; Fig. 3c,d). Genes underexpressed in coculture versus monoculture (denoted as co-DOWN genes, log(fold-change) < −0.25, BH FDR < 0.01, edgeR) are associated with tissue development and cell differentiation (P < 1 × 10⁻¹⁷, hypergeometric test; Supplementary Table 4).
Next, we identified a gene activation (GA) signature per perturbation, consisting of all the genes significantly overexpressed or underexpressed in the perturbed cells (expressing one of the sgRNAs targeting the pertaining gene) compared to the control cells (BH FDR < 0.01, edgeR test; Extended Data Figs. 4–9). Four lines of evidence testify to the validity of the GA signatures. First, for 84% of the sgRNAs, the cells where the sgRNA was detected significantly overexpress the target gene compared to the control cells (P < 0.05, edgeR; Extended Data Figs. 4 and 5 and Supplementary Table 5). Second, sgRNAs targeting the same gene had similar transcriptional effects (Fig. 3b and Supplementary Table 6). More specifically, the transcriptional shifts measured by a normalized z-score per sgRNA (Methods) were most correlated when considering sgRNAs targeting the same gene (Fig. 3b) and the GA signature identified for a given gene based on two out of its three sgRNAs was significantly overexpressed (P < 0.05, one-sided Student’s t-test) in the cells carrying the left-out sgRNA compared to the control cells in 81% of the cases (average area under the receiver operating characteristic curve (AUROC) = 0.75; Supplementary Figs. 2 and 3, Supplementary Table 6 and Methods). Third, the GA signatures defined based on monoculture data generalized to the coculture data, and vice versa (P < 0.05, one-sided Student’s t-test, in 100% of the cases and AUROC > 0.7 in 70% of the cases; Extended Data Fig. 6 and Supplementary Fig. 4; here the target genes were removed from the GA signatures to avoid favorably skewing the results). Of note, IFNB1 was an exception, because CRISPRa IFNB1 led to IFNB1 overexpression and transcriptional alterations only in coculture (Extended Data Figs. 6, 7a and 8 and Supplementary Fig. 4). Fourth, the GA signatures generalized to a published CRISPRa screen conducted in K562 cells (Supplementary Fig. 5a)39.
GA signature size varied and was proportional to other measures of perturbational transcriptional shifts40 (Fig. 3e, Supplementary Figs. 5b–e and 6–9 and Supplementary Table 7a). Overlap between GA signatures defined clusters of similar signatures (Extended Data Fig. 7b and Supplementary Table 7b). As expected, WNT1, WNT3 and WNT3A GA signatures showed the most significant overlap (Jaccard index >0.1, P < 1 × 10⁻¹⁷, hypergeometric test; Extended Data Fig. 9a). However, similar to the transcriptional response to T cells, many perturbations upregulated both immune-sensitizing and immune-resistance genes and downregulated both immune-sensitizing and immune-resistance genes (Fig. 3e and Supplementary Fig. 5e). Defining a co-regulation score for each pair of genes based on the number of perturbations where the two genes are both upregulated or both downregulated further shows that co-regulation modules include a mix of sensitizing and resistance genes (Fig. 3f). The Perturb-seq data thus reveal a regulatory network, but additional information is needed to conclude which downstream effects can explain the resistance or sensitizing effects of the perturbations.
We thus introduced the concept of ‘Perturb-seq hits’—genes that are regulated by multiple hits in a manner that supports their involvement exclusively in either positive or negative regulation of the phenotype of interest, in this case, TCR-specific cytotoxicity (Methods). Genes upregulated and downregulated by multiple resistance and sensitizing CRISPRa hits, respectively, were nominated as candidate resistance Perturb-seq hits. Likewise, genes upregulated and downregulated by multiple sensitizing and resistance CRISPRa hits, respectively, were nominated as candidate-sensitizing Perturb-seq hits. Genes that were nominated as only resistance or only sensitizing candidate Perturb-seq hits were defined as the final set of Perturb-seq hits.
Pruning the Perturb-seq-based regulatory network to include only CRISPRa hits that are also Perturb-seq hits reveals that CRISPRa hits regulate other CRISPRa hits in a manner that can explain their phenotype (Fig. 3g). At the center of this network (Methods) is the neuronal development gene GAS7, a resistance CRISPRa hit that is upregulated by two other resistance CRISPRa hits (HNF4A and STAG2) and downregulated by six sensitizing CRISPRa hits (MYC, IRS4, PTMA, WNT3, WNT3A and PRDM16). In accordance with this, both resistance and sensitizing CRISPRa hits are enriched for neuronal development genes (for example, OLIG2, NEURL1, NR4A2 and TNC; P < 0.005, hypergeometric test), potentially related to melanoma cells originating from the neuronal crest lineage and processed of de- or trans-differentiation.
CRISPRa hits and Perturb-seq hits converge to a shared set of ligand–receptor interactions: 53 ligands and receptors interact with both CRISPRa and Perturb-seq resistance hits (P = 3.27 × 10⁻⁹, hypergeometric test) and 16 ligands and receptors interact with both CRISPRa-sensitizing and Perturb-seq-sensitizing hits (P = 3.48 × 10⁻⁴, hypergeometric test). Refining the Perturb-seq-based regulatory network to include all CRISPRa and Perturb-seq hits and integrating ligand–receptor interactions41,42,43 yield a regulatory ligand–receptor network. At the center of this network is a hub of 14 ligand–receptor interactions linking 9 resistance hits (CRISPRa-resistance hits: CD44, COL1A1 and COL4A3; Perturb-seq hits: ITGB8, TGFB1 and NID1; both CRISPRa and Perturb-seq hits: SDC2, ITGAV and HGF; Fig. 3h). At the center of this hub are collagen–integrin interactions and CD44, a stem-cell marker known for its role in cancer cell stemness, self-renewal, tumor initiation and progression44,45,46.
MYC and SAFB as regulators of TCR-specific cytotoxicity
To test the hits in vivo, we performed a focused, in vivo CRISPRa screen spanning the 61 genes perturbed in the Perturb-seq screen. We engrafted the pool of CRISPRa A375 cells in immunocompromised (NSG) mice (n = 18) and treated a subset of the mice with NY-ESO-1 TCR T cells (Methods). MAGeCK analyses comparing tumors from treated and untreated mice identified five T cell resistance (BCL2L1, CD44, E2F1, IRF1 and JUN) and three sensitizing hits (SAFB, TCF7L2 and TSPYL2, BH FDR < 0.05, with MYC showing mixed effects; Supplementary Table 8), further supporting the role of the regulators identified here, including CD44, the nucleosome assembly protein TSPYL2 and the chromatin regulator SAFB. MYC and SAFB ORF-based overexpression also sensitized human papilloma virus (HPV)-positive CaSki cells to T cells with a TCR targeting the E7 HPV oncoprotein47 (Figs. 2a and 4a and Extended Data Fig. 3), thus generalizing to virally infected cells with a different TCR and a different (viral) antigen.

a, MYC ORF-based overexpression sensitizes cervical cancer cells to T cell cytotoxicity. The fraction of surviving HPV+ cervical cancer cells (y axis) in coculture with E7 TCR T cells (1:1, 48 h), is shown for CaSki cells transduced to express a control, BID or MYC ORF (mean ± s.d., n = 3 technical replicates per ORF). ****P < 0.001, ordinary one-way ANOVA, Dunnett’s multiple-comparison test. b, Fold-change in A375 cell viability after 24-h treatment with FasL (200 ng ml−1), shown for A375 cells with ORF-based overexpression of different sensitizing hits compared to A375 cells with a control ORF (mean ± s.d., n = 3–6 technical replicates per ORF). ****P < 0.0001, **P < 0.01, ordinary one-way ANOVA, Dunnett’s multiple-comparison test, compared to control cells. c, UMAP of Perturb-seq data of control (NTC) and MYC CRISPRa cells, colored based on: (1) culture conditions, (2) sgRNA and MYC expression level, (3) the expression of the MYC GA signature and (4) the expression of the CRISPRa-resistance hit GAS7 (log21p-transformed tp100k). d, Expression of MYC GA signature in control (NTC) cells and cells with MYC CRISPRa sgRNAs, further stratified based on MYC expression in monoculture (left) and coculture (right). The number of cells in each group is shown in parentheses (n). Boxplots: the middle line shows the median, the box edges show the 25th and 75th percentiles and the whiskers show the most extreme points that do not exceed ±1.5× the interquartile range (IQR). Further outliers are marked individually with circles (minima or maxima). ****P < 0.0001, one-tailed Student’s t-test.
MYC is a major oncogene that has been shown to support immune evasion48,49,50,51,52,53,54. Its sensitizing effects observed here (Figs. 1c,d,g,h and 4a,b and Extended Data Fig. 10a) are aligned with its role as a positive regulator of apoptosis55,56. It has been previously suggested that a modest increase in MYC expression triggers proliferation, whereas a dramatic increase triggers apoptosis56. Yet, at the RNA level, only 1.85% of the cells with MYC CRISPRa show MYC expression levels higher than those observed in control cells, and similar transcriptional alterations are found in MYC CRISPRa cells also on modest or low MYC overexpression (rs > 0.82, P < 1 × 10⁻¹⁰, Spearman’s correlation; Fig. 4c,d and Methods). Both high and low MYC CRISPRa overexpression significantly upregulated sensitizing CRISPRa hits (P = 7.38 × 10⁻³, hypergeometric test; for example, BAK1, BID, POLR1A and/or POLR3A, SAFB and WNT3) and downregulated resistance CRISPRa hits (P = 2.27 × 10⁻³, hypergeometric test; for example, BCL2A1, CD109, CSF1, ETV6, FADD, MCL1 and SMARCA2), most notably GAS7 (Figs. 3g and 4c,d). In accordance with previous studies48,49,50,51,52,53,54, MYC CRISPRa downregulated antigen presentation genes (human leukocyte antigen (HLA) genes), STAT1, STAT2 and IFNγ response genes also in A375 cells (Supplementary Fig. 10a and Supplementary Table 7a), further indicating that these processes are not limiting TCR-specific cytotoxicity in this context. MYC ORF-based overexpression had no significant impact on A375 cell susceptibility to IFNγ and TNF (Supplementary Fig. 10b) but sensitized the cells to Fas ligand (FasL; Fig. 4b). Pan-caspase inhibition rescued MYC-overexpressing A375 cells from NY-ESO-1 TCR T cell cytotoxicity (Supplementary Fig. 10c). These findings call for further investigation into the potentially context-dependent role of MYC in immune evasion.
SAFB (scaffold attachment factor B) emerged as a robust and TCR-specific sensitizing hit (Figs. 1c–h, 2b,c, 3e and 4b). In contrast to MYC, SAFB CRISPRa overexpression showed no impact on cell proliferation or fitness at baseline (Fig. 1d). SAFB encodes a DNA-binding and RNA-binding protein that attaches the base of chromatin loops to the nuclear matrix57,58. Although depletion of SAFB has been shown to alter 3D genome organization and decrease genomic compartmentalization57,58, SAFB CRISPRa had minimal impact on the transcriptome of A375 cancer cells based on our Perturb-seq data (Fig. 3e). Validating SAFB synthetic lethality, ORF-based overexpression of SAFB in A375 cells had no impact on cell viability and proliferation (Fig. 2b) or susceptibility to IFNγ and TNF (Fig. 2c). In contrast to CASP3, BID and MYC, SAFB overexpression also had no impact on cancer cell susceptibility to FasL (Fig. 4b). Collectively, these findings demonstrate that SAFB plays a uniquely specific and potentially therapeutically relevant role in facilitating TCR-specific, granzyme- and perforin-based cytotoxicity, manifesting immune RNA-based synthetic lethality.
In situ Perturb-seq for pooled optical genetic screens
To investigate intercellular mechanisms, we developed in situ Perturb-seq for pooled optical genetic screens with in situ detection of genetic perturbations and spatial transcriptomics readouts at single-molecule resolution (Fig. 5a,b, Extended Data Fig. 10b–d and Methods). We first applied in situ Perturb-seq to immunocompromised (NSG) mice with engraftment of A375 cancer cells (Fig. 5c–g). A375 melanoma cells were transduced to overexpress one of the seven top hits (WNT3A, MYC, TSPYL2, CASP3, PDPN, CD44 and TCF7L2), CD274 as a positive control, VAV1 or an empty control ORF with barcode only (Extended Data Fig. 10c). Xenograft tumors containing the pool of genetically modified melanoma cells were engrafted, collected and profiled via CosMx59 for detection of 1,000 human genes at single-molecule resolution along with in situ detection of the ORF barcodes (Fig. 5b,c, Methods and Extended Data Fig. 10d).

a, Schematics of key questions that in situ Perturb-seq can be used to address in a multiplexed manner. b, In situ Perturb-seq design. Each ORF or sgRNA is matched to one to five concatenated barcodes, such that each barcode is designed to align an error-robust probe for high-plex detection of different perturbations. c, Experimental workflow of in situ Perturb-seq applied here. Top: pooled ORF-expressing A375 melanoma cells engrafted in NSG mice for in situ ORF detection and spatial transcriptomics with a 1,000 human gene panel. Bottom: pooled ORF-expressing B16 melanoma cells engrafted in C57BL/6 mice and profiled for in situ ORF detection and spatial transcriptomics with a 1,000 mouse gene panel. d–g, In situ Perturb-seq applied to A375 xenografts in NSG mice. d, In situ Perturb-seq detection of the genetic perturbation (CD44 ORF) in the intact tumor tissue matching the expression of the target gene (CD44 RNA levels). e, In situ Perturb-seq detection of MYC ORF matching the overall expression of the MYC GA signature. f, Expression of GA signatures distinguishing between control and perturbed cells in unseen tumors, as shown when defining the GA signature based on differentially expressed genes that are supported (blue) or not supported (red) by spatially aware differential gene expression statistical models. The classification performances are shown based on a leave-one-tumor-out crossvalidation procedure (LOOCV; Supplementary Note 1). g, Size of the GA signatures (x axis) identified via in situ Perturb-seq for different ORFs (y axis). DEGs, differentially expressed genes; env, environment. Illustrations in b and c created in BioRender; Jerby Lab https://biorender.com/qdelxmb (2026).
In total, 950,988 cells were profiled, including 351,915 cancer cells carrying one of the 10 ORFs, confirming robust ORF-based gene overexpression (Fig. 5d). Cancer cells expressing the same ORF were often spatially clustered together as a clone, creating ‘perturbational zonation’ within the tumor and thus mitigating crossperturbation confounding effects (Fig. 5d,e and Methods; P < 0.01 for all ORFs, empirical permutation tests). Controlling for spatial location in the statistical model of differential gene expression resulted in more robust in vivo GA signatures (Fig. 5f and Methods). These in situ Perturb-seq GA signatures (Fig. 5g and Supplementary Table 9) significantly overlapped the Perturb-seq-based ones (P = 2.16 × 10⁻¹², Fisher’s test). The WNT3A GA signature supported by both datasets showed enrichment for overexpression of genes involved in embryonic development (for example, SOX4, TWIST1 and WNT5A; P = 1.95 × 10⁻³) and the MYC GA signature was enriched for overexpression of MYC target genes (for example, HSP90AB1, PTGES3 and SRSF2; P = 1.36 × 10⁻³, hypergeometric test; Fig. 5e).
Although a subset of the mice was treated with an NY-ESO-1 TCR T cell injection, only a small number of T cells were detected in the tumors (<0.3% of the cells per tumor), necessitating other model systems to study the perturbation impact on the tumor microenvironment.
In situ Perturb-seq reveals intercellular mechanisms
In situ Perturb-seq can help us track how a perturbation in one cell impacts other cells around it and how the response of a cell to a perturbation changes as a function of its environment (that is, cell–cell and gene–environment interactions; Fig. 5a). To leverage this, we applied in situ Perturb-seq with a 1,000 mouse gene panel in immunocompetent (C57BL/6) mice engrafted with pooled B16 syngeneic melanoma cells subject to ORF-based overexpression of one of the top hits (Casp3, Ccl22, Jun, Lifr, Myc and Wnt3), Cd274 or a control ORF (Fig. 6). Tumors were collected on reaching a critical mass (~200 mm3) and profiled together.

a, Representative immunofluorescence and matching cell segmentation and cell-type annotations of 4 (out of 637) fields of view (FOVs) from B16 tumors. b, UMAP of the B16 in situ Perturb-seq data, with cells colored based on (1) cell-type annotations, (2) cluster assignment and (3–6) expression of cell-type signatures defined in previous single-cell studies28,67,68. c, A section from a B16 tumor (tumor 7, pool 2). Each dot corresponds to a cancer cell, colored based on ORF detection and plotted on the x–y spatial coordinates. d, GA signatures (left) and pMCPs (right) identified in the B16 in situ Perturb-seq data for the seven ORFs, stratified to upregulated and downregulated genes in the different cell types (Methods). e, Expression of the T cell compartment of the Ccl22 (left), Cd274 (middle) and Wnt3 (right) pMCPs in the T cells (y axis), stratified based on the relative abundance of cancer cells with the respective ORF in the T cell micro-FOV (x axis). ****P < 0.0001, one-tailed, unpaired Student’s t-test. The number of micro-FOVs is shown in parenthesis per group. Boxplots: the middle line shows the median, the box edges show the 25th and 75th percentiles and the whiskers show the most extreme points that do not exceed ±1.5× the IQR. Further outliers are marked individually with circles (minima or maxima).
The data include a total of 503,180 high-quality annotated cells, 446,547 of which were annotated as cancer cells (Fig. 6a–c). To process the data and accurately annotate the cells, we devised a scheme that is based on the generation of high-quality reference maps (Methods), resulting in cell-type-specific clusters annotated as cancer cells, T cells, macrophages, fibroblasts and endothelial cells based on their expression of cell-type markers and signature (Fig. 6a,b). ORF detection matched the overexpression of the target gene (Supplementary Table 10a) and, once again, cancer cells harboring the same ORF co-localized (Fig. 6c and Methods; P < 0.001 for all ORFs, empirical permutation tests).
Demonstrating gene–environment interactions, overexpression of the receptor Lifr had a different impact on the cancer cell transcriptome depending on the expression levels of its ligands in nearby cells. LifrOE cells overexpressed acute inflammation and other Lifr-related genes (for example, Stat3 and Cxcl1), overexpressed interleukin-6 (IL-6) production regulators (for example, Cd36, Klf2 and Nod2) in microenvironments with high Clcf1 expression, overexpressed steroid-related genes (for example, Apoc1, Stat5b and Tnf) in microenvironments with high Osm expression and overexpressed IFNγ response genes (for example, Csf2rb, Cxcl9 and Ifi44l) in microenvironments with high Lif expression (P < 0.01, mixed-effects models; Methods and Supplementary Table 10b).
Following our previous work, where we demonstrated the concept of multicellular programs (MCPs, that is, different genes across different cell types that are co-expressed when the cells are next to each other in the tissue)60, we used in situ Perturb-seq to identify perturbation MCPs (pMCPs), consisting of genes that are differentially expressed in a given cell type on ‘exposure’ to cancer cells with the pretraining perturbation (Fig. 6d, Supplementary Table 10c and Methods). The pMCPs identified in the in situ Perturb-seq B16 data include both cell-type-invariant and cell-type-specific effects, such that the size of the pMCP signature diverges from the size of the matching GA signature, potentially capturing cell-autonomous versus intercellular modes of action (Figs. 5a and 6d).
Cd274 (encoding PD-L1), Ccl22 and Wnt3 overexpression in the cancer cells was associated with shifts in the state of nearby immune and stromal cells, including T cells (Fig. 6d,e). As expected, T cell dysfunction genes were overexpressed in T cells residing in proximity to Cd274OE B16 cancer cells (P = 8.15 × 10⁻⁴, hypergeometric test). T cell activation markers, including the co-stimulatory gene Cd28, were overexpressed in T cells in proximity to Wnt3OE cancer cells (Fig. 6e). To test this, we performed ex vivo experiments and found that, indeed, exposure of primary human CD8 T cells to soluble Wnt3a significantly increased T cell cytotoxicity (Fig. 7a), IFNγ secretion (both at baseline and under chronic activation, Fig. 7b) and IL-2 secretion (more than a ninefold increase; Fig. 7c). This demonstrates how in situ Perturb-seq can help uncover intercellular regulation and ways to reinvigorate T cells via sensitizing hits identified in cancer cells.

a–c, Wnt3a impacts T cell cytotoxicity, IFNγ and IL-2 secretion. a, A375 cancer cells (top row) or NY-ESO-1 TCR T cells (bottom row) were treated with recombinant human Wnt3a (200 ng ml−1) for 24 h. Wnt3a was then washed off, and A375 cells were cocultured or monocultured (middle row) with the NY-ESO-1 TCR T cells (1:1) for 24 h. Cancer cell viability was measured via PrestoBlue (y axis). Data are presented as mean values (n = 2–3 technical replicates per group, compared via ordinary one-way ANOVA). b, Primary CD8 T cells stimulated with CD3 or CD28 beads and treated with recombinant human Wnt3a (200 ng ml−1) every 3 d. IFNγ secretion was measured by ELISA. The results are shown for T cells derived from three different donors (n = 3 biological replicates per timepoint and treatment group). ***P < 0.0001, two-tailed, paired Student’s t-test. c, Primary CD8 T cells derived from two donors cultured for 72 h with and without treatment with recombinant human Wnt3a (200 ng ml−1). IL-2 secretion was measured by ELISA. Data are presented as mean ± s.d. (n = 9 technical replicates per condition and donor). ****P < 0.0001, ***P < 0.001, two-sided, unpaired Welch’s t-test. d–f, Ifnb1 overexpressing MC38 cancer cells preventing tumor growth and resulting in a white mass even when comprising only 10% of the cancer cell population. d, MC38 colorectal cancer cells transduced to overexpress ORFs of sensitizing and resistance hits. The cells were then pooled into two pools, each with ten different ORFs, such that Ifnb1, Dll4 and Tspyl2 ORFs were included in pool 2 but not in pool 1 (Methods). Tumor volume (mean ± s.e.m., y axis) measured at the indicated times (x axis) is shown, with arrows marking tumor collection times. ***P = 0.0008, two-tailed, unpaired Welch’s t-test comparing final tumor volume measurements. e, Tumor weight (shown as mean ± s.e.m., y axis) was measured post-resection for the tumors shown in d. The tumor-draining lymph nodes of tumors from pool 2 were enlarged and were also collected and weighed (Extended Data Fig. 10e). **P = 0.0064, two-tailed, unpaired Welch’s t-test. f, The final tumor weight of MC38 tumors with ORF-based overexpression of a single sensitizing hit: Dll4, Ifnb1 or Tspyl2 (n = 2 per hit).
Source data