
Ethics declarations
The animal protocols received authorization from Hunan Cancer Hospital’s Institutional Animal Care and Use Committees (Permit number: KNZY-202411). Tissue microarray acquisition received Shanghai Outdo Biotech Company Ethics Committee approval (Permit numbers: SHYJS-CP-101005 and YB M-05-02). The study protocol for validating SLC25A10 levels in human colon cancer specimens passed review and received approval from Hunan Cancer Hospital’s Ethics Committee (Permit number: 143).
Cell strains and maintenance
HCT116, LoVo and MC38 cell lines were provided by the Cell Center, Central South University. HCT116 and LoVo were maintained in DMEM containing 10% fetal bovine serum (FBS) from Procell (Wuhan, China) and 1% penicillin/streptomycin (NCM Biotech, Suzhou, China). MC38 was grown in RPMI-1640 medium (Procell) containing identical supplements. All cells were grown at 37 °C in a 5% CO₂ humidified atmosphere.
Lentiviral vector transfection
The lentiviral vectors used for the overexpression and knockdown of human and mouse INHBA were sourced from Genechem (Shanghai, China); empty vector served as control. Human and mouse CRC cells were transfected with these lentiviral vectors. Post-transfection, cells received 2 μg/ml puromycin (BasalMedia, Shanghai, China) in the culture medium to select and enrich the transfected cells with antibiotic resistance. INHBA overexpression and silencing efficiency were subsequently assessed via qPCR and Western blot.
Plasmid constructs, siRNA sequences, and cellular transfection
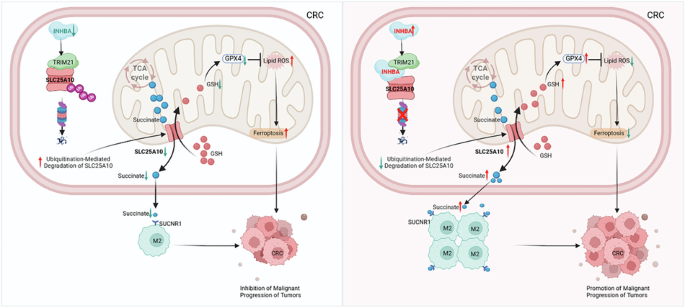
The plasmids used in this study included human INHBA pcDNA3.1-Flag-C, human INHBA sh1 + 2 pLKO.1, human SLC25A10 pcDNA3.1-HA-C, human SLC25A10 pcDNA3.1-MYC-C, human TRIM21 pcDNA3.1-HA-C, human TRIM21 pcDNA3.1-His-C, human shTRIM21 pLKO.1, and mouse SLC25A10 pcDNA3.1-HA-C, all of which are ampicillin resistant. Additionally, the plasmid pDsRed2-Mito is kanamycin resistant. UNIBIO (Changsha, China) supplied these plasmids. Professor Ming Zhou of Central South University kindly supplied the plasmids pCMV-HA-Ub and its K48 and K63 variants.
Morzan Biotech (Shanghai, China) synthesized the siRNAs for this investigation with these sequences: human si-SLC25A10, sense 5’-GGAUGCAGAACGACGUGAA-3’, and antisense 5’-UUCACGUCGUUCUGCAUCC-3’. Mouse si-SLC25A10, sense 5’-GUACCUGAGUGACAACAUATT-3’, antisense 5’-UAUGUUGUCACUCAGGUACTT-3’.
Cell transfections utilizing the jetPRIME® transfection reagent (Polyplus®, France) were executed adhering to the supplier’s guidelines.
RNA isolation, reverse transcription, and RT–qPCR
Using the Total RNA Rapid Extraction Kit for Cells/Tissues (NCM Biotech), we isolated total cellular RNA following the manufacturer’s protocol. Total RNA was subsequently converted to cDNA via All-in-One Script RT premix (with dsDNase) (KERMEY, Zhengzhou, China). RT–qPCR was then performed with 2×SYBR Green qPCR Premix (KERMEY). The sequences of primers employed are listed in Supplementary Table 5.
Western blot
Whole-cell lysates were prepared with RIPA buffer containing protease-inhibitor cocktail (NCM Biotech) following the supplier’s protocol. Mitochondria were isolated and lysed with the Cell Mitochondria Isolation Kit (Beyotime Biotechnology, Shanghai, China). BCA kit (Abbkine Scientific, Wuhan, China) was used to measure protein content, using bovine serum albumin (BSA) for the standard curve. Using 10% SDS‒PAGE gels (NCM Biotech), the proteins underwent electrophoretic separation before being transferred onto PVDF membranes supplied by Millipore (USA). After blocking with 5% skim milk (Yili, China), membranes were probed overnight at 4 °C with primary antibodies in blocking buffer. The primary antibodies used are detailed in Supplementary Table 6. After being washed three times with PBST for 15 min each, the membranes were subjected to 1-h incubation at 37 °C with HRP-linked secondary antibodies, and then were washed again three times with PBST for 15 min each. Proteins were detected via an enhanced chemiluminescence (ECL) solution (NCM Biotech) according to the manufacturer’s protocol.
Coimmunoprecipitation
For co-immunoprecipitation, 30 μL protein A/G magnetic beads (Biolinkedin®, Shanghai, China) were pre-conjugated with antibodies by incubation at room temperature for 2 h. Alternatively, specific antigen-coated magnetic beads, including anti-DYKDDDDK (Flag), anti-Myc, and anti-HA magnetic beads (Biolinkedin®, Shanghai, China), were directly used for coimmunoprecipitation without prior antibody conjugation. These beads were selected on the basis of the epitope tags present in the target proteins. Cells were lysed in Western and IP lysates (NCM Biotech) plus protease inhibitors. Upon centrifugation (12,000 × g, 4 °C, 15 min), the supernatant was rocked with either antibody-bound or the specific antigen-coated magnetic beads overnight at 4 °C. The immune-complex-laden beads were then meticulously rinsed six times with pre-cooled lysis buffer, eluted by boiling, and analyzed by Western blot. See Supplementary Table 6 for antibody details.
Ubiquitination assay
Cells seeded in 10-cm dishes were subjected to 48 h transfection, treated with 20 μM MG132 (MCE, USA) for 4 h, and lysed. Anti-Myc magnetic beads were used for IP, and ubiquitination was evaluated via Western blot with an anti-ubiquitin antibody.
Immunofluorescence assays
For cellular immunofluorescence staining, we employed a multiplex fluorescence staining kit from AiFang Biological (Hunan, China). The samples underwent initial fixation using a 4% paraformaldehyde solution (Biosharp®, Beijing, China) for 15 minutes, followed by permeabilization with 0.1% Triton X-100 (Beyotime Biotechnology) for 20 min to enhance antibody penetration. Following 30 min of blocking with 5% BSA (Bovogen, Australia) to minimize nonspecific binding, cells underwent primary antibody incubation overnight at 4 °C.
The next day, the secondary antibody was applied under ambient conditions for 30 min, followed by a 10-min incubation with the fluorescent dye. After two 10-min washes at 37 °C with elution buffer, samples were subjected to a second round of blocking, primary and secondary antibody incubation, and fluorescent dye staining. To visualize the cell nuclei, we treated the cells with DAPI (Beyotime Biotechnology) for 10 min. Finally, photographic documentation was acquired from no fewer than three randomly selected regions utilizing either an Olympus fluorescence microscope (Japan) or a Leica laser confocal microscope (Germany).
For tissue-section immunofluorescence staining, the sections underwent xylene dewaxing, followed by gradual rehydration using a descending ethanol gradient, and underwent antigen retrieval with AR6 buffer (Akoya Biosciences, USA) in a microwave. Following 10-min incubation with 3% H₂O₂ to inhibit endogenous peroxidase, multiplex immunofluorescence was carried out in sequential cycles: 1% BSA blocking, primary antibody, HRP-conjugated secondary antibody (Akoya Biosciences), and Opal fluorophore (1:100) with tyramide signal amplification. Antibody complexes were stripped by heat-mediated retrieval between rounds. Following the final cycle, the slides underwent DAPI spectral counterstaining (Akoya Biosciences) and mounting in Abcam antifade medium (UK). Images were acquired at ×200 magnification via a PANNORAMIC SCAN II slide scanner (3Dhistech, Hungary). Supplementary Table 7 presents the specifics of the utilized antibodies.
Colony formation assay
Post-transfection, the cell suspension was diluted to 1000 cells/mL within the culture medium before being transferred to 12-well plates. Cells were then cultured continuously for 10–14 days or until well-defined colonies emerged, then stained with crystal violet (Solarbio®, Beijing, China) for visualization.
EdU cell proliferation assay
CRC cells with stable INHBA overexpression or INHBA knockdown were cultivated in 12-well dishes prelined with coverslips. After culturing for 12 hours, a 2×EdU working solution (final concentration of 20 μM) was prepared and prewarmed at 37 °C. This prewarmed solution was added at equal volume to yield 1× EdU (10 μM) for 2 h. Medium was then aspirated, cells were fixed with 4% paraformaldehyde for 15 min, washed three times (5 min each) with wash buffer, and permeabilized for 10–15 min at ambient temperature. Once permeabilized, they were subjected to two additional washes (5 min each), incubated with Click reaction mix for a half-hour in the dark, and washed three times (3–5 min each) with wash buffer. Finally, the cell nuclei were dyed with Hoechst 33342 and imaged on an Olympus fluorescence microscope (Japan).
Cell migration and invasion assays
To evaluate migration and invasion, Transwell chambers (Millipore) were employed. The lower compartment contained DMEM with 20% FBS. 2% FBS cell suspensions were plated in the upper chamber (with or without Matrigel, Corning, USA). Following a 48-h incubation period at 37 °C, non-migrated/non-invaded cells on the upper surface were removed with a cotton swab. Chambers were fixed with 4% paraformaldehyde (30 min) and crystal-violet-stained (1%, 10 min, Solarbio®). Finally, cells on the underside were imaged and quantified under an inverted phase-contrast microscope in three randomly picked fields.
Preparation of conditioned medium and coculture of CRC cells with THP-1 cells
To obtain CM from CRC cells, supernatants were collected 48 h post-transfection, centrifuged (3000 rpm, 10 min), and filtered (0.22 μm, Millipore). CM was either used immediately to coculture with PMA-differentiated THP-1 cells (100 ng/ml, 24 h, MedChemExpress, USA) or stored at −80 °C for later use.
In CRC cells–THP-1 transwell cocultures, CRC cells were transfected for 48 h and seeded into 24 mm, 0.4 μm pore inserts (37006, SPL Life Sciences, South Korea). Inserts were placed in 6-well plates containing PMA-induced THP-1 cells (100 ng/ml, 24 h) and cocultured for a further 24 h.
Enzyme-linked immunosorbent assay
To assess IL-10, Arg-1, TGF-β1, and VEGFA expression in macrophages, CM was cocultured with PMA-induced (100 ng/ml, 24 h) THP-1 cells for an additional 24 h. Alternatively, we adopted CRC cell–THP-1 transwell coculture experiments and maintained the coculture for an additional 24 h. We subsequently measured the levels of these cytokines via ELISA kits (ELK Biotechnology, Wuhan, China).
To measure the intracellular and extracellular succinate levels, as well as the intracellular NAD⁺ and NAD⁺/NADH ratios, in CRC cells, we used succinate ELISA kits (MEI MIAN, Jiangsu, China) and NAD⁺/NADH detection kits (Beyotime Biotechnology) 48 h after cell transfection.
To determine intracellular GPX4 activity in CRC cells, samples were collected 48 h post-transfection and analyzed via the GPX4 Activity Assay Kit (Elabscience, Wuhan, China) adhering to the kit’s protocol.
To determine the GSH content in the mitochondria of CRC cells, we first isolated the mitochondria via a mitochondrial isolation kit (Beyotime Biotechnology). We then measured the GSH content via a reduced GSH colorimetric assay kit (Elabscience).
The levels of IL-10, Arg-1, TGF-β1, VEGFA, succinate, NAD⁺, and GSH, as well as GPX4 enzyme activity, were measured via a Merck microplate reader (Germany).
Wide-targeted metabolomic sequencing
HCT116 cells in 150 mm dishes were transfected for 48 h with either negative-control or INHBA-overexpression vectors, snap-frozen on dry ice, and sent to MetWare (Wuhan, China) for further examination.
Liquid chromatography with tandem mass spectrometry
Gel bands were destained, reduced/alkylated, and digested with trypsin (37 °C, overnight). Peptides were dried, re-suspended in LC buffer, and analyzed on an LTQ-Orbitrap Velos (Thermo Fisher, USA) coupled to a Dionex RSLC nano-LC. Proteins were identified with Proteome Discoverer 1.4 (Thermo Fisher) against UniProtKB/Swiss-Prot (10 ppm precursor, 0.8 Da fragment tolerance); peptides with false discovery rate (FDR) < 1% were retained.
Measurements of mitochondrial iron using Mito-FerroGreen
Mito-FerroGreen stands out as a specialized probe designed to detect ferrous ions within mitochondria. CRC cells transfected for 48 h were placed in confocal dishes and allowed to incubate for another 12 h. Where indicated, ferroptosis inhibitors were added at seeding: liproxstatin-1 (MCE) at 1 μM (HCT116) or 10 μM (LoVo); ferrostatin-1 (MCE) at 0.1 μM (HCT116) or 1 μM (LoVo). Cells were then cultured for 12 h. Following incubation in a Mito-FerroGreen solution (5 μM, MCE) at 37 °C for 30 min, the cells underwent a PBS wash and imaged on a Leica laser confocal microscope.
Measurements of mitochondrial lipid peroxidation via MitoPerOx
MitoPerOx is a mitochondrion-targeted fluorescent probe for detecting lipid peroxidation. CRC cells transfected for 48 h were placed in confocal dishes and allowed to incubate for another 12 h. Where indicated, ferroptosis inhibitors were added at seeding: liproxstatin-1 at 1 μM (HCT116) or 10 μM (LoVo); ferrostatin-1 at 0.1 μM (HCT116) or 1 μM (LoVo). Cells were then cultured for 12 h. Following incubation in a MitoPerOx solution (100 nM, MCE) at 37 °C for 30 min, the cells underwent a PBS wash and imaged on a Leica laser confocal microscope.
Immunohistochemistry
For IHC, 4 μm paraffin sections were deparaffinized, rehydrated and subjected to heat-induced antigen retrieval. The peroxidase antiperoxidase (PAP) method was employed for the immunohistochemical staining process. Sections were blocked, then incubated overnight at 4 °C with primary antibodies (Supplementary Table 8). HRP-linked secondary antibodies were applied at ambient temperature for 30 min. Immunoreactivity was visualized with 3,3’-diaminobenzidine (DAB), counterstained with hematoxylin (3 min).
Flow cytometry
To assess INHBA-driven M2 macrophage polarization, we cocultured CM with PMA-differentiated (100 ng/ml, 24 h) THP-1 cells for an additional 24 h. Alternatively, we adopted CRC cell–THP-1 transwell coculture experiments and maintained the coculture for another 24 h. Following digestion with 0.25% trypsin solution without EDTA (BasalMedia), cells were prepared as single-cell suspensions. Live cells were first labeled via the Zombie Aqua™ Fixable Viability Kit (423102, BioLegend), followed by stained with flow cytometry antibodies, which included antibodies against CD68, CD163, and CD206. Supplementary Table 9 lists the antibodies utilized in flow cytometry. The specific procedure was as follows: After surface staining with CD206 and CD163, cellular samples underwent fixation and permeabilization using the Cytofix/Cytoperm™ Fixation/Permeabilization Kit (554714, BD Biosciences) adhering to the manufacturer’s protocol. Following intracellular CD68 staining, M2-type macrophages were gated as CD68⁺CD206⁺ or CD68⁺CD163⁺ populations.
To quantify phagocytosis after INHBA-driven M2 polarization, THP-1 monocytes were differentiated with PMA (100 ng/ml, 24 h). Macrophages were incubated for 24 h with CM from CRC cells engineered to overexpress or knock down INHBA. After 2 h of serum starvation, the macrophages were cocultured with untransfected CRC cells at a 5:1 effector-target ratio for 4 h. Prior to coculture, the tumor cells were labeled with CFDA-SE (Beyotime Biotechnology), and the macrophages were labeled with PKH26 (Solarbio®). Finally, the percentage of PKH26⁺CFDA-SE⁺ macrophages was determined via flow cytometry to assess phagocytic activity.
For flow cytometry of tissue samples, we minced and homogenized the tumor tissues and then filtered them via a 70 μm strainer for single-cell isolation. First, we blocked the samples with purified rat anti-mouse CD16/CD32 (553141, BD Biosciences). Next, Zombie Aqua™ Fixable Viability Kit (423102, BioLegend) incubated with cells for 15 min at ambient conditions to label live cells. Following PBS washing, the cells underwent centrifugation at 400 × g for 5 min to eliminate free dye. The samples were subsequently stained with flow cytometry antibodies, which included antibodies against CD45, F4/80, CD11b, CD163, and CD206 (Supplementary Table 9). Following a 30-minute antibody incubation at ambient temperature, the cells underwent washing in PBS and were subjected to centrifugation at 400 × g for 5 min to eliminate free antibodies. Erythrocytes were depleted by treating the single-cell suspension with red blood cell lysis buffer. After washing and centrifugation, samples were acquired on a BD FACSAria III flow cytometer with data analysis performed through FlowJo software (Tree Star, USA).
High-performance liquid chromatography
To assess MDA levels, CRC cells underwent transfection with INHBA overexpression or knockdown vectors. Post-48-h transfection, the samples were harvested, transported on dry ice to Shanghai Best Choice Biotechnology Co., Ltd., and analyzed on an Agilent 1200 HPLC system equipped with a VWD detector set at 310 nm.
Clinical specimens
Following ethics committee approval from Shanghai Outdo Biotech Co., Ltd, a tissue microarray containing 96 colon cancer specimens (diagnosed 2004–2009) was constructed. Clinical and pathological data were retrieved from surgical pathology and medical records. Histological typing adhered to the WHO’s classification standards, and staging was referenced from the latest edition of the American Joint Committee on Cancer (AJCC) guidelines, specifically the 8th version.
Two independent pathologists, blinded to clinical results, evaluated INHBA expression by semi-quantitative immunohistochemistry. Staining intensity was scored as 0 (negative), 1 (weak), 2 (moderate), or 3 (strong); the positive tumor cell proportion was scored as 0 ( ≤ 5%), 1 (6–25%), 2 (26–50%), 3 (51–75%), or 4 ( > 75%). The final H-score (intensity × proportion) ranged from 0 to 12. ROC curve analysis identified an H-score ≥8 as the optimal cutoff for high INHBA expression. Kaplan–Meier analysis and log-rank test were used to assess the association between INHBA expression and OS.
Additionally, to determine SLC25A10 expression in colon cancer tissues, ethics approval was obtained from the Hunan Cancer Hospital Ethics Committee. Thirty patients pathologically diagnosed with colon cancer between 2023 and 2025 were enrolled.
Animal experiments
Six-week-old female C57BL/6 mice obtained from the Experimental Animal Center at the Xiangya School of Medicine Affiliated Tumor Hospital, Central South University (Changsha, China) were maintained under a specific pathogen-free (SPF) conditions. Following 1-week acclimatization, exponentially growing transfected MC38 cells were resuspended at 1 × 10⁷ cells/mL in PBS, and mice received a subcutaneous injection of 1 × 10⁶ cells into the left forelimb’s upper area. From day 5 post-inoculation, tumor size was measured every 5 days and volume calculated as (length × width²)/2. On day 20, the mice were euthanized and tumors were excised, photographed, and weighed.
For the animal experiments involving INHBA knockdown with succinate supplementation, we initiated intraperitoneal injections of succinate (20 mg/kg; Sigma, Germany) every 5 days, starting from day 5 after the subcutaneous injection of MC38 cells. On day 20, mice were euthanized and tumors excised.
Statistical analysis
Statistical analysis and graphs were generated with GraphPad Prism. Two-group comparisons were performed using Student’s t test; multiple groups were analyzed by one-way ANOVA. Data are presented as mean ± standard deviations.