
Patient samples
The study was performed in accordance with the Declaration of Helsinki. Written informed consent was obtained from all participants. Patients undergoing surgery of a histologically proven lung tumour at Charité – Universitätsmedizin Berlin were consecutively recruited without preselection. Given the consecutive recruitment and exploratory nature of the study, no systematic selection bias is expected. The study was approved by the Ethics Committee of the Charité (EA2/274/20). Cross-sectional slices of tumour tissue were obtained by a pathologist, along with macroscopically inconspicuous HT taken as far as possible from the tumour site. Transport of tissue and blood was performed on ice in HBSS (Gibco, 14175053), supplemented with penicillin–streptomycin (100 U ml−1 and 100 µg ml−1; Gibco, 15140-122). Samples were either directly processed for organoid culture or frozen. Tissue was washed in Dulbecco’s modified Eagle medium (Gibco, 41966-029) containing 5% foetal calf serum (FCS; Sigma, F7524), penicillin–streptomycin, 10 mM HEPES (Gibco, 15630049) and Amphotericin B (2.5 µg ml−1; Bio&Sell BS.A 2612 or Gibco 15290026), cut into pieces and snap-frozen in liquid nitrogen. For cryopreservation of viable cells, 500 µl FCS per 500 mg tissue and 500 µl 2× freezing medium (80% FCS, 20% dimethyl sulfoxide; AppliChem A3672,0100) were added; samples were slowly cooled to –80 °C and transferred to liquid nitrogen. Peripheral blood for CAR T cell generation was obtained from healthy humans (Ethics Committee of the Charité approval EA4/091/19).
Organoid culture
Organoid cultures were established from primary human lung tumour or heathy tissue. Donor sex and relevant clinical information are provided in Supplementary Table 1. If immediately processed, the healthy or tumour specimen was covered in wash buffer in a Petri dish and mechanically dissociated into small fragments using a sterile blade and forceps. If organoid culture was initiated from frozen specimens, the tissue was rapidly thawed, transferred into a 50-ml Falcon tube containing 20 ml wash buffer and centrifuged at 400g for 3 min at 4 °C. Tumour tissue was dissociated in 5 ml DNase medium (wash buffer supplemented with 50 µg ml−1 DNase I (Roche, 101041599001) and 10 µM ROCK inhibitor (Selleckchem, S1049)) per 1 mg of tissue using a gentleMACS dissociator (Miltenyi Biotec). Lung tissue was digested in 5 ml digestion medium (wash buffer, 1 mg ml−1 Collagenase D (Roche, 11088858001), 100 µg ml−1 DNAse I, 5 U ml−1 Dispase and 10 µM ROCK inhibitor) per 1 mg tissue using a gentleMACS dissociator. Tumour tissue was pressed through a 100-µm pluriStainer (pluriSelect). Lung tissue was pushed carefully through the 100-µm pluriStainer. This was repeated using a 70-µm pluriStainer (pluriSelect). If necessary, tissue incubated with 5 ml RBC lysis buffer (Thermo Fisher, 00-4333-57) and washed between the filtering steps. After centrifuging 400g for 5 min at 4 °C, the cell pellet was resuspended in 5 ml wash buffer. For debris-rich tumour samples, the Dead Cell Removal Kit (130-090-101, Miltenyi Biotec) was applied. Cells were counted using a Neubauer chamber. Cells were seeded at 5000 cells µl−1 Geltrex (Thermo Fisher, A1413202). Domes (20 µl or 50 µl Geltrex) were seeded in preheated 48-well plates (Greiner, 677102) or 24-well plates (TPP, 92424), respectively. After incubation for 30 min at 37 °C, organoid medium was added (200 µl per 48-well or 500 µl per 24-well). Basal medium contained Advanced Dulbecco’s modified Eagle medium/F-12 (Thermo Fisher, 12634010), 100 units ml−1 penicillin and 100 µg ml−1 streptomycin (Gibco, 15140-122), 2.5 µg ml−1 Amphotericin B, 10 mM, 1% HEPES, 1× B27 (Thermo Fisher, 17504044), 10 mM nicotinamide (Sigma, N0636,), 1 mM N-acetyl-L-cysteine (Sigma, A9165) and 1 µM A83-01 (Tocris, 2939). GlutaMAX (8 mM for TO medium, 2 mM for HO medium; Gibco, 35050061) and SB202190 (1 µM for TO medium, 0.5 µM for HO medium; Cayman Chemical, 10010399), EGF (50 ng ml−1, only at initiation for HOs; Sigma, E9644) were added. In addition, medium formulations comprised 25 ng ml−1 FGF7 (PeproTech, 100-19), 100 ng ml−1 FGF10 (PeproTech, 100-26), 10% RSPO1-conditioned medium (CM) and 100 ng ml−1 Noggin (PeproTech, 120-10C) (only HOs); or 25 ng ml−1 FGF7, 100 ng ml−1 FGF10, 50% WNT, RSPO1, Noggin (WRN) CM. If indicated, 3 µM CHIR99021 (Sigma, SML1046) was added. FGF2-containing medium included basal medium + 20 ng ml−1 FGF2 (PeproTech, 100-18B) and 50% WRN CM. In all media, 10 µM ROCK Inhibitor was added for culture initiation or passaging. WRN CM was derived from L-WRN cells as described previously42. RSPO1 CM was derived from Cultrex HA-R-Spondin1-Fc-293T Cells (R&D, 3710-001-01). Cells were cultured at 37 °C in a humidified incubator with 5% CO2. Medium was changed every 3–4 days with daily microscopy. The organoids were detached when they occupied more than 75% of the organoid–Geltrex dome. Domes were washed with Dulbecco’s phosphate-buffered saline (DPBS), incubated in TrypLE Express (Gibco, 126013; 10 min, 37 °C), washed with cold DPBS, centrifuged, resuspended in Geltrex, reseeded, polymerized 30 min at 37 °C and overlaid with medium. Splitting ratios ranged from 1:1.5 to 1:4.
DNA sequencing and DNA methylation assay
DNA from fresh and frozen healthy and tumour tissue and organoid cells was extracted with Quick-DNA Miniprep Plus Kit (Zymo Research, D4068) according to the manufacturer’s instructions. DNA purity and concentration were examined by spectrophotometry and fluorometry.
DNA sequencing
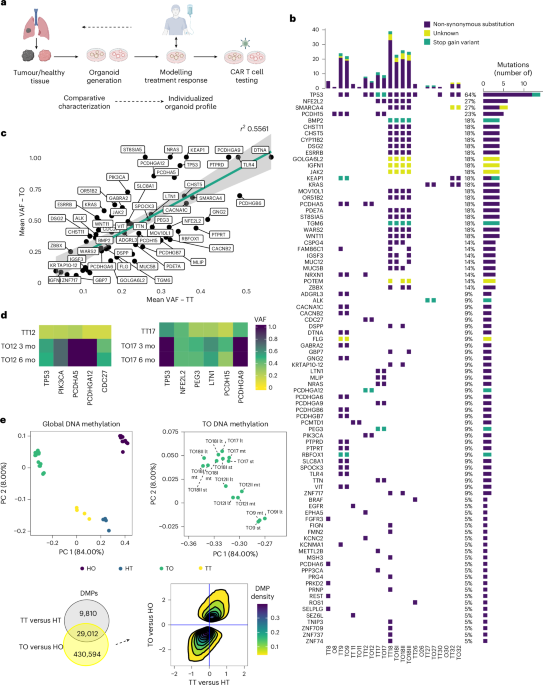
DNA fragmentation was performed enzymatically or by physical shearing for samples with DNA <14 ng µl−1. A targeted DNA sequencing panel for lung cancer-associated mutations covering 500 kb was designed (Supplementary Table 2a). Mutations were selected on the basis of abundance in the Catalogue of Somatic Mutations in Cancer (COSMIC) database. Ten single-nucleotide polymorphisms for genomic fingerprinting were added. Furthermore, a custom panel of 39 genes was also used (Supplementary Table 2b). DNA library preparation was performed using Magnis NGS Prep System (Agilent). Library concentration and quality was assessed using Fragment Analyzer 5200 (Agilent). DNA sequencing was carried out on the MiniSeq (Illumina) or NovaSeq (Illumina) platform. The targeted sequencing panel achieved 200× coverage, and WES achieved 150× coverage.
DNA methylation assay
Organoids cultured for 3 (short-term), 6 (mid-term) and 9 (long-term) months were included. DNA was subjected to bisulfite conversion using the EZ DNA Methylation-Gold Kit (Zymo Research). DNA methylation levels were analysed using the Infinium MethylationEPIC Kit (Illumina EPIC-8 BeadChip, Illumina). Imaging was performed using the iScan Microarray Scanner (Illumina).
Histology
After fixation for 24 h in 4% formaldehyde, primary tissue samples were embedded in paraffin and cut into 4-μm sections. Geltrex-embedded organoids were embedded in Histogel (Thermo Fisher, 1200667) and fixed overnight in 4% formaldehyde. Paraffin sections were deparaffinized by standard methods. Sections were stained with haematoxylin and eosin, 1% periodic acid and Schiff´s reagent. For IHC, antigen retrieval was performed in CC1 mild buffer (Ventana Medical Systems) for 30 min at 100 °C or in protease 1 for 8 min. Sections were stained for TTF1 (1:100, Zytomed), CK5/6 (1:100, Epitomics), CK7 (1:1000, Dako), p40 (Ventana Medical Systems), p63 (1:25, Leica), PDL1 (1:200, Cell Signaling), HER2 (Ventana Medical Systems), CEA (1:4000, Dako), MSLN (1:10, Thermo Fisher), MUC1 (1:100, Dako), ALK (Ventana Medical Systems), cMET (Ventana Medical Systems) and CD56 (1:50, Leica) for 60 min at room temperature and visualized using the avidin–biotin complex method and 3,3′-diaminobenzidine. IHC was performed on a BenchMark XT immunostainer (Ventana) with haematoxylin and bluing reagent counterstaining. Slides were assessed using Leica Confocal TCS SP8 microscope and Leica Application Suite X 3.5.7.23225 imaging software. Tumour content was evaluated by haematoxylin and eosin staining (tumour cells/total cells), and cell type annotation was performed.
IHC analysis—H-score semi-quantification
Whole-slide imaging of IHC sections was performed with Axio Scan Z.1 (Zeiss). Protein expression was semi-quantitatively assessed by H-score (0–300, based on percentages of cells at four intensity levels). Image analysis used QuPath (0.6.0-rc4) with marker-specific pipelines:
TO/HO: Organoid regions were segmented by haematoxylin optical density classifier; positive cells were quantified with predefined 3,3′-diaminobenzidine thresholds (low/medium/strong, marker specific). If multiple passages were analysed, mean H-scores were reported. ALK H-scores were manually evaluated by a pathologist.
TT: Tumour regions were manually annotated, a custom classifier identified tumour cells, and H-scores were calculated with the same thresholds.
HT: Bronchial epithelial regions were manually annotated, and H-scores were calculated with the same thresholds.
LC–MS
Protein extraction from tissue and organoid samples, digestion and peptide desalting were carried out using the filter-aided sample preparation technique43. Peptides were separated by LC–MS using a C18 column (Acclaim PepMap RSLC, Thermo Fisher Scientific) and detected with a timsTOF HT flex mass spectrometer (Bruker Daltonics). Data-independent acquisition with parallel accumulation–serial fragmentation was performed: PASEF18 mode with ten PASEF MS/MS scans. Capillary voltage was set to 1,600 V, and spectra were recorded over an m/z range of 100–1,700 with an ion mobility range (1/K0) of 0.85–1.30 Vs cm−2. Collision energy was ramped linearly from 59 eV at 1/K0 = 1.6 Vs cm−2 to 20 eV at 1/K0 = 0.6 Vs cm−2. Precursors with charge state 0–5 were selected (target 20,000; intensity threshold 2500). Raw data were processed using DIA-NN (DIA-NN 1.8.2). For the library-free search, an in silico digest of 20,368 human protein entries from UniProt was used with deep-learning-based spectra, retention time and ion mobility prediction.
IL-6 immunoassay
Tissue specimens were disrupted with a BeadBlaster homogenizer (Biozym Scientific) in T-PER reagent (Thermo Scientific, 78510). IL-6 concentrations were measured in lysates by Luminex immunoassay (Merck) on a Bio-Plex 200 System (Bio-Rad). Cytokine levels were calculated from fluorescence intensity using manufacturer standards after background subtraction. Data were normalized to 0.01 g wet weight.
Cytotoxicity assay in TOs and tumour cell line controls
TOs were incubated with StemPro Accutase (Gibco, A1110501) and 50 µg ml−1 DNAse I at 37 °C until a single-cell suspension formed. After washing with DPBS, cells were seeded in a 384-well microplate (Greiner Bio-One, 781096) with 4,000 cells per well in 20 µl Geltrex. After 15 min at 37 °C, 20 µl medium supplemented with 10 µM ROCK inhibitor was added. NCI-H292 (American Type Culture Collection (ATCC) CRL-1848) and A549 (ATCC CCL-185) tumour cell lines were used as controls. Cell lines were authenticated by the vendor (ATCC) using short tandem repeat profiling, and confirmed not to appear in the International Cell Line Authentication Committee database of misidentified cell lines. They tested negative for mycoplasma and were not cultured beyond passage 30 to ensure cell identity and avoid cross-contamination. Cell lines were digested with TrypLE Express (Gibco) at 37 °C until single-cell suspensions formed and were seeded analogously. TOs and cell lines were grown for 2 days before chemotherapeutics were added in 20 µl medium containing NucRed Dead 647 (1:5 dilution; Thermo Fisher, R37113) to label live/dead cells. Viability was monitored by Opera Phenix High Content Screener (Revvity) and endpoint at day 5 measured by CellTiter-Glo Assay (Promega, G7571) according to the manufacturer’s protocol. The luminescence was measured with SpectraMax iD5 (Molecular Devices).
Modular CAR library
A pUC19 vector encoding a CD19-28z CAR (Addgene, #183473) homology-directed repair template (HDRT) with homology arms targeting the TRAC locus was used31. The plasmid was linearized by PCR excising the scFv region using flanking primers and incubated for 15 min at 50 °C with the new scFv gene block (Integrated DNA Technologies, IDT) at 1:3 ratio in In-Fusion cloning mix (Takara). Two microlitres of the reaction were transformed into Stellar Competent Escherichia coli and positively selected by ampicillin Luria-Bertani agar plates. Plasmids were purified with ZymoPURE Miniprep Kit (Zymo Research) and validated by Sanger sequencing (LGC Genomics). CAR HDRTs were PCR-amplified as previously described31. CAR sequences are listed in Supplementary Table 8.
CAR T cell generation
Peripheral blood mononuclear cells were isolated using standard density gradient centrifugation. Purified peripheral blood mononuclear cells were positively enriched for CD3+ T lymphocytes using anti-CD3 magnetic microbeads (CD3 MACS, Miltenyi Biotec). Enriched T cells were activated for 48 h in cytotoxic T lymphocyte medium (Advanced RPMI and Clicks Medium mixed at 1:1) supplemented with 10% FCS, 1% GlutaMAX (Gibco), IL-7 (10 ng ml−1, 1410-050 CellGenix) and IL-15 (10 ng ml−1, 1413-050 CellGenix) in a 24-well plate precoated with 1 µg ml−1 CD28 (302934, BioLegend) and 1 µg ml−1 CD3 (16-0037-85, Invitrogen). After 48 h, T cells were collected, centrifuged (10 min, 350g, room temperature), washed once with MaxCyte buffer and resuspended at 200 × 106 cells ml−1. Ribonucleoprotein complexes (RNPs) were produced by mixing sgRNA and Cas9 in the presence of polyglutamic acid (Sigma-Aldrich). Polyglutamic acid (0.33 μl, 100 μg μl−1 stock) was mixed with TRAC-targeting sgRNA (5′ GGGAATCAAAATCGGTGAAT 3′; 0.32 μl, 100 μM stock, IDT) and Alt-R S.p. Cas9 Nuclease V3 (0.267 μl, 10 μg μl−1 stock, IDT) was added (sgRNA:Cas9 molar ratio 2:1). The RNP mixtures were incubated at 37 °C for 15 min and used for electroporation. RNP and HDRTs (at a final concentration of 35 nM) were mixed and combined with 20 µl of cell suspension, transferred to MaxCyte OC-25×3 processing assemblies and electroporated with pulse code ‘Expanded T cell 4-2’ in the MaxCyte GTx (Maxcyte). After electroporation, cells were allowed to rest, the medium was exchanged, and the cells were subsequently cultured and expanded. Once expansion reached day 12 post isolation, CAR T cells were purified by MycTag staining (AF647 antibody, Cell Signaling, 2233; 30 min, 4 °C, dark) and enriched with anti-AF647 magnetic microbeads per the manufacturer’s instructions (Miltenyi Biotec, 130-091-395). Enriched cells were cultured at 1.5 × 10⁶ cells ml−1, allowed to rest for 2 days and then used for assays.
Flow cytometry analysis
All antibodies used were manufactured by BioLegend, unless stated otherwise, and titrated beforehand. Flow cytometry data were acquired on a Cytoflex LX (Beckman Coulter) and analysed with FlowJo v.10.8.0 (BD Biosciences).
Immunophenotyping of tissue and organoids
Lung tissue and tumour tissue processed for culture initiation or organoids and TOs after dissociation into single cells were incubated for 15 min with Human TruStain FcX (BioLegend). Cells were stained for 20 min at 4 °C in the dark using anti-human fluorophore-conjugated antibodies against PDGFRa-APC (16A1), CD45-FITC (HI30), CD31-PerCP-Cy5.5 (WM59), EpCAM-PE (9C4), CD133-PE/Cy7 (clone 7), CD166-APC/Fire750 (3A6) and CD44-BV650 (IM7). LIVE/DEAD Fixable Blue Dead Cell Stain (ThermoFisher) was used to exclude dead cells.
Knock-in efficiency
The phenotype and knock-in efficiency of CAR T cells were assessed by a mastermix of anti-human fluorophore-conjugated antibodies containing CD8-BV510 (RPA-T8), CD3-BV650 (OKT3), CCR7-AF488 (G043H7), CD4-PerCP-Cy5.5 (SK3), CD45RA-PECy7 (HI100) and MycTag-AF647 (9B11, Cell Signaling Technology). DAPI (2.5 μg ml−1) was used to exclude dead cells. Cells were collected and washed once with fluorescence-activated cell sorting (FACS) buffer (phosphate-buffered saline supplemented with 0.5% bovine serum albumin and 2 mM EDTA). Centrifugation was at 350g, 5 min, 4 °C. Cells were stained with antibody mastermix in FACS buffer for 30 min at 4 °C in the dark, washed once and resuspended in 100 µl FACS buffer in 96-well U-bottom plates (Falcon) for acquisition.
CAR T cell activation and cytokine production
Bulk CAR T cells were cocultured for 12–16 h with TOs or organoids in a 96-well U-bottom plate at an E:T ratio of 1:1. Intracellular cytokine production was captured by addition of 2 μg ml−1 of Brefeldin A (Sigma-Aldrich) after 1 h of stimulation and cells were stained using antibodies and the FoxP3/Transcription Factor Staining Buffer Set (eBioscience). The following antibodies were used: CD3-BV650 (OKT3), CD4-PerCP-Cy5.5 (SK3), CD8-BV510 (RPA-T8), IFN-γ-BV605 (4S.B3), TNF-AF700 (MAb11), IL-2-PECy7 (MQ1-17H12), CD137-PE (4B4-1), CD154-BV421 (24–31), CCR7-APC-F750 (G043H7), CD45RA-PEDazzle (HI100) and Myc-Tag-AF647 (9B11, Cell Signaling). LIVE/DEAD Fixable Blue Dead Cell Stain (L/D; ThermoFisher) was used to exclude dead cells.
PDL1 and EGFRvIII quantification on organoids
Organoids and TOs were incubated with StemPro Accutase and 50 µg ml−1 DNAse I at 37 °C until single-cell suspensions formed. They were washed twice with FACS buffer and incubated for 15 min with Human TruStain FcX (BioLegend). Subsequently, the cells were stained for 15 min at 4 °C in the dark with either anti-human PD-L1-PE (29E.2A3), anti-human EGFRvIII-PE (DH8.3.Rec) or the corresponding mouse isotype controls IgG2b, κ-PE (27-35) or IgG1, κ-PE (MOPC-21). DAPI was added at 2.5 μg ml−1 before measurement. Cells were analysed with Quantibrite beads (340495, BD Biosciences) to determine molecules per cell, calculated per the manufacturer’s instructions and normalized to isotype controls.
Organoid killing assay
Single organoid cells from 7-day EGF-omitted cultures were seeded at 6,000 cells per well in 384-well flat-bottom imaging plates (781096, Greiner Bio-One) with 20 µl organoid medium and 1% Geltrex plus ROCK inhibitor (10 μM). Cells were cultured for 72 h at 37 °C, 5% CO2 until organoids formed. On the day of the assay, CAR T cells were labelled with Cell Proliferation Dye eFluor 450 (1:2,000; Thermo Fisher) and resuspended in 20 µl cytotoxic T lymphocytes medium (Advanced RPMI and Clicks Medium mixed at 1:1 supplemented with 1% GlutaMAX) with 10% FCS and NucRed Dead 647 (1:10; Thermo Fisher) to label live/dead cells. CAR T cells were added to TOs or HOs at E:T ratios of 5:1, 1:1 or 1:5. Plates were incubated for 30 min at 37 °C and imaged every 3 h for up to 30 h with an Opera Phenix High Content Screener (Revvity) with an incubation chamber (37 °C, 5% CO2) using a 10× objective. Supernatants were collected at the endpoint for cytokine analysis.
Cytokine analysis
Twenty microlitres of supernatants were collected from killing assays, transferred to 96-well U-bottom plates and centrifuged at 1,000g for 5 min. Fifteen microlitres of cleared supernatant were snap-frozen at –80 °C, thawed and analysed with the V-Plex Pro-inflammatory Panel 1 Human Kit (K15049D, MesoScaleDiscovery) for IFNγ, IL-1β, IL-2, IL-4, IL-6, IL-8, IL-10, IL-12p70, IL-13 and TNF. Measurements were performed on a MESO QuickPlex SQ 120MM with support from CheckImmune GmbH.
Statistics and reproducibility
No statistical methods were used to predetermine sample size. Sample sizes were chosen empirically on the basis of assay feasibility and consistency observed in preliminary optimization experiments. Each experiment was independently repeated at least three times with technical and biological replicates, which proved sufficient to ensure reproducibility of the findings. Blinding was not applicable, as all experiments were performed in vitro using predefined experimental conditions and quantitative readouts.
DNA sequencing
Complex heatmap (v.2.22.0), circlize (v.0.4.16) and gridExtra (v.2.3) packages in R were used to create mutation plot and heatmaps. The geom_smooth (method = ‘lm’) command in the ggplot2 (v.3.5.1) package was used to fit a linear model to mean VAF comparison between TTs and TOs. To evaluate determinants of culture success, the Mann–Whitney test and a simple logistic regression model were applied using Prism (GraphPad) v.10.2.3. A two-tailed P value was used to determine the significance level44,45.
DNA methylation data
Data were preprocessed and normalized using the minfi package (v.1.46.0) with standard filtering applied. DMPs were identified using the limma package (v.3.56.2). For visualization, donor effects were adjusted using the Combat function from the sva package (v.3.52.0)46,47,48.
Proteomics
Analyses were performed using R. Missing values were imputed using QFeatures (v.1.16.0). VennDiagram package (v.1.7.3) was used to generate Venn diagrams. Gene Ontology pathway enrichment analysis of protein lists was performed using the clusterProfiler package (v.4.14.4) in conjunction with org.Hs.eg.db (v.3.20.0) and AnnotationDbi (v.1.68.0) packages. The UpSetR package (v.1.4.0) was used for visualization. Datasets were filtered and principal component analysis (PCA) performed for dimensionality reduction. The umap package (v.0.2.10.0) was used for UMAP analysis. Ranked protein lists were subjected to pathway enrichment analysis for HO and HT conditions using the ReactomePA package (v.1.50.0). The limma (v.3.62.2) package was used to perform the differential expression analysis, and the EnhancedVolcano (v.1.24.0) package was applied for plotting. Cut-off values for differentially expressed proteins were set at a log2 fold change of ±0.5 and an adjusted P value of ≤0.005. Proteins above the log fold change threshold were retrieved, and enriched pathways were analysed using Hallmark gene sets from the Molecular Signatures Database (MSigDB) using the GSEABase (v.1.68.0) package. Pathways associated with the top 20 mutations in WES or targeted DNA sequencing data were identified using the pathway browser at https://reactome.org. Pathway enrichment analysis was performed using the Reactome GSA (v.1.20.0) package, single-sample gene set enrichment analysis (ssGSEA) was used as analysis method, interactors were used and disease pathways were included in the request49. Euclidean distance and ward.D2 linkage were applied for clustering. Autophagy-related subsets were selected using the Kyoto Encyclopedia of Genes and Genomes pathway database, and immune-evasion genes were extracted from the MSigDB by using the Msigdbr (v.7.5.1) R package (Supplementary Table 5).
H-score and IL-6 Luminex analysis
Analysis of H-scores was performed in R using readxl (v.1.4.3), dplyr_(v.1.1.4), stringr_(v.1.5.1), tibble (v.3.2.1) ComplexHeatmap (v.2.22.0) and viridis_(v.0.6.5) packages; for plotting IL-6 Luminex results, the ggplot2 (v.3.5.2) package was used.
Cytotoxicity assay
For the analysis of CellTiter-Glo, fluorescent units were normalized to the largest (100%) and smallest (0%) mean in each dataset and the 0.15625% DSMO control. Nonlinear regression (curve fit) was performed using the log (inhibitor) versus normalized response equation in Prism (GraphPad) v.10.2.3. IC50 values for each chemotherapeutic agent were normalized independently, then drug activity scores (1/IC50) were calculated and normalized to Z scores (of drug activity) for each drug dataset. Further analyses were performed using the rcellminer (v.2.28.0) package in R; drugs with multiple entries in the Cellminer database were summarized by weighting the number of experiments conducted to generate a single Z score\((\frac{({Z}_{1}\times {\mathrm{EXP}}_{1})\,+\,({Z}_{2}\times {\mathrm{EXP}}_{2})}{{\mathrm{EXP}}_{1}\,+{\mathrm{EXP}}_{2}})\). Experimental data were integrated with the Cellminer database using A549 as the reference, with appropriate scaling factors applied. Scaled Z scores were plotted together with lung cancer cell lines from the Cellminer database to identify thresholds of drug activity resistance or sensitivity50.
Imaging analysis
Imaging analysis was performed with signalsImageArtist (Revvity) following the provided building blocks (Supplementary Table 8) to identify intact organoid and subtract dead cells to quantify viable organoid area. Viable area of intact organoids was assessed over time to calculate killing percentages following the equation \(\mathrm{Killing}\,\mathrm{percentage}=100-(\frac{\mathrm{Timepoint}\,\mathrm{viable}\,\mathrm{area}}{\mathrm{Initial}\,\mathrm{viable}\,\mathrm{area}}\times 100)\). Specific killing was calculated by subtracting the positive killing percentage from an irrelevant control CAR (CD19-28z) from tested CARs (HER2-28z, PDL1-28z and EGFRvIII) at each timepoint.
Correlation and linearity analyses
We assessed the relationship between antigen expression and CAR T cell cytotoxicity using R software and the following packages: psych (v.2.5.6), corrplot (v.0.95), ggplot2 (v.3.5.2), Hmisc (v.5.2-3) and ggpubr (v.0.6.0). Data distribution was evaluated using the Shapiro–Wilk test. Spearman correlation and linear regression were performed to assess associations with two-sided P values.
Reporting summary
Further information on research design is available in the Nature Portfolio Reporting Summary linked to this article.