
Regents
LPS (ST1470-50 mg) was from Beyotime Biotechnology; MEL (A600605) was from Sangon Biotech (Shanghai) Co., Ltd; Human bladder epithelial cells were from Najing Wanmuchun Biotechnology Co., Ltd; ELISA reagents (IL-1β:KE00021, IL-6: KE00139, IL:10 KE00170, TNF-α: KE00154) were from Proteintech Group, Inc; Trizol lysis buffer (R0016) was from Beyotime Biotechnology; Real-time PCR reagent (Q321-02/03) was from Vazyme Biotech Co., Ltd; TLR4 inhibitor (CAS No.: 243984-11−4) was from Sigma-Aldrich Corporation; Transfection reagent (TL201-01) was from Vazyme Biotech Co., Ltd; THBS1-specific siRNA and THBS1-specific lentivirus were from Sangon Biotech (Shanghai) Co., Ltd. The details of all the antibodies utilized in the study are presented as follows: TLR4 (Proteintech, 66350-1-lg, RRID: AB_2881730), NF-κB p65 (Proteintech, 66535-1-Ig, RRID: AB_2881898), STAT3 (Proteintech,10253-2-AP, RRID: AB_2302876), Phospho-STAT3 (Affinity, AF3293, RRID: AB_2810278), MAPK p38 (Proteintech, 14064-1-AP, RRID: AB_2878007), Phospho-p38 (Affinity, AF4001, RRID: AB_2835330), interleukin 1β (IL-1β) (Affinity, AF5103, RRID: AB_2837589), interleukin 6 (IL-6) (Affinity, DF6087, RRID: AB_2838055), interleukin 10 (IL-10) (Affinity, DF6894, RRID: AB_2838853), tumor necrosis factor alpha (TNF-α) (Affinity, AF7014, RRID: AB_2835319), THBS1 (Affinity, DF6848, RRID: AB_2838807), HRP-conjugated Goat Anti-Mouse IgG(H + L) (Proteintech, SA00001-1, RRID: AB_2722565), HRP-conjugated Goat Anti-Rabbit IgG(H + L) (Proteintech, SA00001-2, RRID: AB_2722564). We strictly followed the requirements in the antibody manufacturers’ instructions and used the same primary antibodies for both human and rat tissue samples.
Cell culture and treatments
Human bladder epithelial cells were cultured in Ham’s F12 nutrient medium supplemented with 10% fetal bovine serum (FBS), 100 U/mL penicillin, and 100 µg/mL streptomycin, under a humidified atmosphere of 5% CO₂ at 37 °C. To explore the impact of MEL on the progression of GC, the cells underwent stimulation by LPS (0.01 g/L). After determining the optimal stimulation time, we added different concentrations of MEL and used it together with LPS to stimulate the cells.
Enzyme-linked immunosorbent assays (ELISA)
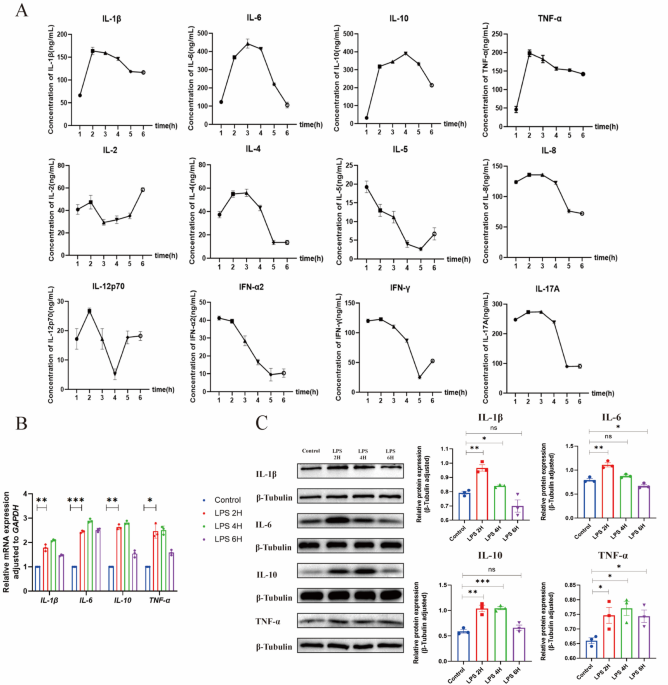
When cells reached 70–80% confluency with good morphology, they were stimulated with LPS (0.01 g/L) at 37 °C with 5% CO₂ for 2 h. After stimulation, cell supernatants were collected by centrifugation (1500 rpm, 4 °C, 5 min) and stored at −80 °C. For ELISA, standard cytokine standards were serially diluted to gradient concentrations; biotinylated antibodies and enzyme conjugates were prepared as working solutions (1:100 dilution). 100µL standards or samples (in triplicate) were added to pre-coated plates, incubated at 37 °C for 90 min, then washed 5 times. Biotinylated antibodies (100µL/well) were added and incubated for 60 min, followed by washing and addition of enzyme conjugates (100µL/well) for 30 min incubation and 6 washes. TMB substrate (100µL/well) was added for 15 min dark incubation, then reaction was stopped with 50µL stop solution. A microplate reader measured OD values at 450 nm, a standard curve was generated using OD values of gradient standards, and sample concentrations were calculated accordingly28.
Real-time PCR
Total RNA was isolated from cells/tissues using Trizol reagent, and its concentration and purity were quantified via a spectrophotometer (A260/A280 ratio 1.8–2.0.8.0). First-strand cDNA was synthesized from 1 µg of qualified total RNA using a reverse transcription kit following the manufacturer’s protocol. Gene-specific primers (sequences retrieved from NCBI Gene Bank) were used for real-time PCR, which was performed in a 20µL reaction system containing cDNA template, forward/reverse primers, and SYBR Green Master Mix. The reaction conditions were: 95 °C for 30 s, followed by 40 cycles of 95 °C for 5 s and 60 °C for 30 s, with a final melting curve analysis to confirm amplicon specificity. Relative gene expression levels were calculated using the 2−(∆∆Ct) method, with GAPDH as the internal reference gene29,30. The sequences of primers used were as follows:
Human: GAPDH: F:5′-AACTTTGGTATCGTGGAAGGACTC-3′, R:5′-CAGTAGAGGCAG.
GGATGATGTTC-3′; IL-1β: F: 5′-AATGATGGCTTATTACAGTGGCAATG-3′, R:5′-TAGTGGTG.
GTCGGAGATTCGTAG-3′; IL-6: F: 5′-CTTCGGTCCAGTTGCCTTCTC − 3′, R:5′-CAATTCGTT.
CTGAAGAGGTGAGTG-3′; IL-10: F:5′-CCGTGGAGCAGGTGAAGAATG-3′, R:5′-CATTGTC.
ATGTAGGCTTCTATGTAGTTG-3′; TNF-α: F: 5′-GAGGCCAAGCCCTGGTATG − 3′, R:5′-CG.
GGCCGATTGATCTCAGC-3′.
Rat: GAPDH: F: 5′-AGACAGCCGCATCTTCTTGT-3′, R: 5′-CTTGCCGTGGGTAGAGTC AT −3′; IL-1β: F: 5′-AGGCTTCCTTGTGCAAGTGT − 3′, R: 5′-TGAGTGACACTGCCTTCCTG − 3′; IL-6: F: 5′-CCGGAGAGGAGACTTCACAG-3′, R: 5′-ACAGTGCATCATCGCTGTTC − 3′; IL-10: F: 5′- CCTGCTCTTACTGGCTGGAG − 3′, R: 5′-TGTCCAGCTGGTCCTTCTTT-3′; TNF-α༚F: 5′- GCCTCTTCTCATTCCTGCTT-3′, R: 5′-TGGGAACTTCTCATCCCTTTG-3′.
Western blot analysis
Cell and animal tissue lysates were prepared in RIPA lysis buffer (supplemented with 1% PMSF and protease inhibitor cocktail) and protein concentration was quantified using BCA assay. Equal amounts of proteins (30 µg per lane) were loaded onto SDS-PAGE gels for electrophoretic separation. After electrophoresis, proteins were transferred to PVDF membranes at 300 mA for 90 min. Membranes were blocked with 5% non-fat milk in TBST for 1 h at room temperature, then incubated with primary antibodies overnight at 4 °C, followed by HRP-conjugated secondary antibodies for 1 h at room temperature with TBST washes (3 × 10 min) between steps. Western blot signals were detected using ECL substrate and quantified via a calibrated exposure system31,32.
Cell transfection
Log-phase target cells in the logarithmic growth phase were seeded in 6-well plates, and upon reaching 70–80% confluency, they were stimulated with LPS at a final concentration of 0.01 g/L for 2 h. After the LPS stimulation period, the cell culture medium was replaced with normal F12 medium. Two sterile EP tubes were pre-labeled as Tube A (for siRNA dilution) and Tube B (for transfection reagent dilution). Each tube was filled with 250 µL of serum- and antibiotic-free basal medium. Then, 6 µL of siRNA stock solution (20µM) was added to Tube A and 6 µL of transfection reagent to Tube B. After gentle pipetting to mix, the contents of both tubes were slowly combined and incubated at room temperature for 15–20 min to allow formation of siRNA–transfection reagent complexes. Meanwhile, the old medium in the 6-well plates was aspirated, and the cell monolayer was gently washed twice with serum-free medium. Then, 1.5 mL of complete medium containing 10% fetal bovine serum was added to each well. The transfection complexes were added dropwise to the corresponding wells, and the plates were rocked gently to ensure even distribution. The cells were cultured at 37 °C under 5% CO₂ for 6 h. Subsequently, the medium containing the transfection complexes was replaced with 2 mL of fresh complete medium. Culture was continued until 24 h post-transfection, after which cells were harvested and transfection efficiency was assessed by measuring the expression level of the target protein via Western blot33. The sequences of the siRNA are as follows:
siRNA1: F: 5′-GCGUUGGUGAUGUAACAGAAA-3′, R: 5′-UUUCUGUUACAUCACCAA CGC-3′; siRNA2: F: 5′-GAAGCAAGUCACCCAGUCCUA-3′, R: 5′- UAGGACUGGGUGACU UGCUUC-3′; siRNA3: F: 5′-CCUUGACAACAACGUGGUGAA-3′, R: 5′-UUCACCACGUUG UUGUCAAGG-3′.
Knock down of the THBS1 gene
Cells were stimulated with 0.01 g/L LPS for 2 h in a 37 °C, 5% CO₂ incubator. After the LPS stimulation period, the cell culture medium was replaced with normal F12 medium. Subsequently, 8µL of THBS1-interfering lentivirus (along with a negative control lentivirus) was added at a multiplicity of infection (MOI) of 10. To enhance transduction efficiency, 5 µg/mL polybrene was supplemented, and the cells were incubated for 24 h. After 48 h of lentiviral transduction, when cell density reached approximately 80%, the medium was replaced with fresh complete medium containing 2µL of 10 mg/mL puromycin (final concentration 2 µg/mL). Puromycin selection was performed daily for two consecutive days. The surviving cells were then passaged and expanded, and THBS1 stable knockdown cell lines were validated by Western blot analysis34,35. The sequences of the shRNA are as follows:
F:5′-CCGGGACCAAAGCCTGCAAGAAAGATCTCTTGAATCTTTCTTGCAGGCTTTG.
GTCTTTTTTG-3′, R:5′-AATTCAAAAAAGACCAAAGCCTGCAAGAAAGATTCAAGAGAT.
CTTTCTTGCAGGCTTTGGTC-3′.
Animals
The animal experiments conducted within this study were granted official approval by the Ethics Committee as well as the Animal Experiment Committee of Jiangsu University. We used female Sprague-Dawley (SD) rats, precisely aged 8 weeks and weighing within the range of 150 to 200 g. Rats were anesthetized by an intraperitoneal injection of 2% sodium pentobarbital (5 mg/100 g body weight). The bladder was catheterized with a 1 mm epidural catheter to drain the urine, followed by instillation with LPS. Eight weeks later, the bladder tissues were collected, and the rats were euthanized by an overdose of 2% sodium pentobarbital (15 mg/100 g body weight) administered intraperitoneally.
We adopted the method of bladder perfusion with LPS to induce the GC model in rats and used hematoxylin and eosin (HE) staining for histological and morphological analyses.
The first step: Twenty rats were randomly and evenly partitioned into 4 distinct groups (5 rats/group). Group 1: bladder perfusion with 300µL of PBS; Group 2: bladder perfusion with 300µL of LPS (0. 5 mg/ml); Group 3: bladder perfusion with 300µL of LPS (0.75 mg/ml); Group 4: bladder perfusion with 300µL of LPS (1 mg/ml). After maintaining the LPS in the bladder for a 30-minute contact period, the bladder was gently emptied via transurethral catheterization to terminate the stimulation. The perfusion process was meticulously executed once every three days, maintaining a consistent frequency throughout a consecutive 8-week period.
The second step: Fifteen rats were randomly and evenly partitioned into 3 distinct groups (5 rats/group). The control group: Bladder perfusion with 300µL of PBS; the LPS-treated group: Bladder perfusion with 300µL of LPS for 8 weeks; the LPS + MEL-treated group: Bladder perfusion was carried out using 300µL of LPS. After a continuous 4-week period of LPS perfusion, MEL at a dosage of 10 mg/kg/d, which was dissolved in 1% ethanol, was administered via intraperitoneal injection on a daily basis for another successive 4 weeks. Similarly, after maintaining the LPS in the bladder for a 30-minute contact period, the bladder was gently emptied via transurethral catheterization to terminate the stimulation.
Mass spectrometry analysis
Sample preparation
When the adherent cell confluency reaches 80% or higher, rinse the cell culture dish with PBS. After that, add trypsin digestion solution and place the cell culture dish in an incubator for digestion. Subsequently, aspirate the cell suspension into a sterile centrifuge tube. Set the centrifuge speed to 2000 rpm and the centrifugation time to 5 min. After centrifugation, remove the supernatant, leaving only the cell pellet at the bottom of the centrifuge tube.
Sodium dodecyl sulfate polyacrylamide gel electrophoresis (SDS-PAGE)
Using a pipette, carefully load an appropriate amount of protein sample into the wells of the gel, avoiding introduction of bubbles. Simultaneously, load protein molecular weight standards into one well as a reference. Set the initial voltage to 80 V. Once the samples have entered the stacking gel, increase the voltage to 120 V and continue electrophoresis until the bromophenol blue tracking dye reaches the bottom edge of the gel. Then, terminate the electrophoresis process. The entire procedure takes approximately 2 h. Subsequent steps: Following electrophoresis, carefully remove the gel and immerse it in Coomassie Brilliant Blue staining solution. Shake gently on an orbital shaker for 2 h to ensure complete staining of the protein bands. After staining, discard the staining solution and add decolorizing solution. Decolorize with continuous gentle shaking, changing the decolorizing solution periodically until the background becomes clear and protein bands are distinctly visible. Finally, capture an image of the gel using a gel imaging system and analyze the position and intensity of the protein bands to obtain information such as molecular weight and expression levels of the target proteins.
Filter aided sample preparation (FASP)
Transfer an appropriate amount of protein sample (50–200 µg) to an ultrafiltration centrifuge tube. Centrifuge at 15,000 × g for 20 min at 4 °C to retain the protein on the filter membrane and remove low-molecular-weight impurities. Add a suitable volume of buffer, mix gently by pipetting or swirling, and centrifuge again at 15,000 × g for 20 min at 4 °C. Repeat this washing step twice to ensure complete denaturation of the proteins. Next, add an appropriate amount of iodoacetamide solution and incubate the tube at room temperature in the dark for 30 min to facilitate alkylation of cysteine residues. Following alkylation, centrifuge at 15,000 × g for 20 min at 4 °C to remove excess iodoacetamide. Add buffer and centrifuge again under the same conditions; repeat this step twice to eliminate residual SDS and iodoacetamide. Then, add ammonium bicarbonate solution and centrifuge at 15,000 × g for 20 min at 4 °C. Repeat this buffer exchange step three times to ensure the solution surrounding the filter membrane is replaced with 50 mM ammonium bicarbonate. Add trypsin solution at a protein-to-enzyme ratio of 100:1, and incubate at 37 °C for 18 h to allow complete digestion of the protein into peptides. After digestion, centrifuge at 15,000 × g for 20 min at 4 °C and collect the filtrate containing the digested peptides into a new centrifuge tube. To recover any residual peptides, add 50 µL of 50 mM ammonium bicarbonate solution to the ultrafiltration unit, centrifuge again under the same conditions, and combine this eluate with the previously collected peptide solution.
Statistical evaluation
The task of statistical evaluation was executed with great meticulousness using GraphPad Prism 9.0. All experiments were replicated a minimum of three independent times. Prior to statistical analysis, the normality of the data was verified using the Shapiro-Wilk test. For comparisons involving two groups: if the data were normally distributed, results were presented as mean ± standard deviation (mean ± SD) and analyzed using an unpaired Student’s t-test; if non-normally distributed, the Mann-Whitney U test (non-parametric alternative) was applied. For comparisons involving three or more groups: normally distributed data were systematically presented as mean ± SD, analyzed by one-way analysis of variance (ANOVA), followed by Tukey’s post hoc test for multiple comparisons; non-normally distributed data were analyzed using the Kruskal-Wallis test, with Dunn’s post hoc test for pairwise comparisons. The p values were distinctly labeled following a standardized notation: *p < 0.05, denoting a moderate level of significance; **p < 0.01, highlighting a more pronounced significance; and ***p < 0.001, signifying an extremely high level of significance.
Ethics declaration
The animal experiment reports in this study adhere to the ARRIVE guidelines to ensure the transparency, integrity, and reproducibility of the experimental procedures and results. We confirm that all experimental methods were carried out in accordance with the specific relevant guidelines and regulations. Throughout the entire experimental process, we strictly abided by the ethical norms of animal experiments and were committed to safeguarding animal welfare.