
Proinflammatory pathways are persistently upregulated in LC
We evaluated samples from 142 participants who were enrolled in an observational cohort of the Massachusetts Consortium for Pathogen Readiness (MassCPR) and Beth Israel Deaconess Medical Center (BIDMC) in Boston between April 2020 and October 2021 (hereafter the 2020–2021 cohort). This cohort included UCs (uninfected; n = 35), acutely infected individuals less than 30 days after COVID-19 infection (acute; n = 54), CCs (n = 24) and patients with LC (n = 28) (Table 1 and Supplementary Table 1). Clinical symptoms in the LC group included primarily shortness of breath, brain fog, fatigue, pain, cough and abnormal smell and taste (Fig. 1a), which is consistent with prior reports9,16,23,30,35,36,37,38,39,40. Peripheral blood mononuclear cells (PBMCs) were collected during the acute phase (<30 days) (LC: n = 6; CC: n = 5), 90–180 days (LC: n = 26; CC: n = 21) and more than 180 days (LC: n = 21; CC: n = 5) after SARS-CoV-2 infection. Plasma samples were also collected during the acute phase (LC: n = 8; CC: n = 4), 90–180 days (LC: n = 22; CC: n = 8) and more than 180 days (LC: n = 19; CC: n = 6) after SARS-CoV-2 infection. We performed immunological and virological assays, bulk RNA sequencing (RNA-seq) and plasma proteomics.

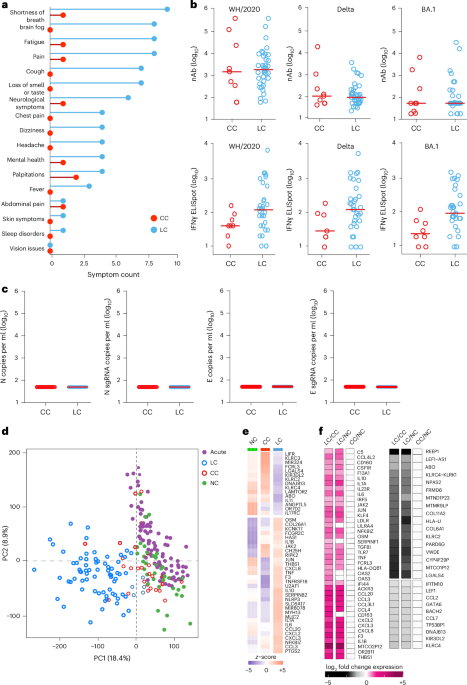
a, Symptom prevalence in individuals with LC (n = 28) and individuals who recovered (CCs, n = 24) in the 2020–2021 cohort. b, log10-transformed nAbs titers and IFNγ (ELISpot responses against the WH/2020, Delta and BA.1 variants of SARS-CoV-2) in CC (n = 9) and LC (n = 41) individuals on day 90–180 after infection. The dots are individual participants and the red bars are group medians. Samples from several time points were assessed for participants with LC. c, Quantification of SARS-CoV-2 genomic (N, E) and subgenomic (N single-guide RNA (sgRNA), E sgRNA) RNA in CCs (n = 9) and LCs (n = 41). Medians (red bars) are shown for each group. Samples from several time points were assessed for participants with LC. d, K-mean clustering across acute COVID-19 (n = 54), LCs (n = 28), CCs (n = 24) and uninfected (NC) (n = 35) individuals. All available samples were included in the k-mean analysis for the LC and CC groups. e, Heatmap of top significant (Padj < 0.05) proinflammatory genes upregulated (red) or downregulated (blue) in LCs compared to CCs or NCs at day 90–180 after SARS-CoV-2 infection. f, Transformed log2 fold change expression of the top upregulated (pink) and downregulated (dark) genes in LCs compared to CCs and NCs (Padj < 0.05).
Assessment of SARS-CoV-2 neutralizing antibody (nAb) responses using luciferase (LUC)-based pseudovirus neutralization assays and T cell responses using pooled peptide interferon-γ (IFNγ) enzyme-linked immunospot (ELISpot) assays against SARS-CoV-2 WA1/2020, Delta and Omicron BA.1 in the CC and the LC groups did not detect differences in SARS-CoV-2 nAb titers and identified a trend toward higher Spike-specific IFNγ ELISpot responses in the LC compared with the CC group (Fig. 1b and Extended Data Fig. 1a–c). We did not detect plasma SARS-CoV-2 viral loads in any CCs or individuals with LC using PCR with reverse transcription genomic or subgenomic viral load assays (Fig. 1c).
Bulk RNA-seq in PBMCs from individuals with LC (n = 26) and CCs (n = 21) at day 90–180 and in uninfected (n = 35) and acute (n = 54) individuals identified reads that mapped to the human genome and multiple common viruses (SARS-CoV-2, varicella zoster virus, Western equine encephalitis virus, Epstein–Barr virus, human cytomegalovirus, herpes simplex virus 1 and 2, influenza virus, rotavirus). We did not detect significant differences in viral read counts for these common viruses in the LC compared with the CC group (Extended Data Fig. 1d). Unsupervised clustering of bulk RNA-seq transcriptomic data revealed a distinct stratification between the LC group and the other cohorts, whereas the CC group clustered with the UCs (Fig. 1d). Differential bulk RNA-seq gene expression analysis in PBMCs across these groups showed upregulation of multiple proinflammatory markers in the LC compared with the CC group and uninfected individuals, including chemokines and cytokines (CXCL2, CXCL3, CCL3, IL10, IFNG, IL6, TNF, IL1B, IL1A, NFKBIZ), the NLRP3 inflammasome and the complement and coagulation genes C5, F3 and THBS1 (Fig. 1e,f). In contrast, downregulation of activating (for example, KLRC2) and inhibitory (for example, KLRC1, KIR3DL2) natural killer (NK) cell receptors and T cell activation markers in the LC compared to the CC group was observed (Fig. 1f).
Analysis of differentially expressed genes in the LC group compared with the CC group at day 90–180 after infection identified an increase of multiple proinflammatory markers, such as IL6, NLRP3, TNF, JAK2, CSF2, IL1B and IL10, in the LC compared with the CC group (Fig. 2a). Pathway enrichment analysis revealed upregulation of signatures associated with signaling by proinflammatory cytokines such as IL-6, IFNα, IFNβ and IFNγ, JAK-STAT pathways, complement and coagulation cascade, metabolic pathways and immune cell signatures of monocytes, macrophages, neutrophils and dendritic cells (Fig. 2b), while RNA processing and nitrogen metabolism, oxidative stress and amino acid transport, were decreased in the LC compared with the CC group (Fig. 2b). Additionally, transcriptomic signatures of T cell activation and differentiation (CD28, ICOS, TCF7) were downregulated in the LC compared with the CC group at day 90–180 after infection (Fig. 2b), while CD8+ T cell exhaustion signatures and programmed cell death protein 1 (PDCD1) signaling-associated genes (IFI44, PRDM1, NR4A3, NFKBIA, MAFF) were significantly increased in the LC group (Fig. 2c), suggesting a potential role of T cell dysregulation in the pathogenesis of LC. Moreover, JAK1, JAK-STAT and IL-6 signaling pathways correlated inversely with T cell activation and positively with CD8+ T cell exhaustion and PD-1 signaling (Extended Data Fig. 2a). Signatures of T cell activation and differentiation were positively correlated with IFNγ ELISpot responses, whereas proinflammatory signaling and immune exhaustion signatures were negatively correlated with IFNγ ELISpot responses (Extended Data Fig. 2b). We observed a significant correlation between IL-6 and JAK-STAT signaling pathways with complement and coagulation pathways, metabolic signatures and PD-1 signaling in the LC group (Fig. 2d), suggesting a potentially coordinated role of these pathways in the pathogenesis of LC, while the IL-6 and JAK-STAT signaling pathways correlated negatively with the metabolism of amino acids and oxidative stress in the LC group (Fig. 2d). IFNγ, IL-6, JAK-STAT and T cell exhaustion pathways correlated with clinical symptoms in the group with LC, including fatigue, shortness of breath and cognitive complaints (Fig. 2e).

a, Scatter plot of the upregulated (red) or downregulated (blue) genes in the LC group (n = 26) compared with the CC (n = 21) group at day 90–180 after infection. b, Dot plots of the pathway normalized enrichment scores (NES) in LC compared with CC at day 90–180 after infection. The dot size illustrates the normalized enrichment scores. The color gradients reflect the GSEA (FDR) q > 0.05. c, Heatmaps of the normalized z-score gene expression of the top markers in the LC and CC group level for pathways of T cell activation, T cell differentiation and CD8+ T cell exhaustion. d, Correlation of the IL-6-JAK-STAT3 signaling pathways with pathways upregulated or downregulated in the LC group. The red and blue lines indicate linear regression. The gray shading represents the 95% confidence interval (CI). P values are indicated. e, Heatmap of Spearman correlations between clinical symptoms and pathway activity levels in the LC group at day 90–180 after infection.
To investigate the timing of the chronic inflammatory pathways in the LC group in finer detail, we performed gene set enrichment analysis (GSEA) using blood samples collected at less than 30 days (LC, n = 6; CC, n = 5), day 30–100 (LC, n = 7; CC, n = 4), day 100–200 (LC, n = 22; CC, n = 5) and day 200–300 (LC, n = 22; CC, n = 6) after infection from individuals with LC and CCs. We observed upregulation of proinflammatory pathways associated with IL-1, IL-6, JAK-STAT, IFN signaling, cell cycle, metabolic pathways, complement activation and T cell exhaustion pathways in the LC group by day 30, with increased and sustained effects for over 200 days (Extended Data Fig. 3). Pathways associated with IL-6, JAK-STAT and JAK1 signaling were upregulated at both day 90–180 (Fig. 3a) and more than 180 days (Fig. 3b) in the LC group compared to the CC group, as highlighted by the persistent increase of several leading genes in the pathways, including IL6R, IL6, IL1R, CD14, CSF1, CSF3RLEPR, IL4R, STAT1, STAT3 and JAK2 (Fig. 3a,b). Weighted gene correlation network analysis revealed that individual markers of the JAK-STAT and IL-6 signaling pathways, including IL6R, AKT1, JAK2, IL1B, IFNGR1 and IFNGR2 and CD14 were highly correlated and positively associated with the subsequent development of LC (Fig. 3c).

a,b, Upregulated IL-6, IL-6-JAK-STAT3, JAK-STAT and JAK1 signaling pathways at day 90–180 (a) and more than 180 days (b) after SARS-CoV-2 infection in the LC group compared with the CC group. The top genes driving the enrichment of each pathway are shown in the red circles. The x axis represents each gene’s rank in the gene list, while the y axis shows the corresponding gene rank metric score. c, Gene interaction network analysis showing the top leading genes for the IL-6 and JAK-STAT signaling pathways. The edges represent the Spearman correlation between genes (P < 0.05). Hub genes with a high number of correlated genes are represented by larger circles.
We also performed proteomics analysis on plasma from the LC (n = 22) and CC (n = 8) groups at day 90–180 (Fig. 4a and Supplementary Table 2). We observed increased levels of plasma cytokine signaling, including JAK-STAT (STAT5, STAT1, IL6ST, SOS1, RELB), IL-6, NF-κB signaling, complement and coagulation cascades (TMPRSS6, F8, C9, C1S, F9, C6, C1R, FN1), metabolic pathways (PTPN11, LEPR, PTEN, EIF4E) and corticotropin-releasing hormone and leptin signaling (TCF4, PRKCA, PRKCB, PLCG1) in the LC group compared to the CC group at day 90–180 after infection (Fig. 4a), while DNA damage repair (RAD51C, RAD51D, HUS1, MSH2, RPA2, PARP1, YY1, CETN2), cytotoxic T cell (DFFA, BCL2, FADD, B2M, CD3G, HLA-E, CD247, HLA-G, BID), telomere maintenance (PCNA, PRIM1, TEN1, RUVBL1, RPA2) and amino acid metabolism (GNMT, PDHB, DLD, AMT, PDHA2, BHMT2, GOT1, MRI1, GOT2, MTAP, CTH) were decreased in the LC group compared to the CC group at day 90–180 after infection (Fig. 4a). Furthermore, the plasma JAK-STAT signaling pathways by proteomics correlated positively with plasma proinflammatory signatures such as the NF-κB signaling pathway, complement activation, leptin signaling and corticotropin-releasing hormone signaling, and correlated negatively with plasma DNA damage repair, cytotoxic T cell and granzyme B signaling in the LC group (Fig. 4b,c). These data indicated that LC is associated with chronic inflammation, as well as immunological and metabolic dysregulation.

a, Dot plots representing pathway NES scores (GSEA, nominal P < 0.05) in LC (n = 22) versus CC (n = 8) at day 90–180 after infection. Upregulated pathways are shown in red gradient and downregulated pathways are shown in blue gradient. Color gradients reflect a GSEA P < 0.0.5. b, Correlation of JAK-STAT signaling and selected pathways from a. Each point represents the per-patient single-sample GSEA (ssGSEA) enrichment score for the two indicated pathways. The lines show the ordinary least-squares fit with shaded 95% CIs. The Spearman correlation linear model R2 and two-sided P values are annotated. The red and blue fits indicate positive and negative slopes. c, Pathway Spearman correlation matrix between pathways upregulated or downregulated in the LC group compared with the CC group at 90–180 days after SARS-CoV-2 infection. The circle color encodes the sign of the Spearman correlation coefficient ρ (red, positive; blue, negative) and circle size encodes |ρ | ; nonsignificant correlations (P > 0.05) are shown as empty squares.
Inflammation during acute infection predicts the development of LC
To evaluate whether activation of proinflammatory pathways during acute COVID-19 infection correlated with the subsequent development of LC, we performed an exploratory analysis of transcriptomic and proteomic changes in the subset of participants in this cohort (LC: n = 8; CC: n = 5) who had PBMC and plasma samples both during acute COVID-19 (< 30 days) and at day 90–180 after infection. Transcriptomic profiling of PBMCs indicated that acutely infected participants who subsequently developed LC had higher levels of proinflammatory pathways such as IFNβ and IFNγ, JAK-STAT and IL-6 signaling, as well as innate immune cell signatures of monocytes neutrophils and complement and coagulation cascades (CCL3, CCL20, CD160, F13A1, F3, IL6, NR4A1, NLRP3, THBS1) during acute infection compared with acutely infected patients who fully recovered (CCs) (Extended Data Fig. 4a,b). Plasma proteomics profiling validated the significant increase of proinflammatory pathways (IL-6 signaling, complement cascade, leptin signaling pathway) during acute infection in participants who subsequently developed LC compared to those who recovered (CC) (Extended Data Fig. 4c,d).
To explore further the potential association between early activation of proinflammatory pathways during acute infection and the subsequent development of LC, we used a supervised random forest (RF) algorithm to identify key blood and plasma features during acute infection that predict the development of LC. This model revealed that gene expression and protein levels of complement activation, proinflammatory response, JAK-STAT, IL-6, IL-6-JAK-STAT3, IFNβ and IFNγ signaling pathways during acute infection were among the top predictors for the development of LC (Extended Data Fig. 4e,f). A feature importance analysis revealed upregulation of the IL-6 and JAK-STAT signaling, corticotropin-releasing hormone, IL-10 and TNF signaling pathways during the acute phase were among the top predictors for the development of LC. Together, these observations suggested that early activation of proinflammatory pathways strongly predicted LC development based on gene and protein profiling.
Proinflammatory pathways are upregulated in a validation cohort
To confirm our findings in an independent cohort with LC, we performed transcriptomics profiling of peripheral blood samples collected on days 15–700 after infection from individuals with LC (n = 18) and CCs (n = 20) who were enrolled at the BIDMC clinical site of the National Institutes of Health (NIH) RECOVER prospective clinical trial between October 2022 and December 2024 (hereafter the 2023–2024 cohort) (Table 2 and Supplementary Table 3). All study participants had standardized clinical meta-data and responded to structured symptom questionnaires41 (Extended Data Fig. 5a,b and Supplementary Table 3). Pain, neurological symptoms, brain fog, fatigue and cough were the primary symptoms that were more frequent in the LC compared with the CC groups (Fig. 5a). Transcriptomic analysis of peripheral blood in the LC (n = 10) and CC (n = 12) groups at day 90–180 after infection indicated upregulation of pathways linked to proinflammatory cytokine signaling (IL-6, IL-10 and IL-12 signaling), complement activation, proinflammatory immune cell signaling, signatures of T cell exhaustion and certain metabolic and immune regulation pathways in the LC compared with the CC group (Fig. 5b). In contrast, pathways associated with mitochondrial function, amino acid metabolism and signatures of NK cells, T cells and B cells were downregulated in the LC compared with the CC group (Fig. 5b). In line with observations from the 2020–2021 cohort, the IL-6, JAK-STAT and JAK1 signaling pathways remained persistently upregulated in the LC group both at day 90–180 and more than 180 days compared to the CC group (Extended Data Fig. 5c,d).

a, Symptom prevalence in individuals with LC (n = 18) or individuals who recovered (CC, n = 20) in the 2023–2024 cohort. b, Dot plots of NES in LC compared to CC groups at day 90–180 after SARS-CoV-2 infection. Upregulated pathways are shown in red; downregulated pathways are shown as blue gradients. Dot size indicates the NES. The color gradient indicates a GSEA FDR of q < 0.05. c,d, IL-6R plasma level measured using ELISA (c) and MSD (d) assays in LC (n = 18), CC (n = 13) and naive UCs (n = 13) at day 90–180, more than 90 days and more than 180 days after SARS-CoV-2 infection. Dots represent participants; the red horizontal bars indicate the group medians. A two-sided Kruskal–Wallis tests with post hoc pairwise comparisons using Dunn’s test with Bonferroni correction was used. Padj values are shown.
We used enzyme-linked immunosorbent assay (ELISA) and Meso Scale Discovery (MSD) assays to evaluate the plasma levels of selected proinflammatory markers at day 90–180 (LC, n = 19; CC, n = 13), more than 180 days (LC, n = 19; CC, n = 13) and UCs (n = 13) in the 2023–2024 cohort (Fig. 5c,d and Extended Data Fig. 6). Plasma levels of IL-6R were significantly elevated in the LC group compared to the CC and UC groups at day 90–180 and more than 180 days using ELISA (Fig. 5c) and MSD (Fig. 5d), suggesting a link between chronic inflammation and LC8,12,16,33.
We next combined data from the 2020–2021 and 2023–2024 cohorts and performed an RF analysis using the gene expression profiles at day 90–180 and day 180–365 after infection to define the pathways that correlated most robustly with LC compared with CC. For each time point, RF models were trained using gene sets corresponding to individual pathway modules, and performance was evaluated using receiver operating characteristic (ROC) curves and area under the curve (AUC) metrics. Pathways related to IL-6, JAK-STAT, IFNγ, proinflammatory response, antigen presentation and activation, and complement cascade were the top pathways associated with LC status at day 90–180 (Fig. 6a) and day 180–365 (Extended Data Fig. 7). Individual markers within the IL-6 and JAK-STAT signaling pathways, including JAK1, PIK3, CXCL8, BCL2L1, OSM, MAP3K8 and STAT3 were the top genes associated with LC (Fig. 6b).

a, ROC curves showing the AUC from the RF analysis of individual biological pathways at day 90–180 after infection. b, Bar plot showing the top key genes identified using the RF analysis. The genes are ranked in descending order of importance for each pathway with respect to the accuracy of the model.
Finally, in an exploratory sex-stratified analysis at day 90–180 after infection, using transcriptomic profiling in peripheral blood in the combined cohort, females with LC (n = 29) showed stronger enrichment of inflammatory pathways than females who recovered (CC, n = 14), including monocyte signatures, proinflammatory cytokine/chemokine signaling, complement and coagulation cascades, IL-6, JAK1, JAK-STAT signaling, and T cell exhaustion (Extended Data Fig. 8a). In the LC group, these pathways were generally higher in females than males (Extended Data Fig. 8b), whereas no significant sex differences were detected within the CC group (Extended Data Fig. 8c). These data demonstrate persistent activation of proinflammatory pathways in a validation LC cohort, with possibly greater inflammation in females compared with males, although these observations require confirmation in larger studies.