
CD24 is associated with genes predicting prognosis in brain tumors
Understanding CD24-tumor heterogeneity is crucial for effective biomarker targeting. We first investigated the association of CD24 with a 10-gene high-risk signature known to predict poor prognosis (FOXM1, NEK2, CCT2, ACTL6A, CCND2, ABL1, SYNCRIP, ITGB, ENAH, UMPS) and a 10-gene low-risk signature known to predict a better prognosis (ADAM22, AEBP1, DHRS2, RAC3, SHANK1, CYB5D2, IL27RA, DNAH2, ZPF3, NRXN2) in MB, GBM, and other tumors35,36,37,38,39,40,41,42,43. We hypothesized that an increased positive correlation with genes predicting poor prognosis, and an increased negative correlation with genes predicting a better prognosis should indicate an elevated expression of CD24 by tumor cells. To test this hypothesis, we also included markers we believed should identify tumor cells, as the proliferation marker MKI67 and for MB the tumor subgroup-specific genes SMO for SHH, MYC for Group3 and CDK6 for Group 444. To conduct these analyses, we utilized multiple publicly available datasets, as detailed in the Material and Methods section.
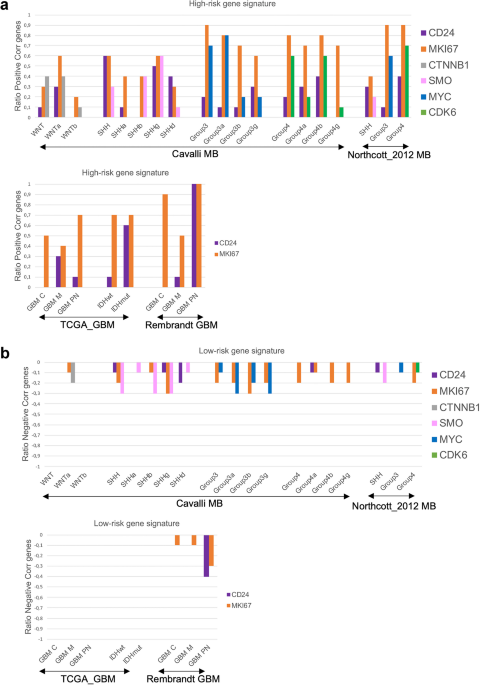
CD24 had the strongest positive correlation with the 10-gene high-risk signature in SHH and Group4 MB, with Cavalli-SHHγ and Group4ß showing the highest correlations, as well as in IDHmut and GBMPN. As expected, MKI67 showed strong positive correlations with most of the 10 selected high-risk genes, with subgroup-specific variations. For MB, subgroup specific genes also correlated to a high degree with the selected 10-gene high-risk signature (Fig. 1a). A negative correlation was detected between the 10-gene low-risk signature and MKI67 in MB and in GBM (Rembrandt), and with the MB-subgroup specific genes SMO and MYC. CD24 was negatively correlated with this signature only in SHH and in GBMPN (Rembrandt) (Fig. 1b). For detailed Spearman correlation data, see Supplementary Table S1. Single-cell RNA sequencing confirmed that CD24 is primarily expressed in the tumor cell compartment of medulloblastoma (SHH, Group 3, and Group 4) and gliomas. To a lesser extent, CD24 was also detected in various immune cell types within these tumors. MB-data were obtained from the publicly available Pediatric Neuro-oncology Cell Atlas browser, and glioma data were visualized using the UCSC Cell Browser (see Supplementary Fig. S1).
In summary, our analysis indicates that CD24 is associated with genes previously validated as poor prognostic markers in brain tumors, with differences depending on tumor type and subgroup. CD24 is predominantly expressed by tumor cells, but to a lesser extent also by immune cells—a factor that should be considered when specifically targeting CD24 in malignant brain tumors.

Association between CD24 and genes predicting prognosis in brain tumors.
For each subgroup, a Spearman correlation test was performed between CD24 and the 10-gene signatures representing (a) high-risk; FOXM1, NEK2, CCT2, ACTL6A, CCND2, ABL1, SYNCRIP, ITGB, ENAH, UMPS, or (b) low-risk; ADAM22, AEBP1, DHRS2, RAC3, SHANK1, CYB5D2*, IL27RA, DNAH2, ZPF3*, NRXN2. The number of correlated genes for CD24 was divided with 10 and the ratio was plotted in a histogram. The same was performed for MKI67 (MB, GBM, IDHwt, IDHmut) and for genes representing different MB subgroups (WNT-CTNNB1, SHH-SMO, Group3-MYC, Group4-CDK6). A Spearman r-value of 0.26–0.29 (p-value < 0.001), and 0.30 or above (p-value < 0.05) was considered a positive correlation. A Spearman r-value of −0.26-(-)0.29 (p-value < 0.001), and − 0.30 or below (p-value < 0.05) was considered a negative correlation. Multiple publicly available datasets, as detailed in the Material and Methods section was used. Genes marked with* were not available in the TCGA_GBM dataset and the ratio was calculated by division with 8.
SIGLEC-10 gene expression is correlated with microglia markers in human MB and GBM and display subgroup specific TAM-phenotypes
We next wanted to elucidate subgroup-specific differences in SIGLEC-10 expression, and the association with genes for tissue resident microglia (MG) through TREM2, P2RY12, TMEM119 and AIF1, or bone-marrow-derived macrophages (BMDM) via ITGA4. CD163, AIF1 (IBA1) and PTPRC (CD45) are expressed by both MG and BMDM. We found that SIGLEC-10 correlated with TREM2, P2RY12, AIF1, CD163, and PTPRC (CD45) in both MB and GBM. The MG-marker TMEM119 was strongly correlated with SIGLEC-10 in GBM, but not in MB, and the correlation with the BMDM marker ITGA4 was weak and only present in certain GBM subtypes. TREM2 showed a strong correlation with the MG-specific marker P2RY12 and with the shared MG/BMDM-markers AIF1 and PTPRC, but less with TMEM119. Additionally, CD163 and ITGA4 had a weaker association with MG markers in MB compared to in GBM (Fig. 2a). Analysis of single-cell RNA sequencing data from MB and glioma confirmed a similar pattern. In addition to being expressed by BMDM, ITGA4 was also associated with other immune cell types, such as T cells (Supplementary Fig. S1), which could explain its lower association with MG and TAMs.
We next investigated the expression of SIGLEC-10, TREM2 (MG), CD163 (shared between MG and BMDM), and ITGA4 (BMDM marker) in relation to different TAM phenotypes using the CIBERSORT software45 as detailed in materials and Methods. We selected 12 key genes for each cell type to represent anti-tumoral M1, and pro-tumoral M2 TAMs. Overall, our analysis revealed that SIGLEC-10, TREM2, and CD163 were more strongly associated with the M2 TAM profile than with M1 profiles. Notably, in SHH tumors SIGLEC-10 showed a higher association with the M1 profile compared to M2. When examining M1 and M2 profiles separately, SIGLEC-10 and TREM2 were more associated with anti-tumoral M1 markers than CD163 across several subgroups, including WNT, SHH, Group3, GBMM, GBMPN, and IDHmut. In contrast, SIGLEC-10 and TREM2 were more associated with the M2 profile in Group4 MB and all GBM subtypes, while CD163 showed a stronger M1 profile in Group4 MB compared to SIGLEC-10 and TREM2 (Fig. 2b). Overall, these findings suggest that SIGLEC-10 is a marker for MG in both MB and GBM and exhibits tumor- and subgroup-specific TAM phenotypes. For detailed Spearman correlation data, see Supplementary Table S1.

Spearman correlation test between Siglec-10 and genes representing MG and TAM-phenotypes in brain tumors.
2a. MG (TREM2, P2RY12, TMEM119, AIF1), MG/BMDM (AIF1, CD163, CD45) and BMDM (ITGA4). A Spearman r-value equal to or above 0.26 (light green) and a p-value < 0.001 was considered a weak positive correlation, Spearman r equal to 0.30 or above (green) and a p-value < 0.05 a moderate positive correlation and Spearman r equal to 0.50 (dark green) or above and a p-value < 0.05 a strong positive correlation. A Spearman r equal to or below − 0.26 (light orange) and a p-value < 0.001 was considered a weak negative correlation, Spearman r equal to −0.30 or below (orange) and a p-value < 0.05 a moderate negative correlation and Spearman r equal to −0.50 (dark orange) or below and a p-value < 0.05 a strong negative correlation.
2b. Spearman correlation test between SIGLEC-10, TREM2, CD163, or ITGA4 gene-expression and the 12 selected genes representing M1 and M2 cells was performed. For specific genes, see material and methods. The ratio of positively correlated genes per gene of interest (as defined above) to the total number of genes representing each cell profile was calculated and plotted. Multiple publicly available datasets, as detailed in the Material and Methods section was used.
CD24+ and Siglec-10+ cells interact in human MB and GBM tissue
To investigate CD24 and Siglec-10 interactions in vivo, human MB (hMB) and human GBM (hGBM) tissue were analyzed. Representative images from selected hMB- and hGBM subgroups are presented in Fig. 3. In hMB tissues, CD24 staining was uniformly distributed throughout the tissue, appearing in larger or smaller vesicle-like structures. Conversely, hGBM tissues exhibited a patchy CD24 expression pattern, with CD24+ cells displaying long protrusions. These observations align with our previously published data on tumor tissue and cultured hMB and hGBM cells33. Siglec-10+ cells interacted with cells expressing CD24 in both hMB and in hGBM (Fig. 3a, white arrows indicate staining on tumor cells, yellow arrows indicate staining on MG/TAMs). Dot plot analysis of gene expression levels of CD24, SIGLEC-10, TREM2, P2RY12, TMEM119, AIF1, PTPRC (CD45), CD163, ITGA4 (CD49d) across MB and GBM subgroups confirmed the interaction between CD24 and Siglec-10, patterns suggest that CD24⁺ tumor cells and immune cell populations (e.g., TAMs and MG) are present within the same tumor microenvironment (Supplementary Fig. S2). This supports the plausibility of interactions between CD24⁺ tumor cells and these immune cell types, which may have implications for therapeutic strategies targeting CD24. To confirm that Siglec-10 represent MG/TAMs in situ, we also analyzed the co-localization of Siglec-10 with TREM2 and CD163. In hMB and hGBM, Siglec-10+ cells with long protrusions colocalized with TREM2 and in most cases with CD163. In hMB as well as in hGBM, no co-labeling was seen between Siglec-10 (long protrusions/pointy pattern) and the marker for BMDM – ITGA4 (CD49d). However, a few double-stained Siglec-10+/CD49d+ cells with TAM-morphology were found near blood vessels (Supplementary Fig. S3).
In summary this histological data confirms the gene-expression data stating that Siglec-10+ cells detected in brain tumors express MG/TAM-markers but not markers for BMDM. Tumor cells expressing CD24 and Siglec-10+TREM2+ cells interact both in hMB and in hGBM.

CD24+ and Siglec-10+ cells interact in human MB and GBM tissue.
Selected tissue sections were stained using immunohistochemistry.
a. Upper panel: Representative spatial overviews of hMB (SHH, Group3/4) (10x magnification) and hGBM (M) (20x magnification). White circles indicate areas shown as enlarged picture below. CD24(green)/Siglec-10(red). DAPI was used as nuclear staining. Scale bar, 500 μm.
Lower panel: Enlarged pictures of hMB (SHH, Group3/4) and hGBM (M). White arrows indicate labeling on tumor cells. Yellow arrows indicate labeling on MG/TAMs. CD24(green)/Siglec-10(red). DAPI was used as nuclear staining. Scale bar, 50 μm.
b. Upper panel: Representative spatial overviews (10x magnification) of hMB (WNT) and hGBM (PN). TREM2(green)/Siglec-10(red). DAPI was used as nuclear staining. Scale bar, 500 μm.
Lower panel: Representative pictures (20x magnification) of hMB (SHH) and hGBM (PN). White circles indicate areas shown as enlarged picture below. White arrows indicate labeling on tumor cells. Yellow arrows indicate labeling on MG/TAMs. TREM2(green)/Siglec-10(red). DAPI was used as nuclear staining. Scale bar, 50 μm.
c. Upper panel: Representative spatial overview (10x magnification) of hMB (SHH). CD163(green)/Siglec-10(red). DAPI was used as nuclear staining. Scale bar, 500 μm.
Lower panel: Representative pictures (20x magnification) of hGBM (M). White circle indicates areas shown as enlarged picture below. Yellow arrows indicate labeling on TAMs.
Intra-tumoral delivery of MTX prolongs survival and reduces tumor size in SB28CD24high gliomas
We evaluated CD24 expression in two mouse glioma models: the immunogenic GL261 and the treatment-resistant SB28 cell lines. Flow-cytometric analysis revealed that GL261 cells expressed low levels of CD24 (7.7%), whereas SB28 cells exhibited high levels of CD24 (89.4%) (Fig. 4a). CD24 staining was confirmed on cultured cells, which showed very weak CD24 expression in GL261 cells compared to strong, vesicular CD24 labeling in SB28 cells, mirroring the CD24 expression pattern observed in human medulloblastoma (hMB). When cultured under stem-cell conditions in serum-free medium and on non-adherent flasks for 48–96 h, SB28 cells formed spheroids, whereas GL261 cells did not (Supplementary Fig. S4). We wanted to investigate MTX-targeting in brain tumors expressing increased levels of CD24. Therefore, the SB28CD24high mouse glioma model was chosen.
MTX was administered directly into the tumor of SB28 bearing mice to improve drug delivery and to minimize systemic side effects, including dampening of the immune response. To evaluate the therapeutic effects of continuous intra-tumoral delivery of MTX, mice with established intracranial SB28CD24high gliomas were treated using mini-osmotic pumps delivering MTX at concentrations of 30 µM (SB28, n = 8), or 120 µM (SB28, n = 17). Survival rates were compared with untreated controls (SB28, n = 28). All untreated mice developed lethal tumors. Though some treatment efficacy was observed, none of the MTX-treated mice survived. Statistically significant differences in survival were found between untreated controls and 120 µM MTX (no treatment versus 120 µM MTX, p < 0.0001), as well as between 30 µM and 120 µM MTX treatments (30 µM MTX versus 120 µM MTX, p = 0.0181). No significant difference was observed between untreated controls and 30 µM MTX (no treatment versus 30 µM MTX, p = 0.146) (Fig. 4b). Median survival for no treatment was 27,5 days, for MTX 30 µM 29,5 days and for MTX 120 µM 32 days.
Since we found a small treatment effect by MTX, we next investigated whether we could observe any changes in tumor size after treatment with 120 µM MTX in the SB28CD24high model. In addition to untreated animals, we also included mice with pumps containing only saline, to rule out a purely mechanical influence of the pump. All mice were sacrificed on day 19 after tumor inoculation. Tumors were excised, serially sectioned, and stained with DAPI. Differences in tumor size among the no treatment group (n = 7), saline pump group (n = 7) and the group receiving a pump with 120µM MTX (n = 7) were analyzed using computerized image analysis. Three sections per tumor were included. Treatment with 120 µM MTX resulted in a significant reduction in tumor size compared to both untreated controls and saline-treated animals. Notably, tumors in the saline-treated group were larger than those in the untreated controls. Statistical analysis showed significant differences: 120 µM MTX versus untreated (p < 0,001****), 120 µM MTX versus saline (p < 0,001****), and untreated versus saline (p < 0,001****), showing that MTX effectively reduced tumor size in the SB28CD24high model (Fig. 4c). Representative pictures of tumors from the different groups are shown in Fig. 4d.
In conclusion, a small effect on survival time as well as a reduced tumor size was recorded after intra-tumoral MTX treatment in SB28CD24high mouse gliomas.

Analysis of CD24 expression, survival and tumor size in mouse gliomas4a.
Analysis of CD24 expression of GL261- and SB28 mouse glioma cells using flow cytometry. GL261 (7,7%), SB28 (89,4%). Matched isotype antibodies were used as controls.4b. Kaplan Meyer survival curves of mice bearing established intracranial SB28CD24high gliomas. MTX was administered using a mini-osmotic pump and brain infusion kit between days 7–13 for SB28 (dotted line). Concentrations used; 30 µM MTX (SB28 n = 8) 120 µM MTX (SB28 n = 17). Survival was compared to animals without any treatment (SB28 n = 28) as controls. A log-rank test was used to determine the difference between the MTX-treated mice (green line, blue line) and control mice without any treatment (black line). A p-value of < 0.05 was considered statistically significant. Survival was monitored for 100 days.
4c. For the tumor size study, mice were sacrificed on day 19 after tumor inoculation. The groups included: 120 µM MTX (n = 7), untreated mice (n = 7), and mice with pumps containing saline (n = 7). Tumor sections were stained with DAPI, and overviews were aquired at 10x magnification. Computerized image analysis was performed to calculate tumor area, expressed in mm2. Three sections per tumor were analyzed. Statistical differences were assessed using the Mann-Whitney U-test in Prism9® (GraphPad Software, USA). A p-value of < 0.05 was considered statistically significant.
4d. Representative images of DAPI-stained tumors from the no-treatment, saline pump and MTX (120µM) groups are shown.
Siglec-10+ cells interact with CD24 expressing SB28 mouse gliomas
In murine models, CD24 is expressed not only by tumor cells but also by erythrocytes and diverse immune cell populations22,46. This broad expression profile requires careful interpretation when assessing CD24 expression in tumors in vivo. Representative spatial overviews of CD24 distribution in SB28 gliomas and corresponding tumor sizes are depicted in Fig. 5a. Figure 5b illustrates CD24 (green) and Siglec-10 (red) localization within SB28 tumors, with the circle highlighting enlarged areas below. The enlarged image shows vesicular CD24 patterns on cells interacting with Siglec-10+ cells. Based on our observations, tumor cell CD24 expression can be distinguished with reasonable confidence by its characteristic vesicular pattern, in contrast to bone marrow-derived cells. To validate this, we co-stained CD24 with the pan- immune marker CD45 in SB28CD24high and GL261CD24low tumors (see supplementary Fig. S5). CD24/CD45 double-positive cells exhibited immune-like morphology in both tumors, whereas CD24+/CD45– cells with vesicular CD24 staining were predominantly observed in SB28 tumors. This pattern was further confirmed in cultured SB28 cells (supplementary Fig. S4). In summary, although the widespread expression of CD24 in murine tumors limited direct assessment of drug-induced CD24 modulation, we verified that CD24+ tumor cells interact with Siglec-10+ cells in SB28 gliomas, mirroring interactions seen in human brain tumors (Fig. 3.)

Siglec-10+ cells interact with CD24 expressing SB28 mouse gliomas.
Double-staining of SB28 mouse glioma tumor sections (immunohistochemistry). Sections from the tumor size study in Fig. 4.
-
a.
Representative spatial overviews (10x magnification) of mice receiving no treatment, saline pumps and intra-tumoral delivery of 120 µM MTX. CD24 (red). DAPI was used as nuclear staining (blue). White lines indicate tumor area, compared to total brain area. Scale bar, 500 μm.
-
b.
Representative image on the left shows the distribution of CD24 (green) and Siglec-10 (red) in the tumor microenvironment of SB28 mouse gliomas. The middle image shows CD24 only and image to the right shows Siglec-10 only. Enlarged images below, corresponding to areas marked with circles, display vesicular CD24 expression by SB28 tumor cells (green) interacting with Siglec-10+ cells (red). DAPI was used as nuclear staining (blue). Scale bar: 100 μm (10x magnification).
MTX reduced Siglec-10+– and TREM2+-cells and increased CD8+-cells in SB28CD24high tumors
Tumors included in the tumor size study were stained for Siglec-10, TREM2, and CD8 and analyzed for drug-induced differences. The ratio between Siglec-10, TREM2 or CD8 stained surface area compared to DAPI labeled tumor area was calculated. The stained area corresponding to Siglec-10+ cells was significantly decreased in MTX-treated animals (n = 7, 3 sections per animal) as compared to both no treatment (n = 7, 3 sections per animals) and to saline (n = 7, 3 sections per animal) (no treatment versus MTX p = < 0.0001****; saline versus MTX p = < 0.0001****; no treatment versus saline p = 0,7462 ns) (Fig. 6a). The stained area corresponding to TREM2+ cells significantly decreased in MTX-treated animals (n = 7, 3 sections per animal) as compared to no treatment (n = 7) and to saline (n = 7). There was no difference between no treatment and saline (no treatment versus MTX p = 0.0022**; saline versus MTX p < 0.0001****; no treatment versus saline p = 0.6904 ns) (Fig. 6a). The stained area corresponding to CD8+ cells was significantly increased in MTX-treated animals (n = 7, 3 sections per animal) as compared to both no treatment (n = 7, 3 sections per animal) and to saline s (n = 7, 3 sections per animal). CD8 + cells was also increased in no treatment compared to saline (no treatment versus MTX p < 0.0001****; saline versus MTX p < 0.0001****; no treatment versus saline p = 0.0004***) (Fig. 6a). Representative images of Siglec-10 and TREM2 double-staining in tumors from non-treated animals and in MTX-treated animals showed that Siglec-10 and TREM2 co-localized and that both markers were reduced after treatment (Fig. 6b). In addition, representative pictures of CD8 in tumors from non-treated animals and in MTX-treated animals showed that CD8-labeling was increased after treatment (Fig. 6c).

MTX-induced modulation of Siglec-10, TREM2 and CD8 in SB28 mouse gliomas.
6a. Tumor sections included in the tumor size study were stained for Siglec-10, TREM2 or CD8. DAPI was used as nuclear staining. Overviews were taken at 10x magnification. Computerized image analysis was performed and the ratio between the Siglec-10, TREM2- or CD8-stained area compared to DAPI-stained tumor area was calculated. Seven animals per group and 3 serial sections per tumor were analyzed. Differences were calculated with the Mann-Whitney U-test using Prism9® software (GraphPad software, USA). A p-value of < 0.05 was considered statistically significant. 6b. Double-staining of Siglec-10 (red) and TREM2 (green) in frozen SB28 tumors. DAPI was used as nuclear staining. Scale bar 50 μm (20x magnification). 6c. Staining of CD8 (red) in SB28 tumors. Picture to the left, SB28 tumors without treatment covers the whole picture area. Picture to the right, white marking, indicates the smaller tumor area after treatment with 120 µM MTX. Scale bar 100 μm (10x magnification).
MTX induces a dose dependent cell death and modulates CD24 expression
To verify the direct cytotoxic effects of MTX on the murine SB28 cell line, as well as on hGBM, we subjected cell cultures to treatment with increasing doses of the drug (0.5, 1, 2, 5, and 18 µM) for 24, 48, and 72 h. SB28 cells were less sensitive than hGBM cells, but 10µM MTX caused > 90% of all cells to die (Fig. 7a). Cell death of 50% of SB28 cells was reached after 48 h at 2 µM MTX-treatment, therefore this dose was chosen in the next experiment. SB28 mouse glioma cells express high levels of CD24 as determined by immunocytochemistry of cultured cells, while we have shown in previous publications that cultured hMB also express high levels of CD2433. Hence, we investigated whether MTX modulated CD24 expression by treating tumor cells with 2 µM MTX. Immunocytochemical staining of SB28, hGBM, and hMB cells showed that MTX reduced the expression level of CD24 on all tumor cells investigated, as compared to non-treated cells (Fig. 7b). Computerized image analysis of SB28 (p-value < 0.0001****) and hGBM cells (p-value 0.0011**) showed a significant reduction of CD24 expression after MTX-treatment (Fig. 7c). Flow cytometric cytometric analysis of hGBM cells confirmed this (hGBM no treatment 21% CD24, hGBM 2 µM MTX 8% CD24) (Fig. 7d). To investigate changes in intracellular CD24 expression following MTX treatment, we applied an alternative staining protocol (see Materials and Methods). Qualitative alterations in CD24 expression were observed in all analyzed cells. After MTX treatment, CD24 localized around the nuclei and appeared in larger clusters compared to untreated cells. In SB28 cells, the staining pattern suggested a loss of the vesicular distribution of CD24 following MTX exposure (Fig. 7e).

MTX-induced changes in cell viability and CD24 expression.
7a. Cell viability was investigated using an MTT-assay. Adherent cells (SB28, hGBM) were treated with 0.5, 1, 2, 5, 10, or 18 µM of MTX for 24, 48, and 72 h. OD, optical density. Dotted line indicates 50% cell death. 7b. Cells cultured in multi-chamber slides and stained for CD24; SB28 (red), hGBM (green), and hMB (green), using immunocytochemistry. Upper panel: no treatment. Lower panel: 2µM MTX for 48 h. Representative images from one experiment are shown. DAPI was used as nuclear staining. Scale bar 50 μm (20x magnification) or 20 μm (40x magnification). Matched isotype control antibodies are shown to the right. 7c. Cells (SB28, hGBM) were cultured in multi-chamber slides, treated with 2µM MTX for 48 h and stained for CD24. Pictures were taken at 10x magnification for image analysis. Amount CD24-labeling per picture was analyzed and differences were calculated with the Mann-Whitney U-test using Prism9® software (GraphPad software, USA). A p-value of < 0.05 was considered statistically significant. 7d. hGBM cells were treated with 2 µM of MTX for 48 h and changes in CD24 expression were analyzed with flow cytometry. Histogram shows a change from 21% CD24+ cells to 8% CD24+ cells after treatment. Matched isotype antibodies were used as controls. 7e. Cells (SB28, hGBM hMB) were cultured in multi-chamber slides, treated with MTX for 24 h and stained for intra-cellular CD24. Untreated cells were used as controls. Matched isotype control antibodies are shown to the right. Representative images are shown. DAPI was used as nuclear staining. Scale bar 5 μm (100x magnification).