
ESM1 was differentially expressed between BC and control tissues
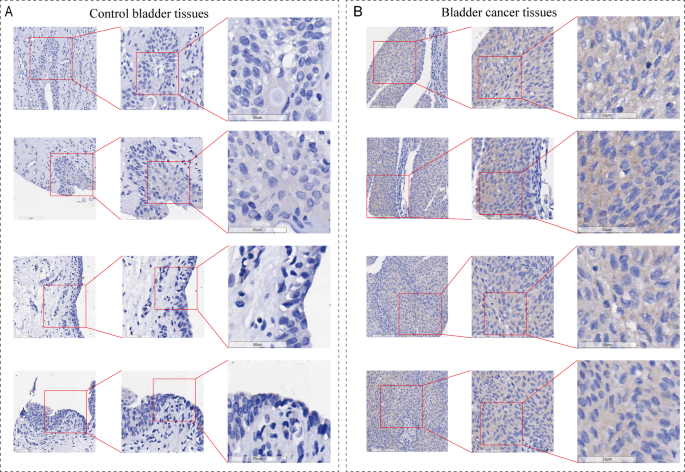
We performed immunohistochemistry on 195 internal samples to explore the expression of ESM1 protein levels in BC. Under the microscope, we found that ESM1 stained weakly in non-BC control tissues and strongly in BC tissues (Fig. 1A, B). In addition, scatter plots showed that the expression level of ESM1 protein was significantly higher in BC tissues than in controls (p < 0.05, Fig. 2A). The ROC plot suggested that the highly expressed ESM1 protein could better distinguish BC tissues from non-cancerous tissues (AUC = 0.99, Supplementary 4A).

Microscopic view of immunohistochemistry (IHC) experiments of ESM1 in BC and control samples. (A) IHC staining of control samples. (B) IHC staining of BC samples.

Comparison of differential expression of ESM1 in BC and its control samples at the mRNA and protein levels. (A) Scatter plots comparing differential expression of ESM1 at the protein level based on internal samples (B) Scatter plots of ESM1 mRNA expression in each dataset. (C) Forest plot of combining standardized mean difference (SMD) of ESM1 in BC and normal bladder tissues. (D) Egger’s test was used to detect publication bias. (E) Summary receiver operating characteristic curve.
Subsequently, we further analyzed ESM1 expression at the mRNA level using a large number of global multicenter samples (n = 1558). Among the 13 datasets included in this study, eight datasets (GPL14951, GPL24676, GSE19915_GPL3883, GSE40355, GSE52519, GSE106534, GSE133624, and TCGA_BLCA_mRNA) detected that the ESM1 mRNA expression level in the BC group was elevated (p < 0.05; Fig. 2B). The heterogeneity test revealed I2 > 50, τ2 = 0.7295, and a Q-value p < 0.01, indicating significant heterogeneity among the included datasets (Fig. 2C). To eliminate the effects of single cohort and heterogeneity, we calculated the pooled SMD across all datasets using a random-effects model. The results showed that the ESM1 expression in the BC group was overall higher than that in the control group (SMD = 1.27; Fig. 2C). Egger’s test did not detect significant publication bias (p > 0.1; Fig. 2D). Following leave-one-out analysis, sensitivity analysis indicated that heterogeneity primarily originated from the GPL570 cohort, and datasets with smaller sample sizes exerted a relatively minor overall influence on the ESM1 expression profile in BC (Supplementary 4C, D). Therefore, we believed that data originating from different experimental platforms was the reason for the high heterogeneity.
Given the important role of ESM1 in TME, we wanted to further investigate the clinical value of ESM1 in BC by ROC and sROC curves. As shown in Supplementary 4B, the ROC curves of 7 of the 13 included datasets demonstrated that ESM1 mRNA expression had a high ability to discriminate between BC samples and control samples (AUC > 0.8). To exclude the chance of a single cohort, the sROC plots pooled across all datasets also demonstrated this (AUC = 0.94, 95% CI [0.92–0.96]; Fig. 2E).
Potential transcriptional regulatory mechanisms of ESM1 expression
Predicting the transcription factors (TFs) upstream of ESM1 by Cistrome Data Browser, we found that CEBPB, CTCF and NR3C1 possessed extremely high potential. Further validated by ChIP-seq, we found that ESM1 may have binding peaks of CEBPB, CTCF and NR3C1 at the transcription start site (TSS) (blue tracks in the blue shaded region in Fig. 3A, B). In addition, we also provided motif maps of these three TFs (Fig. 3C–E). The presence of distinct ATAC-seq peaks upstream of ESM1 suggested the presence of an open chromatin structure near the ESM1 TSS. This region readily bound to transcriptional regulators and activated the transcriptional activity of ESM1. Histone modification ChIP-seq showed five histone modification peaks 2 kb before and after the ESM1 TSS. H3K4me3 labeled promoter, H3K4me1, H3K27ac labeled enhancer, and H3K27me3 and H3K9me3 suggested the presence of silencers.

Exploring the epigenetic regulatory mechanisms of ESM1 in BC. (A) Transcriptional regulation of ESM1 in BC. (B) Magnified blue shaded area. (C) Motif of transcription factor CEBPB. (D) Motif of transcription factor CTCF. (E) Motif of transcription factor NR3C1.
scRNA-seq revealed ESM1 expression and cellular communication in BC cell level
Next, we further analyzed ESM1 expression and cellular communication in BC types of cells in scRNA-seq. A total of 13,020 cells were included in this study, which could be annotated into 12 common cell types (Fig. 4A). Through the proposed timing analysis by ‘‘CytoTRACE’’ package and ‘‘monocle3’’ package, we found that ESM1 was predominantly expressed in lymphatic vessel endothelial cells (Fig. 4B, C, G, I), and as the cell differentiation level, the expression of ESM1 showed a significant increase and then a slow decrease, with a significant peak (Fig. 4J). Epithelial cells and lymphatic vessel endothelial cells had a higher differentiation potential (Fig. 4D–F), which were the beginning of cell differentiation. Further, we targeted the lymphatic endothelial cell clusters alone and found a right-to-left developmental trend (Fig. 4H). Figure 4K shows the single-cell level associations of each subpopulation of cells in 3D view.

Single-cell sequencing reveals ESM1 expression at the BC cell level. (A) The included cells were annotated into 12 cell types. (B) UMAP plots of ESM1 expression levels in different cell types. (C) Violin plots of ESM1 expression levels in different cell types. (D) Monocle3 putative cell differentiation trajectories. (E) Combined CytoTRACE scoring of cell differentiation trajectory plots. (F) Box plots of predicted differentiation potential of different cell types based on CytoTRACE score. (G) CytoTRACE predicted the distribution of different types of cell differentiation potential and ESM1 expression levels. (H) Monocle3 proposed temporal trajectory graph. (I) Distribution of ESM1 expression in various cell types. (J) ESM1 expression levels changed with cell differentiation. (K) 3D UMAP plots of cell relationships of each subpopulation.
CellChat analysis revealed a rich network of interactions among various subpopulations of cells, among which the number of interactions among lymphatic vessel endothelial cells, epithelial cells and iPS cells was higher and the intensity of interactions was higher (Fig. 5A, B). Since the contribution of SPP1 pathway in both afferent/efferent signaling pathways of lymphatic vessel endothelial cells was higher, we chose this pathway for further study (Fig. 5E, F). Figure 5C demonstrated that lymphatic endothelial cells could communicate with iPS cells, CMP, monocytes and epithelial cells through the SPP1 signaling pathway, etc. Through multiple ligand-receptor pairs, clusters of lymphatic endothelial cells were primarily involved in the SPP1 signalling pathway (Supplementary 5A, B). The SPP1 gene was mainly expressed in lymphatic endothelial cells (Fig. 5D). Analysis of the communication patterns demonstrated that the relevant molecules involved in lymphatic endothelial cell communication mainly included MK, VISFATIN, VEGF, SPP1, CXCL, PDGF, and PROS (Fig. 5G). AUCell evaluated the metabolic pathways of each subpopulation of cells, and identified that lymphatic endothelial cells were metabolized mainly through thiamine metabolism, glycosaminoglycan degradation pathway, and drug metabolism through cytochrome P450 (Fig. 5H).

Analysis of cellular communication. (A) Plot of the number of cellular interactions. (B) Cell interaction intensity map. (C) Hierarchical map and network diagram of cell interactions in the SPP1 signaling pathway. (D) Distribution of expression of genes involved in cellular communication-related genes in different cellular subpopulations. (E) Heat maps of afferent or efferent signalling pathways for each subpopulation of cells. (F) Identification of the roles assumed by each subpopulation of cells in the SPP1 signaling pathway. (G) Cell afferent and efferent communication patterns. (H) AUCell analysis of metabolic pathways in each subpopulation of cells.
ESM1 may be involved in immune-related signalling pathways
To explore the potential mechanism of ESM1 action in BC, we performed GSEA enrichment analysis on the dataset TCGA_BLCA_mRNA. Interestingly, we identified two immune-related signalling pathways (T cell receptor signalling pathway, Fc gamma R-mediated signalling pathway) that were closely associated with ESM1 expression (Fig. 6A, Supplementary 9). Genes on the two immune-related pathways were intersected (Fig. 6B). Among them, some of the intersected genes were differentially expressed in BC and significantly correlated with ESM1 expression, e.g., VAV1,VAV3, MAP2K1, PIK3R1, MAPK3, PTPRC, PIK3R2, AKT3 (p < 0.05 Fig. 6C, D). Further, PPI analysis was used to explore the interactions of the above intersecting genes. We found that these genes closely interacted with each other at the protein level, and PTPRC and MAPK3 might be hub genes common to both pathways (Fig. 6E, F).

ESM1 may affect immune-related signalling pathways. (A, B) Based on the dataset TCGA_BLCA_mRNA, ESM1 may affect the intersection of immune-related signalling pathway in BC (A) and its pathway key genes (B). (C) Immune-related signalling pathway intersecting genes were differentially expressed in BC and control samples. (D) Intersecting genes were differentially expressed in the ESM1 high- and low-expression groups. (E) Protein–protein interaction analysis of differential genes. (F) Mining of core genes in protein–protein interaction networks. ns/NSp > 0.05, *p < 0.05, **p < 0.01, ***p < 0.001, ****p < 0.0001.
ESM1-related immune infiltration analysis
Using the ‘ssGSEA’24 package to assess immune cell levels, we found significant differences in the levels of 25 immune cells between the high and low ESM1 expression groups (p < 0.05; Fig. 7A). The low ESM1 expression group had higher immune cell levels compared to the high expression group. The heatmap showed that the immune cell levels were negatively correlated with ESM1 expression and positively correlated with all immune cells (Fig. 7B).

Correlation between ESM1 and immune cell levels based on the dataset TCGA_BLCA_mRNA. (A) Different immune cell scores between high ESM1 expression group and low ESM1 expression group. (B) Heatmap of the correlation between ESM1 and immune cell scores. ns/NSp > 0.05, *p < 0.05, **p < 0.01, ***p < 0.001, ****p < 0.0001.
Based on the ESTIMATE algorithm, high ESM1 expression was significantly negatively correlated with StromalScore, Immunescore and ESTIMATE scores of the tumour microenvironment (TME) (r < 0, p < 0.05) and positively correlated with tumour purity (Fig. 8A). The high ESM1 expression group had lower TME scores and significantly higher tumour purity compared to the low ESM1 expression group (p < 0.0001; Fig. 8B).The TIMER algorithm showed that ESM1 expression was negatively correlated with the level of infiltration of the six immune cells (r < 0, p < 0.01; Fig. 8C), and the low ESM1 expression group had a significantly higher level of infiltration of immune cells (p < 0.01; Fig. 8D). The efficacy analysis of immunotherapy showed that there was not yet a noticeable difference in the effectiveness of anti-CTLA-4 and anti-PD-1 immunotherapy between BC patients in the ESM1 high- and low-expression groups (p > 0.05; Supplementary 6A). However, TIDE score calculations revealed that the low-expression group of ESM1 exhibited significantly higher scores than the high-expression group, indicating that BC with low ESM1 expression were more prone to immune evasion and less likely to respond to immunotherapy. (p = 4.5e-6; Supplementary 6B).

ESM1 expression was strongly correlated with the BC tumour microenvironment. (A) Correlation between ESM1 expression and immune infiltration score. (B) Differences in immune infiltration scores between high ESM1 expression and low ESM1 expression groups. (C) Correlation between ESM1 expression and immune cell levels. (D) Differences in immune cell levels between the high ESM1 expression group and the low ESM1 expression group. ns/NSp > 0.05, *p < 0.05, **p < 0.01, ***p < 0.001, ****p < 0.0001.
Relationship between tumour microenvironment and prognosis and clinicopathological features of BC patients
To investigate the relationship between TME and the prognosis of BC patients, based on the prognostic information of TCGA patients, we found that the prognosis was better in the low stromalscore group and the high immunescore group (p < 0.05), whereas ESTIMATEscore and tumour purity had no significant correlation with the prognosis of BC patients (Fig. 9A). Further, we explored the relationship between different clinical indicators and TME. The results showed that BC TME infiltration scores differed significantly with different clinicopathological features.StromalScore was associated with age, gender and positively correlated with T, N staging and AJCC staging; Immunescore was associated with gender only and had no significant association with other clinical parameters. In addition, ESTIMATEscore and tumour purity were correlated with age, sex, T, N staging and AJCC staging, but not with M staging (Fig. 9B).

Tumour microenvironment was strongly associated with survival time and clinicopathological features of BC patients. (A) KM curve of immune infiltration score and survival time of BC patients. (B) Significant differences in different clinicopathological features in the tumour microenvironment. ns/NSp > 0.05, *p < 0.05, **p < 0.01, ***p < 0.001, ****p < 0.0001.
Relationship between ESM1 expression and clinicopathological features
We explored the association between ESM1 and several clinicopathological characteristics of BC patients (Supplementary 7) and found that age, gender, race, clinical stage, tumour grade, N stage, and diagnostic subtype were significantly associated with the expression of ESM1 (p < 0.05), but not with other clinicopathological characteristics. Subsequently, we further analysed multiple sets of clinical data. As shown in Supplementary 8, ESM1 expression levels were higher in BC patients with Asian ethnicity (p < 0.01). With the progression of T, N stage and clinicopathological stage, the ESM1 expression level gradually decreased. This dynamic change is supported by the pseudo-time analysis results from scRNA-seq, and we propose that it may be associated with the crucial role ESM1 plays in the proliferation and migration of early-stage BC. In conclusion, ESM1 has a certain predictive value for clinical progression.
miR-129-5p expression level in BC
We used 5 online tools to predict upstream miRNAs targeting to regulate ESM1, and the intersection results yielded 8 target miRNAs (Fig. 10A). Combined with the 3 TFs (CEBPB, CTCF, NR3C1) predicted in the previous section, we constructed the TFs-target gene-miRNA regulatory network (Fig. 10B). Subsequently, we selected miR-129-5p for further study (Fig. 10C).

Expression levels of miR-129-5p in blood and tissue samples in BC and control groups. (A) Results of five miRNA prediction tools. (B) miRNA-target gene-TFs regulatory network. (C) Binding sites of ESM1 and miR-129-5p. (D) Scatter plot based on blood samples. (E) Scatterplot based on tissue samples. (F) Forest plot of standardised mean difference (SMD) of ESM1 in tumour samples and control samples.
In this study, 6625 BC blood samples and 528 tissue samples were included to investigate the expression level of miR-129-5p in BC. Except for the E-MTAB-2573 dataset, which was not statistically significant (p > 0.05) and might be related to the small sample size, the results of the rest of the datasets showed down-regulation of miR-129-5p expression (p < 0.05; Fig. 10D, E). To ensure the consistency of the results, we used a fixed-effects model to calculate the SMD separately for BC blood and tissue samples, and the results showed that miR-129-5p expression was down-regulated in both samples (blood SMD = − 0.73, 95% CI [− 0.82; − 0.64]; tissue SMD = − 1.09, 95% CI [− 1.42; − 0.77]; Fig. 10F).
miR-129-5p expression detection efficacy in BC blood and tissue samples
miR-129-5p demonstrated good detection efficacy in both BC tissue samples and blood samples. ROC curves and sROC curves showed that miR-129-5p in blood samples had a moderate discriminatory ability in distinguishing between BC tissue and control samples (AUC = 0.75; Fig. 11A, B). Similarly, miR-129-5p in tissue samples demonstrated moderate discriminatory efficacy (AUC = 0.73; Fig. 11C, D). In addition, we combined the two samples and calculated the combined positive likelihood ratio and negative likelihood ratio. Figure 11E showed that the positive likelihood ratio was 3.49, (95% CI [2.81–4.33]), and the negative likelihood ratio was 0.45, (95% CI [0.35–0.57]), suggesting that miR-129-5p was supportive for the differentiation and exclusion of BC.

Detection efficacy of miR-129-5p expression in BC blood and tissue samples. (A) Receiver operating characteristic curves based on blood samples. (B) Summary receiver operating characteristic curves based on blood samples. (C) Tissue samples based on receiver operating characteristic curves. (D) Summary receiver operating characteristic curve based on tissue samples. (E) Positive likelihood ratio and negative likelihood ratio analysis.