
Integrated identification of shared signature genes
To establish a molecular foundation for the PD-UC axis, we integrated multi-source genomic and transcriptomic data. Integration of disease-associated genes from curated databases and differentially expressed genes (DEGs, Supplementary Data 1) from our transcriptomic analysis identified 320 shared signature genes (Table 1, Fig. 1A, and Supplementary Data 2). During the transcriptomic discovery phase, a stringent statistical refinement was employed to prioritize genes with the highest biological relevance and to minimize false discovery rates. Under the threshold of FDR < 0.00001 and |log2FC| > 1, 185 DEGs were identified in the PD discovery cohort (GSE22491), while 20 genes met these criteria in the UC cohort (GSE3365) (Fig. 2B, C). These shared signature genes constitute a potential candidate set for exploring the shared molecular features linking the two disorders.

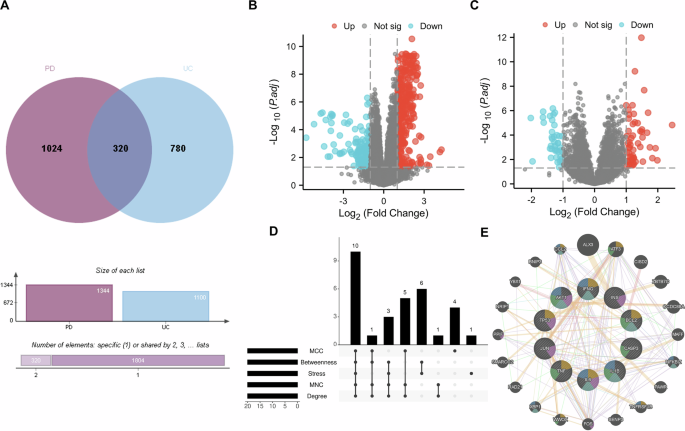
A Identification of shared signatures: The Venn diagram illustrates the intersection of disease-associated gene sets from multiple sources. A total of 320 shared signature genes were identified by integrating transcriptomic DEGs from GEO datasets (GSE22491 for PD and GSE3365 for UC, applying a stringent threshold of FDR < 1e-5 and |log₂FC| > 1), with curated disease-associated genes from GeneCards, DisGeNET, and CTD databases. Transcriptomic profiles: Volcano plots display the gene expression landscape in B PD (GSE22491) and C UC (GSE3365). Red and blue dots represent significantly up-regulated and down-regulated genes, respectively, based on the predefined empirical Bayes (eBayes) moderation method. D Consensus of core genes: The Upset plot visualizes the consensus selection of the 10 core genes (TNF, IL1B, TP53, AKT1, CASP3, IL6, BCL2, IFNG, INS, and JUN). These genes represent the consensus candidates identified across five distinct topological algorithms (Degree, MCC, MNC, Stress, Betweenness) using the CytoHubba plugin within the protein-protein interaction (PPI) network. E GeneMANIA interaction network of core genes: A functional interaction network was constructed specifically for the 10 core genes to explore their biological interplay. The network integrates multiple evidence levels: co-expression (59.0%), physical interactions (15.2%), and predicted functional associations (22.1%), highlighting the highly interconnected nature of these neuro-inflammatory and apoptotic regulators.

Receiver operating characteristic (ROC) curves evaluating the discriminatory capacity of the ten core genes in A PD (GSE22491) and C UC (GSE3365) discovery cohorts. The area under the curve (AUC) values provide a descriptive estimate of gene-level discriminatory performance to distinguish disease states from healthy controls. Hierarchical clustering heatmaps of the ten core genes in B PD and D UC samples. Samples are categorized by color (Red: Disease; Blue: Healthy Controls). Clustering was implemented using the complete linkage method based on Euclidean distance metrics to illustrate coordinated expression patterns across groups. Box plots illustrating the differential expression levels of representative core genes in (E) PD and (F) UC. P-values were determined by the non-parametric Wilcoxon rank-sum test, with P < 0.05 considered as the threshold for statistical significance. Data are presented as medians with interquartile ranges (IQR). All statistical tests were two-tailed. G Repeated stratified 5-fold cross-validated area under the curve (AUC) values for each topology-derived core gene in the discovery cohorts of Parkinson’s disease (PD) and ulcerative colitis (UC). Points indicate mean AUC values across repeated iterations, and error bars indicate empirical 95% intervals derived from the cross-validation procedure. A dashed horizontal line marks the chance level (AUC = 0.5). H Heatmap-style summary of cross-validated and external validation AUC values for all topology-derived core genes across the PD and UC analysis framework. Numeric values are shown within each tile to facilitate direct comparison. These analyses were conducted separately in PD and UC to assess gene-level stability and reproducibility across cohorts. Overall, the topology-derived core genes showed heterogeneous discriminatory performance, with a narrower subset demonstrating relatively greater stability, whereas several others showed context-dependent or limited standalone discriminatory ability.
PPI network architecture and core gene identification
To define the shared protein-interaction landscape between PD and UC, we constructed a protein-protein interaction (PPI) network from the 320 shared signature genes. To minimize the influence of ubiquitous, non-specific hubs, housekeeping-associated proteins, including glyceraldehyde-3-phosphate dehydrogenase (GAPDH), actin beta (ACTB), and albumin (ALB), were excluded before topological analysis. Integration of five complementary centrality measures—MCC, Stress, MNC, Degree, and Betweenness—identified 10 candidate hub genes that consistently ranked among the top 20 across all algorithms. These topology-derived core genes were BCL2, INS, IL1B, JUN, TNF, TP53, IFNG, CASP3, IL6, and AKT1 (Table 2 and Supplementary Table 2).
We next evaluated the gene-level discriminatory performance of these topology-derived core genes in the PD and UC cohorts using receiver operating characteristic (ROC) analysis (Table 2). In the PD discovery cohort (GSE22491), TNF (AUC = 0.838) and IL1B (AUC = 0.812) showed relatively higher gene-level discriminatory performance than the other topology-derived core genes (Fig. 2A), with partial support in the external PD validation cohort (GSE75249; TNF AUC = 0.654, IL1B AUC = 0.684). In the UC analysis framework, CASP3 exhibited the most consistent performance across the discovery cohort (GSE3365; AUC = 0.652) and the external validation cohort (GSE119600; AUC = 0.778; Fig. 2C). Differential expression analysis further supported disease-associated perturbation of the shared module: TNF and IL1B were significantly upregulated in the PD discovery cohort (P < 0.05; Fig. 2E), whereas TP53, CASP3, and INS were significantly differentially expressed in the UC discovery cohort (P < 0.05; Fig. 2F). Together, these analyses were intended to characterize the expression patterns and descriptive discriminatory capacity of the topology-derived core genes, rather than to establish a definitive diagnostic signature. Additional ROC curves, hierarchical clustering, and expression profiles across discovery and validation cohorts are provided in Supplementary Fig. 1.
Notably, the discriminatory performance of the 10 topology-derived core genes was heterogeneous across datasets. Cross-validated analyses further showed that not all network-central genes retained stable single-gene performance across cohorts, and that the more reproducible signal was concentrated in a narrower subset of inflammatory and apoptosis-related regulators. These findings indicate that network centrality and gene-level classification performance capture related, but distinct, properties of the shared PD-UC molecular architecture. Accordingly, the 10-gene core set is better interpreted as a topology-informed shared regulatory module linking PD and UC than as a finalized biomarker panel (Fig. 2H; Table 3 and Supplementary Fig. 4).
Functional enrichment and cross-cohort comparator analysis
Functional enrichment analysis of the 320 shared signature genes revealed a broad inflammatory-stress landscape characterized by microbial-response, oxidative-stress, and lipid-associated programs (Fig. 3 and Table 4). Within the GO biological process category, the most significantly enriched terms included response to lipopolysaccharide (Padj = 4.94 × 10−51) and response to oxidative stress (Padj = 2.08 × 10−50), while molecular function analysis highlighted cytokine receptor binding (Padj = 4.44 × 10⁻¹⁷). KEGG pathway analysis identified lipid and atherosclerosis (Padj = 5.78 × 10−54) and the IL-17 signaling pathway (Padj = 2.11 × 10⁻²⁶) among the most enriched pathways, supporting the involvement of inflammatory and lipid-associated regulatory programs in the shared PD-UC transcriptomic landscape.

Gene Ontology (GO) enrichment analysis of the 320 shared signature genes, stratified into A biological process (BP), B cellular component (CC), and C molecular function (MF). The results highlight a broader inflammatory-stress landscape involving microbial-response programs, oxidative stress, cytokine-related activity, and lipid/inflammatory pathway enrichment. D Kyoto Encyclopedia of Genes and Genomes (KEGG) pathway analysis for shared signature genes, identifying key metabolic and inflammatory pathways linking PD and UC. GO term enrichment for the ten identified core genes (E BP, F CC, G MF), showing a high concentration in programmed cell death and stress-activated pathways. H KEGG enrichment analysis of the 10 core genes. Bubble size corresponds to the gene count, while the color gradient (blue to red) represents statistical significance (adjusted P-value). All terms were filtered using a Benjamini–Hochberg adjusted P < 0.05.
Enrichment analysis of the 10 topology-derived core genes revealed a narrower, but partially overlapping, functional profile dominated by immune-, apoptosis-, and stress-related processes, including T-cell activation, regulation of neuron death, response to oxidative stress, protease binding, and cytokine receptor binding. At the pathway level, this reduced gene set remained broadly consistent with the larger shared-gene signature, particularly with respect to inflammatory and lipid-associated signaling, but represented a more focused regulatory module rather than the full functional breadth of the 320-gene landscape. Sensitivity analysis using relaxed statistical thresholds yielded a broadly similar shared-signature overlap and core topological architecture, supporting the robustness of the principal findings (Supplementary Fig. 3).
To place these enrichment patterns in a cross-disease context, we additionally analyzed two blood-based AD cohorts. These comparator analyses were not intended as formal validation, but rather to assess whether the inflammatory/lipid-associated enrichment observed in the shared PD-UC signature would also be recapitulated in an independent disease setting with a distinct neuroimmune background. In contrast to the PD-UC signature, the AD comparator cohorts did not show a reproducible inflammatory/lipid-associated enrichment pattern. In GSE97760, the dominant signals were related to proteasome-mediated ubiquitin-dependent protein catabolic processes, protein quality-control pathways, and RNA splicing, whereas GSE63060 was enriched mainly for translation, ribosome-related, and electron transport/oxidative phosphorylation pathways (Supplementary Table 5). Accordingly, the AD comparator results neither reproducibly recapitulated the inflammatory/lipid-associated enrichment pattern observed in the PD-UC signature nor converged with each other. Disease-named neurodegeneration pathways identified in GSE63060 were therefore interpreted cautiously, as they most likely reflected broader mitochondrial or proteostasis-related programs rather than PD-specific recapitulation.
To further interrogate the IL-17 signal identified in the discovery analysis, we performed independent cohort-level enrichment analysis using a fixed KEGG IL-17 gene set. Significant enrichment was observed in both the UC discovery and validation cohorts, supporting reproducible pathway involvement in UC. By contrast, the PD cohorts showed positive but non-significant enrichment scores, whereas the two AD comparator cohorts were both non-significant and directionally inconsistent (Supplementary Fig. 5 and Supplementary Table 4). Collectively, these findings support IL-17 signaling as a biologically plausible component of the shared PD-UC inflammatory landscape, with stronger independent support in UC than in PD. More broadly, the shared PD-UC transcriptomic profile was characterized by microbial-response, oxidative-stress, and lipid/inflammatory programs, whereas the AD comparator results should be interpreted as exploratory contextual evidence rather than as a definitive test of disease specificity. Importantly, pathway-level enrichment does not imply that every individual IL-17 pathway member has strong standalone discriminatory performance. Rather, the enrichment signal likely reflects coordinated perturbation across multiple pathway components, which can coexist with weak or context-dependent AUC values for individual genes, including IL6.
Characterization of the immune microenvironment
CIBERSORTx was used to estimate the relative proportions of 22 immune cell subsets in the discovery cohorts (Figs. 4A and 5A). In PD (GSE22491), monocyte proportions were significantly reduced, whereas activated NK-cell proportions were significantly increased (P < 0.05 and P < 0.01, respectively; Fig. 4C). A broadly similar pattern was observed in the independent PD validation cohort (Supplementary Fig. 2). In UC (GSE3365), a more extensive inflammatory profile was evident, characterized by increased neutrophil, monocyte, and regulatory T-cell (Treg) proportions together with reduced memory B-cell and M2 macrophage proportions (all P < 0.05; Fig. 5C). Notably, reduced memory B-cell abundance was observed in both disease settings, consistent with a potentially shared feature of peripheral immune dysregulation.

A Relative proportions of 22 human leukocyte subsets (LM22) estimated by CIBERSORTx in the PD dataset (GSE22491). Each bar represents one sample, and each color corresponds to a distinct immune cell type. B Spearman correlation heatmap showing the associations between the 10 topology-derived core genes and immune cell subsets in PD. Red indicates positive correlation and blue indicates negative correlation. C Comparison of immune cell fractions between PD and healthy controls (HC). Statistical significance was assessed using the Wilcoxon rank-sum test. D Correlation matrix showing the internal relationships among the 22 immune cell types in PD, illustrating the coordinated peripheral immune microenvironment. For panels involving statistical comparisons or correlation analyses, P-values were adjusted using the Benjamini–Hochberg (BH) method.

A Relative proportions of 22 human leukocyte subsets (LM22) estimated by CIBERSORTx in the UC dataset (GSE3365). Each bar represents one sample, and each color corresponds to a distinct immune cell type. B Spearman correlation heatmap showing the associations between the 10 topology-derived core genes and immune cell subsets in UC. Red indicates positive correlation and blue indicates negative correlation. C Comparison of immune cell fractions between UC and healthy controls (HC). Statistical significance was assessed using the Wilcoxon rank-sum test. D Correlation matrix showing the internal relationships among the 22 immune cell types in UC, illustrating the coordinated peripheral immune microenvironment. All P-values were adjusted using the Benjamini–Hochberg (BH) method.
Spearman correlation analysis was then performed to assess associations between the 10 topology-derived core genes and immune-cell proportions (Figs. 4B and 5B). In PD, TNF and IL1B were strongly positively correlated with activated NK cells and activated mast cells (R > 0.8, P < 0.001), whereas JUN was positively associated with CD8+ T cell abundance (R = 0.69, P < 0.01; Fig. 4B). In UC, partially concordant patterns were observed, with TNF, IL1B, and IL6 positively correlated with neutrophils and activated dendritic cells (Fig. 5B). Together, these results indicate that inflammatory core genes are linked to distinct yet partially overlapping immune alterations in PD and UC.
Correlation matrices of immune-cell subsets further revealed coordinated relationships within each disease context (Figs. 4D and 5D). In both PD and UC, resting and activated states of related immune-cell populations tended to be negatively correlated, consistent with shifts in immune activation states. In addition, monocytes showed negative correlations with several lymphoid subsets across cohorts, supporting a peripheral immune imbalance characterized by relative myeloid predominance and lymphoid dysregulation. Complete immune-cell proportion profiles, group comparisons, and gene-immune correlation results for the discovery and validation cohorts are provided in Supplementary Fig. 2 and Supplementary Data 4.
Gene regulatory network construction
The TF-gene regulatory network comprised 61 nodes representing predicted transcriptional regulators and the 10 topology-derived core genes (Fig. 6A and Supplementary Data 5). Among the predicted transcription factors (TFs), TP53 (degree = 59) and JUN (degree = 58) emerged as the highest-degree regulatory hubs. Other prominent TFs included NFKB1, RELA, and STAT3, consistent with a coordinated transcriptional program centered on cellular stress and inflammatory signaling. Complementary miRNA-gene network analysis (Fig. 6B) identified BCL2 and CASP3 as the most heavily targeted nodes at the post-transcriptional level. Using the same topological framework, hsa-miR-21-5p and hsa-miR-21-3p emerged as the leading miRNA regulators (Supplementary Data 5). Integration of the TF, miRNA, and core-gene layers (Fig. 6C) revealed a densely interconnected regulatory architecture with potential feed-forward and feedback relationships, supporting the view that these core genes participate in a coordinated disease-associated regulatory program shared by PD and UC.

A Transcription factor (TF)–gene interaction network. Squares represent upstream TFs and circles represent the identified core genes as predicted via the OmniPath database. TP53 and JUN emerge as the primary regulatory hubs coordinating the transcriptional landscape across PD and UC. B MicroRNA (miRNA)–gene interaction network. Integrated mapping of miRNAs targeting the ten core genes. hsa-miR-21-5p demonstrates significant regulatory breadth, suggesting its role as a potential post-transcriptional modulator within the gut-brain axis. C Integrated TF–miRNA regulatory circuit. A synergistic regulatory landscape of the core genes was established using RegNetwork to illustrate coordinated control at both transcriptional and post-transcriptional levels. All networks were filtered using a degree-based strategy (Degree > 9 for TFs, Degree > 3 for miRNAs) to prioritize high-confidence regulatory interactions and minimize topological noise.
Integrated regulatory networks and therapeutic associations in PD and UC
The protein–chemical interaction network (Fig. 7A and Supplementary Data 5) linked the 10 core proteins to both environmental and endogenous chemicals. CASP3, TP53, BCL2, TNF, and IL6 emerged as high-connectivity hubs within this network. These hubs were connected to toxicants such as arsenic trioxide and acrolein, as well as to bioactive compounds including curcumin, highlighting potential interfaces between the shared PD–UC core module and chemical exposures. To further assess therapeutic tractability, we constructed a complementary protein–drug interaction network, in which TNF and IL1B showed the greatest connectivity to annotated drug associations (Fig. 7B and Supplementary Data 5). Using the same topological criteria, we prioritized several compounds with potential multi-target relevance, including minocycline, glucosamine, and apremilast, which were linked to key mediators such as TNF and IFNG. Overall, these results provide a network-based framework for prioritizing candidate compounds for future experimental repositioning studies.

A Protein–chemical interaction network. Visualization of the interplay between the ten core proteins (circles) and chemical compounds (squares) retrieved from the Comparative Toxicogenomics Database (CTD). This network identifies key nodes, such as CASP3 and TNF, that integrate responses to environmental stressors and bioactive compounds, highlighting the susceptibility of the PD–UC axis to exogenous modulation. B Protein–drug interaction network. Mapping of therapeutic agents (squares) targeting the core proteins (circles) based on the DrugBank database. The network identifies several candidate drug-repurposing compounds, including anti-inflammatory modulators and kinase inhibitors, which may be evaluated for their potential to modulate pathways related to neurodegeneration and intestinal inflammation. All nodes were prioritized using an adaptive topological threshold (Degree >9 for chemicals; Degree >1 for drugs) to ensure the identification of functionally relevant therapeutic hubs. The network-based associations should be interpreted as prioritization of candidate compounds for future experimental evaluation rather than as direct evidence of therapeutic efficacy in PD–UC comorbidity.