
Pharmaceutical chemicals and antibodies
N-acetyl-leucine amide (NALA), a competitive antagonist of leucine, was purchased from Bachem (Bubendorf, Switzerland, Cat # E-1105) to mimic leucine depletion. BCAT-IN-2, a selective inhibitor of BCATm, was purchased from MedChem Express, US (Cat # HY-141669). Control-siRNA and two clones of BCAT2-siRNAs were purchased from Horizon Discovery (Cambridge, UK) to target the human BCAT2 gene (encodes BCATm) in Jurkat T cells. Information regarding antibodies is in Supplementary Table 1.
Human gene expression datasets and analysis
The genomics and visualisation platform R2 (http://r2.amc.nl) was used for the acquisition of human RNA-seq datasets aiming at comparing BCAT2 and in some of the experiments BCAT1 (the gene encoding BCATc) in T cells from healthy donors and patients with peripheral T-cell lymphoma (PTCL), anaplastic T-cell lymphoma (ATCL), angioimmunoblastic T-cell lymphoma (AITL) or T-cell acute lymphoblastic leukaemia (T-ALL). A dataset by Eckerle et al. [18] contained gene expression profiles of resting CD4+ (n = 5) and CD8+ (n = 5) T cells and activated CD4+ (n = 5) and CD8+ (n = 6) T cells isolated from tonsils of healthy human donors. This dataset was used to compare the expression of BCAT2 between resting (n = 10) and activated (n = 11) T cells by using the “singular gene versus track” analysis of R2. Resting and activated T-cell groups were prepared by pooling the CD4+ and CD8+ T cells of each group due to the small sample size; however, the individual trends of these cells were similar. The activated T cells were subjected to KEGG pathway analysis generated in the R2 platform with the following specifications: the “KEGG pathway finder for gene correlation” analysis was selected, followed by identifying the gene reporter (BCAT2) using transformation Log2, and correlation R that included positive and negative gene correlations and correlation p value cutoff < 0.05. The first five KEGG pathways, and associated genes are shown in Supplementary Tables 2 and 3. A T-cell lymphoma/leukaemia dataset deposited by Crescenzo et al. [19] included gene expression profiles from in vitro activated CD4+ (n = 4) and CD8+ (n = 4) T cells obtained from healthy individuals or patients with PTCL (n = 35), ATCL (n = 23), AITL (n = 24) and T-ALL (n = 4) [19] The gene information of this dataset was analysed by sorting the specimens by cell type and disease status. To explore the differential expression of BCAT2 and BCAT1, a “singular gene versus track” analysis was performed.
Correlation between the expression of BCAT2, or BCAT1, and the overall survival of patients with T-cell lymphoma was performed with the Kaplan–Meier Scanner of R2 using a “single gene versus track” analysis. The R2 platform contained only one T-cell lymphoma study (n = 193) with survival data for female (n = 55) and male (n = 92) patients with PTCL [20]. The minimum group size was set at n = 8 with follow-up to 200 months. The data was transformed into the Log2 scale and represented as percentage of mixed sex, averaged, and subjected to One-way ANOVA where p < 0.05 was considered statistically significant.
Mice
Mice from the C57BL/6 background were approved by the Institutional Animal Care and Use (IACUC) Committee of Des Moines University. The global BCATmKO (G-BCATmKO) and wild-type (WT) mice were maintained at Virginia Tech [15]. They were a source of CD4+ T cells in Figs. 1–2. Mice with loxP-flanked Bcat2 or Bcat1 alleles were generated previously [21, 22]. CD4-Cre mice from the Jackson laboratory (strain # 017336) were bred with mice carrying the loxP-flanked Bcat2 and Bcat1 alleles to generate single (BCATm or BCATc) and double (BCATc-BCATm) deletions in single and double positive CD4+ and CD8+ T cells of the newly established T-BCATmKO, T-BCATcKO and T-BcKOBmKO mouse lines. As control littermates, T-BCATmfl/fl, T-BCATcfl/fl and T-Bcfl/flBmfl/fl mice carrying the loxP-flanked Bcat2 or Bcat1 or the combination of the loxP-flanked Bcat1 and Bcat2 alleles in homozygous states were used. PCR genotyping was performed on mouse ear genomic DNA using primers shown in Supplementary Table 4. Additional details are in the Supplementary information (Sections 15–16).
Cancer cell lines
Human Jurkat T cells (clone E6-1, Cat # TIB-152) and the murine EG7 (EL4-OVA, Cat # CRL-2113) cells expressing chicken ovalbumin (OVA), were purchased from ATCC (Manassas, VA). The cells were maintained in RPMI-1640 medium (CellGro, Corning, NY) supplemented with 10% FBS, 100 IU/ml penicillin, 100 μg/ml streptomycin and 0.05 mM β-ME (EL4-OVA) in a tissue culture incubator at 37 °C and 5% CO2. The OVA antigen was maintained in the presence of 0.04 mg/ml G418. Cells were allowed 1–3 passages, free of mycoplasma, and their identity was confirmed by short tandem repeats (STR) analysis (LabCorp, Burlington, NC). Refer to Supplementary information (Section 16) for more details.
In vivo tumour mouse studies
Male and female T-BCATmfl/fl, T-BCATmKO, male T-BCATcfl/fl, T-BCATcKO, and male T-Bcfl/flBmfl/fl and T-BcKOBmKO mice, age 8–15 weeks, received s.c. injections of 2.5 × 10⁵ EL4-OVA cells in 100 μl sterile 1X PBS buffer on the lower back. Vehicle controls received 100 μl sterile 1X PBS buffer. Mice were caged individually, and food intake and body weight were measured daily. Tumour volumes were measured daily with a digital caliper (formula: length × (width)2/2) until day 15. Tumours and organs were weighed and stored at −80 °C. Additional details are in the Supplementary information (sections 1–8).
T-cell isolation, expansion, and activation
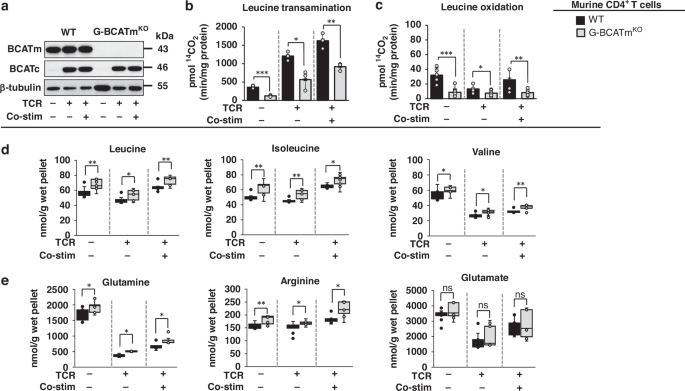
Spleens and lymph nodes from WT, G-BCATmKO, T-BCATmfl/fl, T-BCATmKO, T-Bcfl/flBmfl/fl and T-BcKOBmKO mice, were pooled to increase T-cell yield (n ≥ 2–3 spleens/variant) and passed through a 70–100 µm strainer followed by lysis with ACK buffer to remove red blood cells. CD4+ T cells were isolated via negative magnetic separation using a CD4+ T-cell isolation kit (Miltenyi Biotec, Gaithersburg, Maryland) and activated with 2 µg/ml anti-CD3/anti-CD28 for 48 h and expanded with 20 ng/ml IL–2 for 2–3 days as described [21]. The cells were left unstimulated or stimulated with anti-CD3 (T-cell receptor [TCR]-stimulated, or also referred to as anergic), or anti-CD3/anti-CD28 (co-stimulated or also referred to as activated) for 24–72 h. Some cells were simultaneously treated with 20 mM NALA or 50 µM BCAT-IN-2.
CD8+ T cells were isolated via negative magnetic separation using a CD8+ T cell isolation kit (Miltenyi Biotec, Gaithersburg, Maryland) and stimulated with 3 µg/ml anti-CD3/anti-CD28 for 48 h. Mouse IL-2 (20 ng/ml) and IL-7(5 ng/ml) were added 24 h post activation. This is referred to as the “activation phase”. After 48 h, 1 × 10⁶ cells were sub-cultured for an additional 48 h (96 h expansion), without antibodies, but in the presence of IL-2 and IL-7 (referred to as the “expansion phase”). Following these phases, cells were collected, washed twice in ice-cold 1X PBS buffer, pelleted at 13,200 rpm for 7 min at 4 °C, and stored at −80 °C along with collected supernatants.
Leucine oxidation and transamination assay
Previously experienced, unstimulated, TCR-stimulated, or co-stimulated CD4+ T cells from WT and G-BCATmKO mice, or CD4+ T cells from T-Bcfl/flBmfl/fl and T-BcKOBmKO mice, activated with 2 µg/ml anti-CD3/anti-CD28 for 48 h, or untreated Jurkat T cells, were incubated in Krebs buffer in the presence of 14C-leucine to determine the rates of leucine oxidation and transamination as described [21]. Results were represented as picomoles of released 14CO2/min/mg protein.
Amino acid analysis
Amino acid concentrations in cell pellets (nmol/g wet pellet) and supernatants (μM) from previously experienced, unstimulated, TCR-stimulated, or co-stimulated CD4+ T cells from WT and G-BCATmKO mice were measured by HPLC after ophthaldialdehyde derivatization on a Supelcosil™ LC-18 column (15 cm × 4.6 mm, 3 μm) (Sigma, St. Louis, MO) as described [21].
Measurements of glucose and oxygen metabolism
Glucose and oxygen metabolism were measured in previously experienced, unstimulated, TCR-stimulated, or co-stimulated CD4+ T cells from WT and G-BCATmKO mice. The cell preparation and the measurement of glucose metabolism were described [21]. Oxygen metabolism was determined in the same variants with the following specifications. XF24 flux analyser (Agilent, Santa Clara, CA) was used to measure the oxygen consumption rate (OCR) in the presence of oligomycin (Olg,1 µM) to inhibit ATP synthesis, the uncoupler FCCP (1.5–2 µM) of the oxidative phosphorylation, and antimycin and rotenone (A/R, 0.5–1 µM) to inhibit the electron transport chain (ETC). Mitochondrial respiration was calculated by subtracting the non-mitochondrial OCR from the FCCP-OCR. The spared respiratory capacity (SRC) was calculated by subtracting the basal-OCR from the maximal respiration rate after injecting FCCP. OCR-ATP (oxygen consumed for ATP production) was calculated by subtracting OCR after oligomycin from the basal-OCR. The mitochondrial ATP production was calculated by the formula: mitoATP rate = OCR-ATP × 2 × 2.75 (2.75 is the phosphorus/oxygen ratio, Agilent software). The coupling efficiency was calculated by the formula: (ATP production rate)/(basal respiration rate) x 100%. The glycolytic rate, glycolytic capacity, mitochondrial respiration, SRC, mitochondrial ATP production, and coupling efficiency were normalised against the unstimulated WT T cells followed by calculation of percentage difference between T cells from G-BCATmKO and WT mice for the remaining variants.
Western blotting assay
Protein from murine CD4+ and CD8+ T cells, or human Jurkat T cells, or mouse tissues, was subjected to BCA protein assay (Thermo Scientific, Waltham, MA) followed by western blotting as described [21]. Protein bands detected using a developer and x-ray films were photographed, and band intensities quantified with Image J [23]. Protein bands corresponding to BCATc, BCATm, BAX, BCKDH-E1α, BCKDH-E2, Hexokinase II, NDUFSI, CD244, cytochrome c, COX IV, LAG3, TOX, TIM-3, TIGIT, TCF1/7, were normalised to β-tubulin or GAPDH, while those corresponding to S6, P-S6, AMPK, P-AMPK, LDHA, P-LDHA, Rb, P-Rb were represented as the ratio between the phosphorylated (P) and total concentrations of S6, AMPK, LDHA, or Rb, respectively. The antibodies are listed in Supplementary Table 1. Results are shown as a percentage of the corresponding control.
Flow cytometry
Spleens, lymph nodes, and thymuses from T-BCATmfl/fl and T-BCATmKO mice, were homogenised and subjected to ACK lysis (spleens only) as described above. EL4-OVA tumours from T-BCATmfl/fl and T-BCATmKO mice were dissociated using the tumour dissociation kit (Miltenyi Biotec, Gaithersburg, Maryland) and the gentle MACs OctoDissociator following the manufacturer’s recommendations. 1 × 10⁶ cells/variant were stained with fluorescently-conjugated antibodies targeting CD4, CD8, CD62L, CD127, and KLRG1 in ice-cold stain buffer (BD Pharmingen, Cat # 554656) for 30 min in the dark. Flow cytometry was performed using the Attune NxT acoustic focusing flow cytometer (Thermo Scientific, Waltham, MA) and results were analysed with FlowJo v10. The antibodies are listed in Supplementary Table 1. The gating strategy is shown in Supplementary Fig. 1.
IFN-γ, perforin, and granzyme B, ELISA assays
Supernatants from previously experienced and co-stimulated (24–72 h) T-BCATmfl/fl and T-BCATmKO CD4+ T cells or T-BCATmfl/fl and T-BCATmKO CD8+ T cells were subjected to ELISA to determine the extracellular secretion of IFN-γ (CD4+ T cells, Tonbo BioSciences, San Deigo, CA), perforin (CD8+ T cells, Novus Biologicals, Centennial, CO) or granzyme B (CD8+ T cells (Thermo Scientific, Waltham, MA) by following the manufacturer instructions. Results are shown as picograms (pg) of secreted cytokine/1×106 cells, or nanograms (ng) of secreted cytokine/mg protein.
Cytotoxic killing assay
EL4-OVA cells (10 × 106/reaction) were transfected with 0.4 μg pRL Renilla luciferase vector (Promega, Madison, WI, Cat # E2231), via electroporation (Bio-Rad Gene Pulser, Bio-Rad, Hercules, CA), prior to co-culturing with expanded T-BCATmfl/fl or T-BCATmKO CD8+ T cells. Electroporated, but un-transfected, or Renilla-transfected, but cultured alone, EL4-OVA cells served as un-transfected and transfected controls, respectively. EL4-OVA and CD8+ T cells were co-cultured at a ratio of 1:2.5 and incubated in T-cell medium for 7 h followed by measurement of luminescence released by the EL4-OVA cells. Luminescence was detected using the dual luciferase reporter assay following the manufacturer instructions (Promega, Madison, WI, Cat # E1910).
siRNA transfection and electroporation
Jurkat T cells (10 × 106/variant) were washed with ice-cold 1X PBS buffer and resuspended in 1 M transfection buffer (5 mM KCI, 15 mM MgCI2, 120 mM Na2HPO4/NaH2PO4, pH 7.2, 50 mM mannitol) in the presence of 200 nM control-siRNA or BCAT2-siRNA #1 or #2. Cells were subjected to electroporation to allow entry of siRNAs and left on ice for 30 min before transferring to 25 cm2 flasks supplemented with RPMI-1640 in the absence of FBS or antibiotics for 24 h. After 24 h, fresh media with 10% FBS was added, and cells were incubated for an additional 48 h. At the end of the siRNA transfection (72 h), cells were used in assays or washed twice in ice-cold 1X PBS buffer, pelleted at 13,200 rpm for 7 min at 4 °C, and stored at −80 °C.
Quantitative RT-qPCR
Total mRNA was extracted from CD4+ T cells of T-BcKOBmKO mice and littermate controls using the SV total RNA isolation kit (Promega, Madison WI) followed by cDNA synthesis using GoTaq 2-Step RT-qPCR kit (Promega, Madison WI). cDNA was quantified using Nanodrop8000 (Thermo Scientific, Waltham, MA). RT-qPCR was performed utilising the Biorad iTAQ Universal SYBR green super mix (Thermo Scientific, Waltham, MA). Primers used to amplify Bcat1, Bcat2 and the eukaryotic translation elongation factor 1-alpha (Ef1α) (internal control) are in Supplementary Table 4. Fold changes in the expression of Bcat1 and Bcat2 were analysed using the ΔΔCt method and normalised to the expression of Ef1α. Results were presented as fold difference from CD4+ T cells of littermate controls.
Cell cycle assay
Previously experienced CD4+ T cells from T-BCATmfl/fl and T-BCATmKO mice were co-stimulated for 24–48 h and fixed with 66% ethanol for up to 7 days followed by incubation in 50 mg/ml PI and 100 mg/ml RNase A staining solution for 30 min in the dark as described [21]. FACS (Becton, Franklin Lakes, NJ) was used to monitor the progression of the cells through the cell cycle.
Cell viability assay
Jurkat T cells (10 × 106/variant, n = 3 independent cultures with n = 3 technical replicates) transfected with control siRNA or BCAT2-siRNA (#1 or #2) were incubated with 0.5 mg/mL MTT (Tocris, Bristol, UK) for 1 h at 37 °C until it was reduced to an insoluble formazan. Formazan was solubilized with DMSO, and the absorbance of the resultant purple colour was read at 570 and 620 nm using a plate reader. Cell viability was calculated as a percentage from control cells.
Cell proliferation assay
Jurkat T cells (10 × 106/variant, n = 3 independent cultures with n = 3 technical replicates) transfected with control-siRNA or BCAT2-siRNA (#1 or #2) were permeabilized to allow for uptake of Ki67 or control (IgG isotope) antibodies as guided by the Muse Ki67 proliferation kit (Luminex, Austin, TX, cat# MCH100114). Proliferation was assessed using the Guava Muse cell analyser (Luminex, Austin, TX) by following the manufacturer recommendations. The percentage of undivided and divided Ki67 cells was normalised to IgG isotope treated cells.
Statistical analysis
A two-tailed Student’s t test was used to determine statistically significant differences between each two groups of untreated (or in some experiments, NALA or BCAT-IN-2 -treated) CD4+ or CD8+ T cells from WT and G-BCATmKO mice, or T-BCATmfl/fl and T-BCATmKO mice, or spleen, lymph nodes, thymus, or tumours from T-BCATmfl/fl and T-BCATmKO mice, or T-Bcfl/flBmfl/fl and T-BcKOBmKO mice (tumours only), or Jurkat T cells. One-way ANOVA was used to determine statistically significant differences between vehicle or OVA-inoculated male and female T-BCATmfl/fl and T-BCATmKO mice, or male T-BCATcfl/fl and T-BCATcKO mice, or T-Bcfl/flBmfl/fl and T-BcKOBmKO mice, over time. The in vitro data was analysed as a mixed sex (mouse T cells). Values were presented as mean ± SEM when 3 or more independent experiments or biological replicates were averaged or ± SD when a single representative experiment was shown. Each individual assay was run in n = 3–9 technical replicates/variant. The number of experiments or biological replicates is indicated in the figure legends. P ≤ 0.05 was considered statistically significant.